

INTRODUCTION
Oncogenic translocations involving the neurotrophic receptor tyrosine kinase genes (NTRK1, NTRK2, and NTRK3), which encode the 3 tropomyosin receptor kinases (TRKs; TRKA, TRKB, and TRKC), produce fusions linking the NTRK kinase domain to the transcriptional regulatory elements and upstream coding regions of a variety of genes. These fusions lead to aberrant TRK kinase activity, driving oncogenesis.1 TRK fusions can be targeted with TRK inhibitors (TRKis), including larotrectinib2 and entrectinib,3 which are well tolerated and effective in approximately 75% of patients with NTRK-translocated tumors, often producing durable responses.
Acquired resistance to first-generation TRKis arises from secondary mutations within the ATP binding pocket of the kinase domain; these include solvent-front substitutions, gatekeeper mutations, and xDFG-motif substitutions in the activation loop.4,5 Second-generation TRKis such as repotrectinib and selitrectinib overcome these resistance mechanisms by contacting different sites within the kinase domain.6,7 In a preliminary report, patients with tumors bearing solvent-front substitutions had a response rate of 50% to second-generation TRKis.8 Mechanisms of resistance to second-generation TRKis are not well described.
CASE REPORT
A 47-year-old woman presented to an outside hospital with abdominal pain and bloody diarrhea. A rectal mass was identified and resected (Fig 1A; surgery 1 [S1]). A diagnosis of GI stromal tumor was considered, but immunohistochemistry was negative for c-KIT and positive for DOG-1. At the Dana-Farber/Brigham and Women’s Cancer Center (DF/BWCC), a diagnosis of unclassified sarcoma, not otherwise specified, was made. Five months later, the patient developed symptomatic locoregional recurrence with liver and lung metastases, which was resected (S2). A TPM3-NTRK1 fusion was identified using 2 different next-generation sequencing (NGS) panels (Table 1) and retrospectively identified in S1. The patient was enrolled on a phase II trial (ClinicalTrials.gov identifier: NCT02576431) of larotrectinib (100 mg twice a day), with an initial objective partial response (Figs 1B and 1C). After 6 months on study, restaging scans identified an isolated area of progression in the right hepatic lobe, which was resected (S3), followed by resumption of larotrectinib. NGS from S3 identified an NTRK1 G595R solvent-front mutation. Three months later, diffuse disease was noted on restaging scans (Fig 1D). An expanded-access, single-patient protocol was initiated using selitrectinib (100 mg twice a day) with dose escalated at cycle 2 to 150 mg twice a day as a result of low plasma drug levels. A partial response was achieved at 3 months, with dramatic reduction in fluorodeoxyglucose uptake within the tumor (Fig 1E). After 5 months, isolated progression of a perihepatic mass was identified and resected (S4). When a second site of progression in the sacrum was identified 1 month later, selitrectinib was increased to 200 mg twice a day with an associated increase in plasma drug levels (Fig 1F). The progressing tumor continued to grow slowly and was resected 3 months later (S5). Selitrectinib was resumed postoperatively, and the patient has remained free of disease progression for > 1 year.
FIG 1.
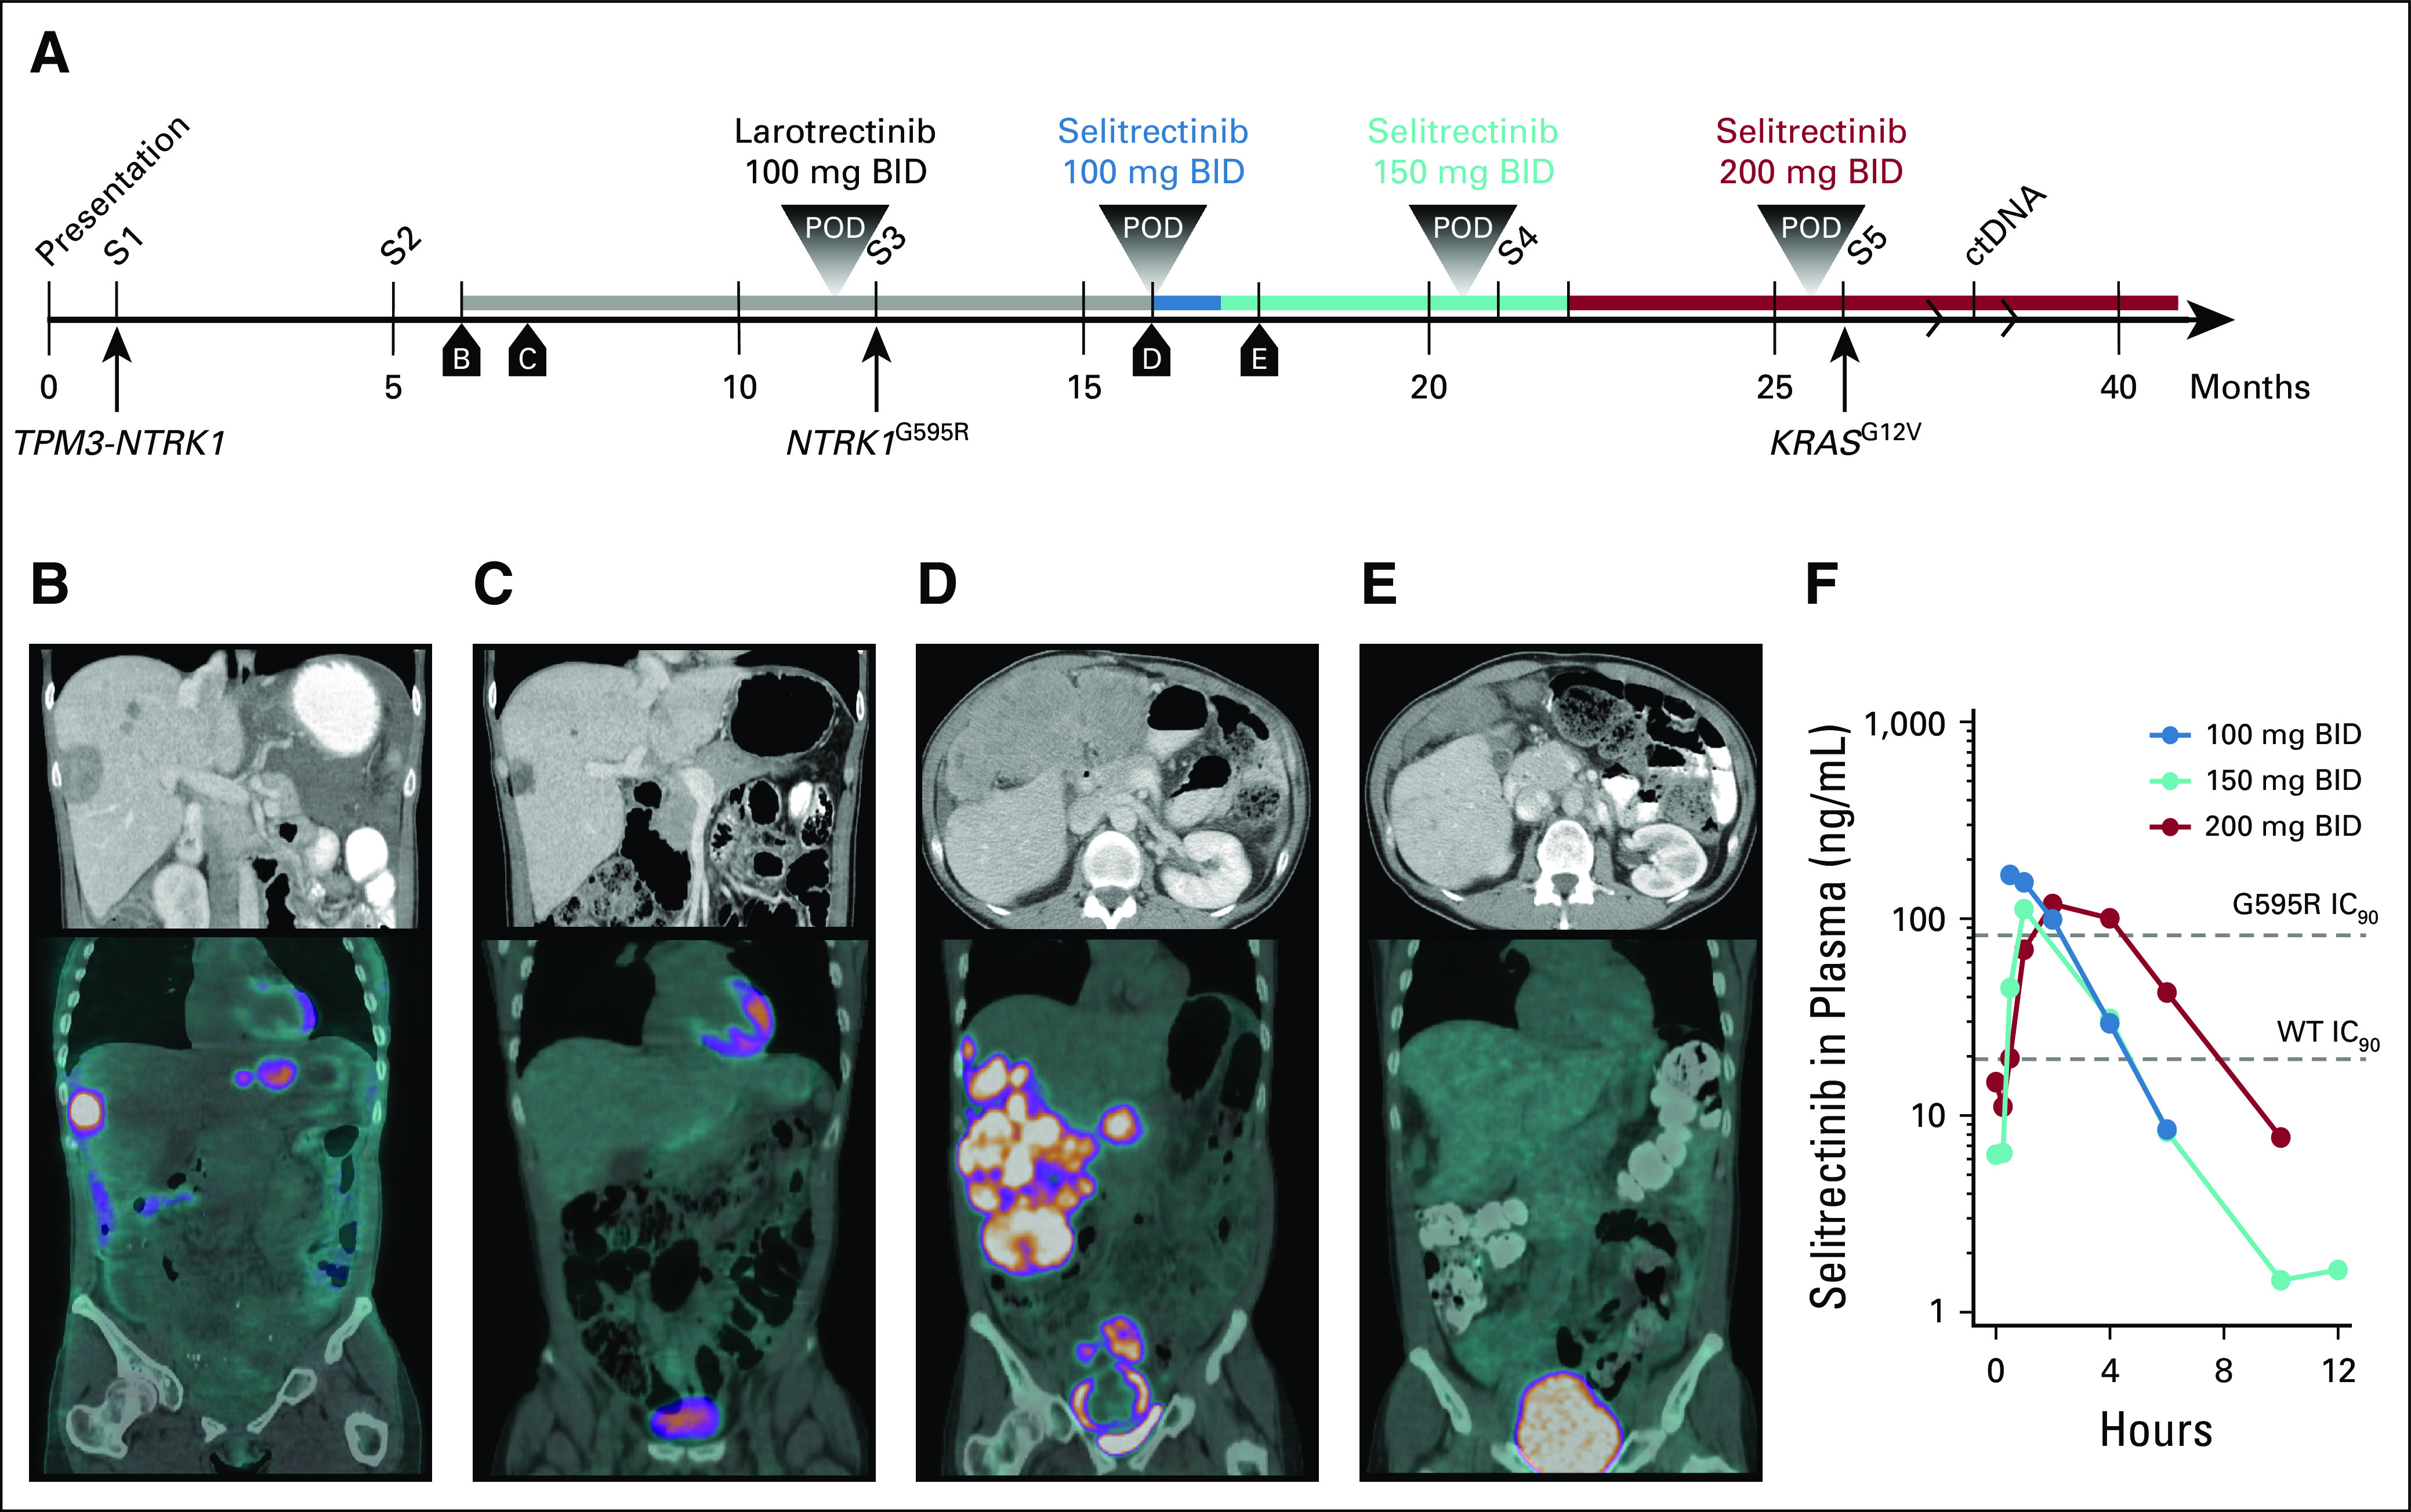
Treatment timeline and assessments. (A) Timeline of diagnosis and therapeutic interventions. Surgeries are numbered sequentially, and boxed lettering indicates the time of computed tomography (CT) and positron emission tomography (PET)-CT imaging. (B-E) Contrast-enhanced CT scans (top panels) and PET-CT images (bottom panels) from patient staging scans as indicated on the timeline. (F) Plasma levels over time of selitrectinib at the indicated dose levels. Data from each dosing point are derived from cycle 1, day 1 pharmacokinetic studies. Dashed lines indicating the 90% inhibitory concentration (IC90) of wild-type (WT) and G595R-mutant TRKA are shown. BID, twice a day; ctDNA, circulating tumor DNA; POD, progression of disease; S, surgery.
TABLE 1.
Diagnosis, Treatment, and NGS Testing

MATERIALS AND METHODS
Informed Consent
Patients provided informed consent for these institutional review board–approved studies and correlative analyses. We obtained all permissions required by law and the DF/BWCC for publication.
Tumor Sequencing and Analysis
Targeted NGS was performed using the DF/BWCC OncoPanel9 or FoundationOne Heme (Foundation Medicine, Cambridge, MA) to assess > 400 cancer-associated genes and select translocations. RNA-seq using single-end 75–base pair reads was performed as previously described.10 Fastq files were aligned to hg19 using STAR,11 and expression was quantified using Cufflinks.12 Gene set enrichment analysis (GSEA)13 was performed using the Hallmark, KEGG, or Reactome databases. Data are publicly available (GSE132439). GUARDANT360 (Guardant Health, Redwood City, CA) circulating tumor DNA (ctDNA) sequencing was also performed.
CONTEXT
Key Objective
Mechanisms of resistance to second-generation tropomyosin receptor kinase (TRK) inhibitors are not well described.
Knowledge Generated
In this case report, we identified a gain-of-function KRAS mutation resulting in signal transduction pathway reactivation and associated tumor progression despite continuous TRK inhibitor therapy. Changes in the tumor microenvironment were identified, consisting of a significant increase in cytotoxic T cells and macrophages.
Relevance
These findings help define mechanisms of resistance to second-generation TRK inhibitors and suggest novel strategies to treat resistant disease.
Multiplexed Immunofluorescence
Tissue-based cyclic immunofluorescence (CyCIF) was performed on formalin-fixed paraffin-embedded specimens, as previously described,14 using qualified antibodies15 listed in Appendix Table A1 and uploaded to cycif.org.
Patient-Derived Models
Tumor was implanted subcutaneously into female nude mice (NU/NU; Charles River Laboratories, Wilmington, MA) to produce patient-derived xenografts (PDXs) following protocols approved by the institution’s Institutional Animal Care and Use Committee. Primary cultures were established by generating a tumor suspension and passaging adherent cells.
RESULTS
To explore resistance mechanisms to second-generation TRKis, we performed targeted NGS of inhibitor-sensitive and -resistant tumors. Compared with S3, which was sensitive to selitrectinib, S4 harbored a PTCH1 frameshift mutation (Table 1). PTCH1 normally functions as a tumor suppressor,16 and its inactivation promotes Hedgehog signaling. In addition to the PTCH1 mutation, S5 also harbored a KRAS G12V mutation and variants of unknown significance (Table 1). ctDNA sequencing after S5 failed to detect NTRK fusions or known tumor mutations. All sequenced tumors exhibited a likely inactivating PTEN rearrangement.
To characterize potential transcriptional mechanisms underlying selitrectinib resistance, we analyzed S3 and S5 by RNA-seq. A tumor from a separate patient with an ETV6-NTRK3 translocated sarcoma was also analyzed. Compared with the ETV6-NTRK3 tumor, all TPM3-NTRK1 tumors exhibited exclusive expression of NTRK1 exons associated with the oncogenic fusion (Fig 2A). Similar findings were observed in a cell line and PDX generated from S3 and S5 (Appendix Fig A1A). Although all samples expressed TPM3 and ETV6, only the ETV6-NTRK3 tumor expressed detectable NTRK3 transcript (Fig 2B). The S5 tumor treated with selitrectinib expressed lower levels of the TPM3-NTRK1 fusion transcript (Fig 2B). Using GSEA to explore pathways associated with selitrectinib resistance, the S5 tumor exhibited enrichment in KRAS-related signaling as compared with the S3 tumor (Fig 2C), consistent with oncogenic activation of KRAS signaling. An inflammatory response signature was similarly enriched in S5 compared with S3 (Fig 2D), and these gene sets showed similar enrichment in PDXs (Appendix Figs A1B and A1C). Through GSEA comparisons of multiple databases, S5 showed recurrent enrichment of immune- and inflammatory-related signatures as compared with S3 (Fig 2E). To further characterize the inflammatory infiltrate, we performed CIBERSORT analysis17; this showed that M1 macrophages and CD8 T-cell subsets were enriched in the S5 tumor (Fig 2F). Consistent with this analysis, levels for several markers of T cells (CD8A and CD3), T-cell activation (CD48), macrophages (CD68), and several modulators of the immune microenvironment18 were higher in S5 (Fig 2G). Despite the loss-of-function mutation in PTCH1, we found no evidence of activation of the Hedgehog signaling pathway by RNA-seq (Appendix Figs A2A and A2B).
FIG 2.
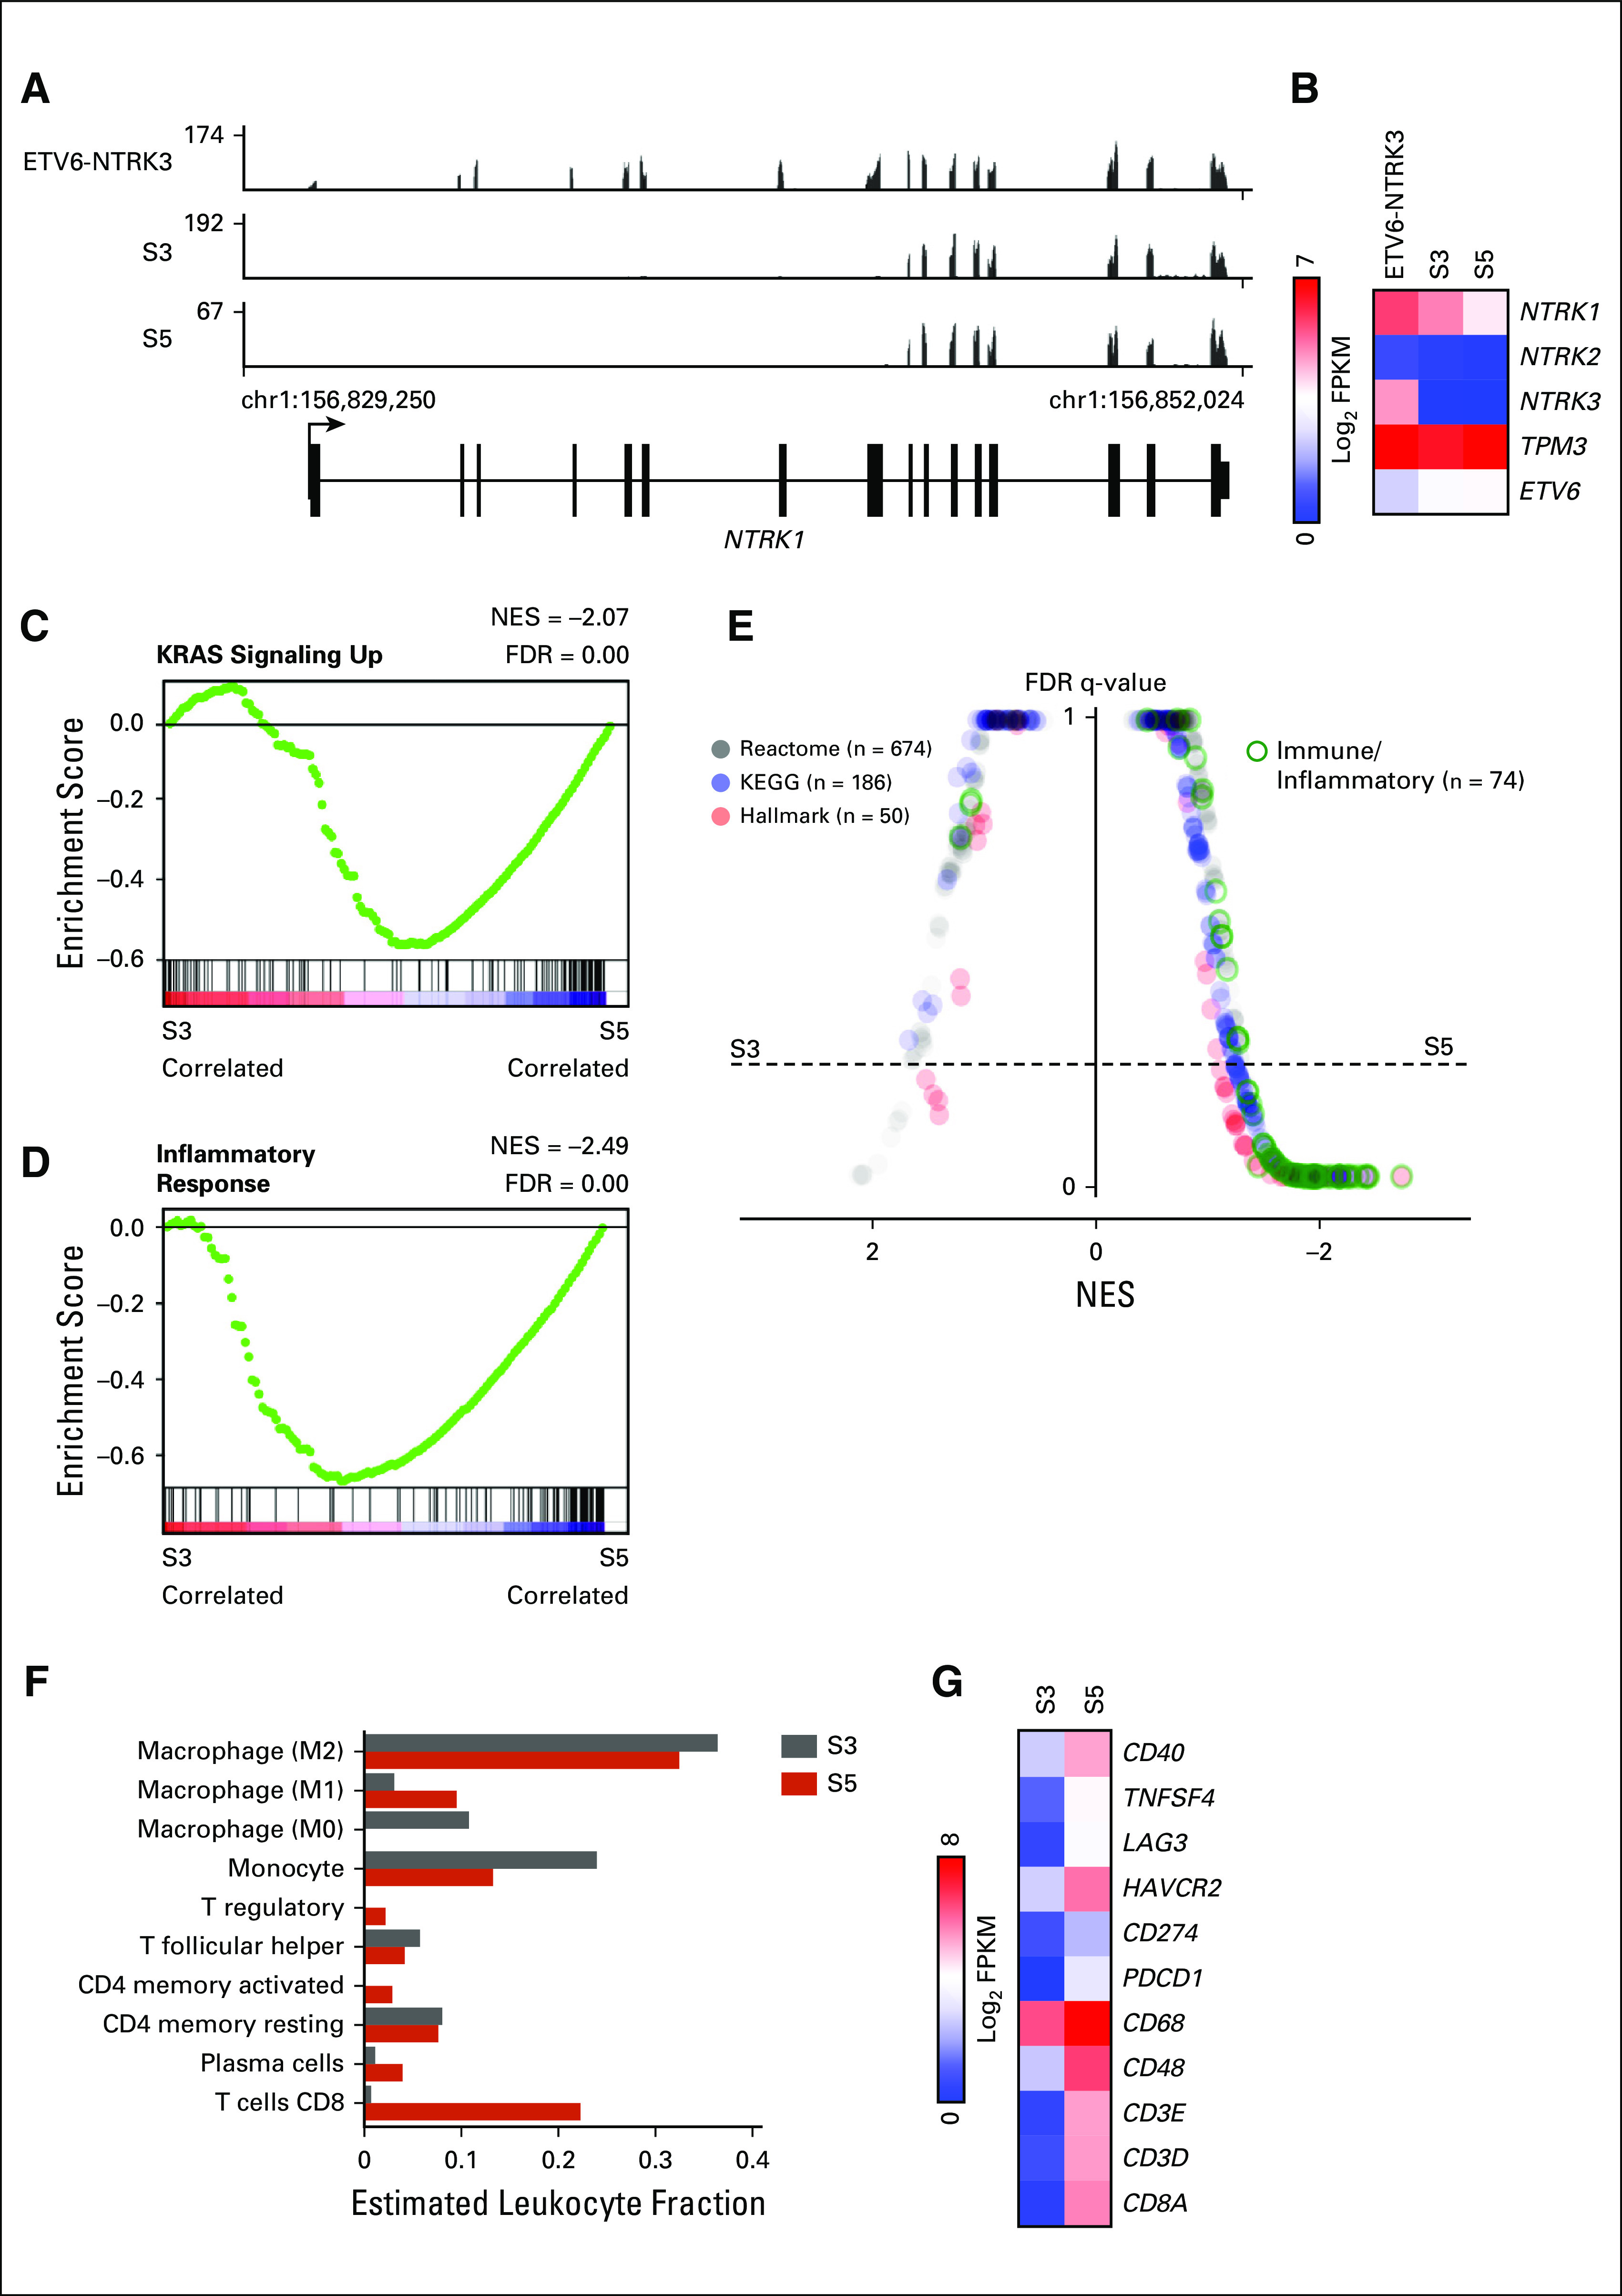
Expression profiling of selitrectinib-sensitive and -resistant samples. (A) Plot of mapped RNA-seq reads at the NTRK1 locus for an ETV6-NTRK3 tumor and TPM3-NTRK1 tumors from surgery (S) 3 and S5. (B) Heatmap of RNA-seq data demonstrating expression of NTRK genes and fusion partners. (C and D) Hallmark gene sets for KRAS signaling up and inflammatory response comparing S3 and S5. (E) Butterfly plot of all Reactome, KEGG, and Hallmark gene sets (n = 910) comparing S3 and S5 tumors. Immune and inflammatory gene sets are outlined in green. (F) CIBERSORT analysis of S3 and S5 tumors showing relative leukocyte abundance. Cell types with nonzero leukocyte fraction are shown. (G) Heatmap showing relative expression of select immune-related genes. FDR, false discovery rate; NES, normalized enrichment score.
To further characterize the tumor microenvironment and its organization, we performed multiplexed immunofluorescence imaging (CyCIF)14 of S2, S3, and S5 followed by single-cell analysis. All tumors stained positive for TRK, with evidence of inflammatory infiltrates in S3 and S5 (Fig 3A). Compared with S2, S3 and, to a greater extent, S5 had a higher density of CD45+ immune cells including cytotoxic T cells and CD68+ macrophages (Fig 3B). Infiltration by these immune cells was significantly greater in S5, in agreement with transcriptional profiling results. Spatial neighborhood analysis showed that S5 had more CD68+ macrophages and CD8a+ T cells surrounding tumor cells as compared with S3 (Figs 3C to 3E, Appendix Fig A3). Moreover, spatial analysis revealed a higher density of interfacing programmed cell death 1 (PD-1)–positive and programmed death ligand 1 (PD-L1)–positive cells in S3 than S5 (Fig 3F-G).
FIG 3.

Multiplexed imaging of the immune microenvironment in serial tumor resections. (A) Tissue-based cyclic immunofluorescence images from surgery (S) 2, S3, and S5 samples demonstrating staining for tropomyosin receptor kinase (TRK), CD45, and CD68, with lower panels representing magnified images of the upper panels. (B) Immune cell counts, with digital images from the indicated single or multiplexed antibodies processed as previously described.14 Cell counts were calculated frame by frame and are represented as box plots, with the median indicated in red. (C) Global distribution of cells staining highest for TRK (contour map) and CD68+ cells (heatmap, with red indicating higher cell density) in S3 and S5. (D and E) Histograms representing the number of CD68+ or CD8a+ cells neighboring TRKhigh cells. Cumulative probabilities in each imaged frame are shown as a box plot (inset). (F) Representative staining of programmed cell death 1 (PD-1) and programmed death ligand 1 (PD-L1) in samples S3 and S5, respectively. (G) Proximity probability of cells staining positive for PD-1 and PD-L1, with histogram representing the number of PD-L1–positive cells neighboring PD-1–positive cells. Cumulative probabilities in each imaged frame are shown as a box plot (inset). A two-sample t test was used to compare groups, with P values indicated; the frame numbers in each sample are 33 (S2), 127 (S3), and 168 (S5).
DISCUSSION
We report here a patient with a TPM3-NTRK1–driven sarcoma that developed resistance to first- and second-generation TRKis. The tumor initially developed resistance to larotrectinib through an NTRK1 solvent-front mutation; resistance was overcome with the second-generation TRKi selitrectinib. Two sites of focal progression were surgically resected while on selitrectinib. No clear secondary oncogenic mutation was identified in S4, and the dose of selitrectinib was increased to 200 mg twice a day. Isolated progression was observed at the high drug dose, the tumor was resected (S5), and the gain-of-function KRAS G12V mutation was identified. Transcriptional profiling was consistent with functional activation of KRAS signaling in this tumor.
Dysregulation of KRAS signaling in an NTRK fusion–driven sarcoma initially treated with effective TRKis is analogous to the well-characterized mechanism of acquired anti–epidermal growth factor receptor (EGFR) antibody resistance in colorectal cancer. In a subset of these tumors, KRAS mutations emerge to drive resistance to EGFR inhibition through reactivation of oncogenic signaling.19,20 We speculate that consequent reactivation of signal transduction pathways by mutant KRAS overcomes effective inhibition of the NTRK fusion oncogene. Elevated levels of TRK protein in S5 relative to S3 despite lower expression of the fusion transcript may further suggest effective TRK inhibition because kinase inhibition can stabilize kinase conformation, decrease protein turnover, and prolong half-life.21,22
Although the etiology of the increased inflammatory infiltrate in the KRAS G12V mutant tumor (S5) is unclear, evidence from other cancer types suggests that KRAS mutations may alter the immune microenvironment.23,24 Several targets of immuno-oncology therapies were expressed at higher levels in S5, suggesting an alternative means of targeting resistant disease (although the number of cells expressing PD-1 and PD-L1 protein was discordant with RNA expression, as has been observed elsewhere25). Furthermore, data from colorectal carcinoma suggests an association between kinase fusions and response to checkpoint inhibitor therapy,26 suggesting the rational combination of TRKis and immuno-oncology therapeutics for resistant disease.
As exemplified by this patient, treatment with second-generation TRKis can elicit durable response8; the patient remains well > 1 year on selitrectinib after the final resection. Imaging using [18F]fluorodeoxyglucose positron emission tomography may be a useful early marker of effective TRK inhibition and tumor response. Consistent with our findings on reactivation of the mitogen-activated protein kinase (MAPK) pathway as a mechanisms of TRKi resistance, alterations in BRAF, KRAS, and MET were recently reported to confer resistance to second-generation TRKis in carcinomas, with clinical benefit derived from targeting the reactivated signal transduction pathways.27,28 These results provide insight into mechanisms of pathway reactivation under conditions of continued TRK inhibition and identify changes in the immune microenvironment that may play important roles in the diagnosis and treatment of resistant disease.
ACKNOWLEDGMENT
We thank LOXO Oncology for providing pharmacokinetic data.
Appendix
FIG A1.

Expression profiling of NTRK translocated models. (A) Plot of mapped RNA-seq reads at the NTRK1 locus for an ETV6-NTRK3 tumor and TPM3-NTRK1 tumors from surgery (S) 3, S3 patient-derived xenograft (PDX), S3 cell line, S5, and S5 PDX. (B and C) Hallmark gene set for KRAS signaling up and inflammatory response comparing S3 and S5 PDX grown in athymic, T-cell–deficient mice. FDR, false discovery rate; NES, normalized enrichment score.
FIG A2.

Hedgehog pathway gene expression. (A) Expression of genes in the KEGG Hedgehog signaling pathway gene set. (B) Heatmap of RNA-seq data showing expression of select genes essential to Hedgehog cellular signaling. PDX, patient-derived xenograft; S, surgery.
FIG A3.

Colocalization of CD8a+ and TRKhigh cells. Global distribution of cells staining highest for tropomyosin receptor kinase (TRK; contour map) and CD8a+ cells (heatmap, with red indicating higher cell density) in surgery (S) 3 and S5.
TABLE A1.
Antibodies Used for t-CyCIF

Footnotes
Supported by National Institutes of Health (NIH) Grant No. U54-CA225088 (P.K.S. and S.S.), Harvard Catalyst Medical Research Investigator Training Program NIH Award No. UL 1TR002541 (M.L.H.), Brigham and Women’s Hospital Program in Precision Medicine (A.M.E.), and the Ludwig Center at Harvard (P.K.S., S.S., and G.D.D.).
AUTHOR CONTRIBUTIONS
Conception and design: Matthew L. Hemming, Michael J. Nathenson, Jia-Ren Lin, Shaolin Mei, Peter K. Sorger, George D. Demetri, Sandro Santagata
Financial support: Matthew L. Hemming, Peter K. Sorger, George D. Demetri, Sandro Santagata
Administrative support: Peter K. Sorger, Sandro Santagata
Provision of study materials or patients: Matthew L. Hemming, Peter K. Sorger, Monica Bertagnolli, Ewa Sicinska, George D. Demetri, Sandro Santagata
Collection and assembly of data: Matthew L. Hemming, Michael J. Nathenson, Jia-Ren Lin, Shaolin Mei, Karan Malik, Adrian Marino-Enriquez, Ewa Sicinska, George D. Demetri
Data analysis and interpretation: Matthew L. Hemming, Michael J. Nathenson, Jia-Ren Lin, Shaolin Mei, Ziming Du, Adrian Marino-Enriquez, Jyothi P. Jagannathan, Monica Bertagnolli, George D. Demetri, Sandro Santagata
Manuscript writing: All authors
Final approval of manuscript: All authors
Accountable for all aspects of the work: All authors
AUTHORS' DISCLOSURES OF POTENTIAL CONFLICTS OF INTEREST
The following represents disclosure information provided by authors of this manuscript. All relationships are considered compensated unless otherwise noted. Relationships are self-held unless noted. I = Immediate Family Member, Inst = My Institution. Relationships may not relate to the subject matter of this manuscript. For more information about ASCO's conflict of interest policy, please refer to www.asco.org/rwc or ascopubs.org/po/author-center.
Open Payments is a public database containing information reported by companies about payments made to US-licensed physicians (Open Payments).
Peter K. Sorger
Leadership: RareCyte, Merrimack, Applied BioMath
Stock and Other Ownership Interests: RareCyte, Merrimack Pharma, Applied BioMath, Glencoe Software
Honoraria: Novartis
Research Funding: Merck (Inst)
Monica Bertagnolli
Research Funding: AbbVie (Inst), Agenus (Inst), Astellas Pharma (Inst), AstraZeneca (Inst), Breast Cancer Research Foundation (Inst), Bristol-Myers Squibb (Inst), Celgene (Inst), Complion (Inst), Exelixis (Inst), Genentech (Inst), GHI Pharma (Inst), Gilead Sciences (Inst), GlaxoSmithKline (Inst), Incyte (Inst), Jazz Pharmaceuticals (Inst), Leidos (Inst), Eli Lilly (Inst), Matrex (Inst), Mayo Clinic (Inst), MGH (Inst), Millennium Pharmaceuticals (Inst), Novartis (Inst), Patient-Centered Outcomes Research Institute (PCORI) (Inst), Pfizer (Inst), Robert Wood Johnson Foundation (Inst), Sagerock Advisors (Inst), Taiho Pharmaceutical (Inst), Bayer Health (Inst), Eisai (Inst), Leidos (Inst), Lexicon (Inst), Merck (Inst), Pharmacyclics (Inst), Takeda (Inst), Tesaro (Inst), Baxalta (Inst), Sanofi (Inst), Teva (Inst), Janssen (Inst), Merck (Inst)
Uncompensated Relationships: Leap Therapeutics, Syntimmune, Syntalogic
Open Payments Link: https://openpaymentsdata.cms.gov/physician/114497/summary
George D. Demetri
Leadership: Blueprint Medicines, Merrimack
Stock and Other Ownership Interests: Blueprint Medicines, G1 Therapeutics, Bessor Pharma, Caris Life Sciences, Champions Oncology, Merrimack, Erasca
Consulting or Advisory Role: Bayer, Pfizer, Novartis, EMD Serono, Sanofi, Janssen Oncology, PharmaMar, Daiichi Sankyo, Blueprint Medicines, WIRB-Copernicus Group, ZIOPHARM Oncology, Polaris, G1 Therapeutics, Caris Life Sciences, Adaptimmune, Ignyta, Genentech, Loxo, Mirati Therapeutics, M.J. Hennessey/OncLive, Medscape, ICON Clinical Research
Research Funding: AbbVie (Inst), Janssen Oncology (Inst), Bayer (Inst), Novartis (Inst), Pfizer (Inst), Ignyta (Inst), Genentech (Inst), Loxo (Inst), AbbVie (Inst), Epizyme (Inst), Adaptimmune (Inst), GlaxoSmithKline (Inst)
Patents, Royalties, Other Intellectual Property: Patent on use of imatinib for GI stromal tumor, receive minor royalty payment from Dana-Farber after license between Dana-Farber and Novartis.
Sandro Santagata
Consulting or Advisory Role: RareCyte
Patents, Royalties, Other Intellectual Property: US9696313B2 (HSF1 as a marker in tumor prognosis and treatment), US20150241436A1 (Hsf1 and hsf1 cancer signature set genes and uses relating thereto), US20170037480A1 (Hsf1 in tumor stroma), US20170037480A1 (Hsf1 in tumor stroma), US20180306796A1 (Methods and compositions relating to proteasome inhibitor resistance), Combination Treatments of Hsp90 Inhibitors for Enhancing Tumor Immunogenicity and Methods of Use Thereof (application pending), Targeted Manipulation of the Proteasome Subunit Expression Levels as a Method for Curing Cancer (application pending).
No other potential conflicts of interest were reported.
REFERENCES
- 1.Amatu A, Sartore-Bianchi A, Siena S. NTRK gene fusions as novel targets of cancer therapy across multiple tumour types. ESMO Open. 2016;1:e000023. doi: 10.1136/esmoopen-2015-000023. [DOI] [PMC free article] [PubMed] [Google Scholar]
- 2.Drilon A, Laetsch TW, Kummar S, et al. Efficacy of larotrectinib in TRK fusion-positive cancers in adults and children. N Engl J Med. 2018;378:731–739. doi: 10.1056/NEJMoa1714448. [DOI] [PMC free article] [PubMed] [Google Scholar]
- 3.Drilon A, Siena S, Ou SI, et al. Safety and antitumor activity of the multitargeted pan-TRK, ROS1, and ALK inhibitor entrectinib: Combined results from two phase I trials (ALKA-372-001 and STARTRK-1) Cancer Discov. 2017;7:400–409. doi: 10.1158/2159-8290.CD-16-1237. [DOI] [PMC free article] [PubMed] [Google Scholar]
- 4.Russo M, Misale S, Wei G, et al. Acquired resistance to the TRK inhibitor entrectinib in colorectal cancer. Cancer Discov. 2016;6:36–44. doi: 10.1158/2159-8290.CD-15-0940. [DOI] [PubMed] [Google Scholar]
- 5.Cocco E, Scaltriti M, Drilon A. NTRK fusion-positive cancers and TRK inhibitor therapy. Nat Rev Clin Oncol. 2018;15:731–747. doi: 10.1038/s41571-018-0113-0. [DOI] [PMC free article] [PubMed] [Google Scholar]
- 6.Drilon A, Nagasubramanian R, Blake JF, et al. A next-generation TRK kinase inhibitor overcomes acquired resistance to prior TRK kinase inhibition in patients with TRK fusion-positive solid tumors. Cancer Discov. 2017;7:963–972. doi: 10.1158/2159-8290.CD-17-0507. [DOI] [PMC free article] [PubMed] [Google Scholar]
- 7.Drilon A, Ou SI, Cho BC, et al. Repotrectinib (TPX-0005) is a next-generation ROS1/TRK/ALK inhibitor that potently inhibits ROS1/TRK/ALK solvent-front mutations. Cancer Discov. 2018;8:1227–1236. doi: 10.1158/2159-8290.CD-18-0484. [DOI] [PubMed] [Google Scholar]
- 8.Hyman D, Kummar S, Farago AF, et al. Phase I and expanded access experience of LOXO-195 (BAY 2731954), a selective next-generation TRK inhibitor (TRKi) Cancer Res. 2019;79 (abstr CT127) [Google Scholar]
- 9.Garcia EP, Minkovsky A, Jia Y, et al. Validation of OncoPanel: A targeted next-generation sequencing assay for the detection of somatic variants in cancer. Arch Pathol Lab Med. 2017;141:751–758. doi: 10.5858/arpa.2016-0527-OA. [DOI] [PubMed] [Google Scholar]
- 10.Hemming ML, Lawlor MA, Zeid R, et al. Gastrointestinal stromal tumor enhancers support a transcription factor network predictive of clinical outcome. Proc Natl Acad Sci USA. 2018;115:E5746–E5755. doi: 10.1073/pnas.1802079115. [DOI] [PMC free article] [PubMed] [Google Scholar]
- 11.Dobin A, Davis CA, Schlesinger F, et al. STAR: Ultrafast universal RNA-seq aligner. Bioinformatics. 2013;29:15–21. doi: 10.1093/bioinformatics/bts635. [DOI] [PMC free article] [PubMed] [Google Scholar]
- 12.Trapnell C, Williams BA, Pertea G, et al. Transcript assembly and quantification by RNA-Seq reveals unannotated transcripts and isoform switching during cell differentiation. Nat Biotechnol. 2010;28:511–515. doi: 10.1038/nbt.1621. [DOI] [PMC free article] [PubMed] [Google Scholar]
- 13.Subramanian A, Tamayo P, Mootha VK, et al. Gene set enrichment analysis: A knowledge-based approach for interpreting genome-wide expression profiles. Proc Natl Acad Sci USA. 2005;102:15545–15550. doi: 10.1073/pnas.0506580102. [DOI] [PMC free article] [PubMed] [Google Scholar]
- 14.Lin J-R, Izar B, Wang S, et al. Highly multiplexed immunofluorescence imaging of human tissues and tumors using t-CyCIF and conventional optical microscopes. eLife. 2018;7:545. doi: 10.7554/eLife.31657. [DOI] [PMC free article] [PubMed] [Google Scholar]
- 15.Du Z, Lin J-R, Rashid R, et al. Qualifying antibodies for image-based immune profiling and multiplexed tissue imaging. Nat Protoc. 2019;14:2900–2930. doi: 10.1038/s41596-019-0206-y. [DOI] [PMC free article] [PubMed] [Google Scholar]
- 16.Pan S, Dong Q, Sun LS, et al. Mechanisms of inactivation of PTCH1 gene in nevoid basal cell carcinoma syndrome: Modification of the two-hit hypothesis. Clin Cancer Res. 2010;16:442–450. doi: 10.1158/1078-0432.CCR-09-2574. [DOI] [PubMed] [Google Scholar]
- 17.Newman AM, Liu CL, Green MR, et al. Robust enumeration of cell subsets from tissue expression profiles. Nat Methods. 2015;12:453–457. doi: 10.1038/nmeth.3337. [DOI] [PMC free article] [PubMed] [Google Scholar]
- 18.Marshall HT, Djamgoz MBA. Immuno-oncology: Emerging targets and combination therapies. Front Oncol. 2018;8:315. doi: 10.3389/fonc.2018.00315. [DOI] [PMC free article] [PubMed] [Google Scholar]
- 19.Misale S, Yaeger R, Hobor S, et al. Emergence of KRAS mutations and acquired resistance to anti-EGFR therapy in colorectal cancer. Nature. 2012;486:532–536. doi: 10.1038/nature11156. [DOI] [PMC free article] [PubMed] [Google Scholar]
- 20.Zhao B, Wang L, Qiu H, et al. Mechanisms of resistance to anti-EGFR therapy in colorectal cancer. Oncotarget. 2017;8:3980–4000. doi: 10.18632/oncotarget.14012. [DOI] [PMC free article] [PubMed] [Google Scholar]
- 21.Miyazawa K, Toyama K, Gotoh A, et al. Ligand-dependent polyubiquitination of c-kit gene product: A possible mechanism of receptor down modulation in M07e cells. Blood. 1994;83:137–145. [PubMed] [Google Scholar]
- 22.Scaltriti M, Verma C, Guzman M, et al. Lapatinib, a HER2 tyrosine kinase inhibitor, induces stabilization and accumulation of HER2 and potentiates trastuzumab-dependent cell cytotoxicity. Oncogene. 2009;28:803–814. doi: 10.1038/onc.2008.432. [DOI] [PubMed] [Google Scholar]
- 23.Dias Carvalho P, Guimarães CF, Cardoso AP, et al. KRAS oncogenic signaling extends beyond cancer cells to orchestrate the microenvironment. Cancer Res. 2018;78:7–14. doi: 10.1158/0008-5472.CAN-17-2084. [DOI] [PubMed] [Google Scholar]
- 24.Liao W, Overman MJ, Boutin AT, et al. KRAS-IRF2 axis drives immune suppression and immune therapy resistance in colorectal cancer. Cancer Cell. 2019;35:559–572.e7. doi: 10.1016/j.ccell.2019.02.008. [DOI] [PMC free article] [PubMed] [Google Scholar]
- 25.Coppock JD, Volaric AK, Mills AM, et al. Concordance levels of PD-L1 expression by immunohistochemistry, mRNA in situ hybridization, and outcome in lung carcinomas. Hum Pathol. 2018;82:282–288. doi: 10.1016/j.humpath.2018.07.025. [DOI] [PubMed] [Google Scholar]
- 26.Cocco E, Benhamida J, Middha S, et al. Colorectal carcinomas containing hypermethylated MLH1 promoter and wild-type BRAF/KRAS are enriched for targetable kinase fusions. Cancer Res. 2019;79:1047–1053. doi: 10.1158/0008-5472.CAN-18-3126. [DOI] [PMC free article] [PubMed] [Google Scholar]
- 27.Cocco E, Schram AM, Kulick A, et al. Resistance to TRK inhibition mediated by convergent MAPK pathway activation. Nat Med. 2019;25:1422–1427. doi: 10.1038/s41591-019-0542-z. [DOI] [PMC free article] [PubMed] [Google Scholar]
- 28.Doebele RC. Acquired resistance is oncogene and drug agnostic. Cancer Cell. 2019;36:347–349. doi: 10.1016/j.ccell.2019.09.011. [DOI] [PMC free article] [PubMed] [Google Scholar]