

Abstract
Summary: We describe the dynamics and the nature of the presymptomatic phase of multiple sclerosis (MS) in a patient for whom MR abnormalities suggestive of MS were found before the development of clinical symptoms. The patient was monitored with serial monthly MR imaging of the brain and spinal cord for 5 months. Disease activity during the presymptomatic phase showed imaging characteristics comparable to that of early relapsing-remitting MS in terms of enhancing lesions, duration of enhancement, and new lesions depicted by T2-weighted imaging. Measurements derived from magnetization transfer imaging suggested that the amount and degree of tissue destruction within and outside the lesions revealed by T2-weighted imaging were mild. This, together with the fact that only one of the 43 new lesions that developed during the presymptomatic phase was located in a neurologically eloquent area, may be the reason why, for a relatively long period, the patient had no clinical manifestations of MS despite the marked MR findings of disease activity.
Postmortem studies (1–5) have presented evidence that pathologic abnormalities compatible with a diagnosis of MS may occur within the CNS in the absence of neurologic symptoms. In addition, approximately 50% of the patients at presentation with clinically isolated syndromes suggestive of MS have multiple abnormalities shown on MR images of the brain (6–8), suggesting that the “true” onset of the disease may precede the appearance of the clinical symptoms.
In this study, we describe the dynamics and the nature of the presymptomatic phase of MS in a patient for whom MR abnormalities suggestive of MS were found before the development of clinical symptoms. The patient was monitored with serial monthly MR imaging of the brain and spinal cord.
Case Report
A 27-year-old woman presented for medical attention for mild head trauma after a car accident. The patient was seen a few hours after the trauma, and the results of general and neurologic examinations were negative. She had never suffered from any neurologic symptoms. The results of routine blood and urine examinations and ECG were also normal. After 1 week, for insurance reasons, dual-echo and contrast-enhanced T1-weighted conventional spin-echo MR imaging of the brain was performed. Multiple, discrete abnormalities, located mainly in supratentorial, periventricular white matter, were seen on the dual-echo images; three of them enhanced after the injection of 0.1 mmol/kg of contrast medium (Fig 1). No lesions were detected infratentorially. The patient was asked again about any possible previous neurologic symptoms, but she was not able to recall any abnormalities. She also denied any perinatal symptoms, previous head trauma, or headaches, and the remainder of her history was likewise negative. The results of blood and urine tests, performed to detect any other possible general disease with the potential for involving the CNS (9), were negative. The results of the Kveim test and the chest radiographs were negative. The patient underwent the Rao battery (10) for cognitive functioning assessment, and evoked responses (visual, brain stem auditory, somatosensory, and motor of upper and lower limbs). The results of all of these tests were negative. The patient refused a lumbar puncture.

Fig 1. Axial brain MR images of a patient with CDMS, obtained before the onset of clinical symptoms. On the proton density–weighted image (A), many periventricular and discrete white matter lesions are visible. Two of them enhance on the contrast-enhanced T1-weighted image (B)
After obtaining an informed consent and approval from the local Ethics Committee, the patient was asked to enter a monthly serial MR study for 5 months. The study started approximately 1 month after the first visit. At each of the six sessions, the following images of the brain were obtained: 1) 3300/16–98 (TR/TE range) dual-echo rapid-acquisition relaxation-enhanced with an echo train length of 5; 2) 9500/119/2200 (TR/TE/TI) fast-fluid-attenuated inversion recovery with an echo train length of 7; 3) 600/12 2D gradient-echo (α = 20°), with and without saturation pulse (the saturation pulse was an off-resonance RF pulse centered 1.5 kHz below the water frequency, with a gaussian envelope of 7.68-millisecond duration and α = 500°); 4) 768/14 T1-weighted; and 5) additional T1-weighted imaging after the injection of 0.1 mmol/kg of contrast medium. For all of the images, 24 contiguous interleaved axial sections were acquired with a 5-mm section thickness, 192 × 256 matrix, and 188 × 250 mm field of view, giving an in-plane spatial resolution of approximately 1 × 1 mm. Magnetization transfer (MT) images were obtained using the same acquisition parameters, except for the number of sections, which was 20. The set of sections for the MT images was positioned to obtain the same central 20 sections as those obtained for the dual-echo and T1-weighted images. Image repositioning was performed according to published guidelines (11). From the two gradient-echo images, with and without the saturation pulse, MT ratio (MTR) maps were derived pixel by pixel according to the equation, MTR = (M0—MS)/M0 × 100%, where M0 is the signal intensity for a given pixel without the saturation pulse and MS is the signal intensity for the same pixel when the saturation pulse is applied. At each of the six sessions, the following images of the spinal cord were obtained: 1) 3500/20/120 dual-echo rapid-acquisition relaxation-enhanced with an echo train length of 5; 2) 640/12 T1-weighted; and 3) another T1-weighted after the injection of 0.1 mmol/kg of contrast material. The spinal cord was imaged using a multicoil receiver array (12). For all of the images, 12 contiguous interleaved sagittal sections were acquired with a 3-mm section thickness, 250 × 500 matrix, and 260 × 512-mm field of view.
Lesion identification was performed by two experienced observers, and was agreed on by consensus. Lesions were classified according to their location (infratentorial, periventricular, discrete, and juxtacortical) and size (small, intermediate, and large), as described elsewhere (13). Lesion volume measurements on T1- and T2-weighted images were performed using a semiautomated segmentation technique based on local thresholding (14). Average lesion MTR was calculated as previously described (15). For new lesions appearing during the follow-up period, a ratio between their MTR values and those of four areas of normal-appearing white matter (NAWM) present on the same sections was obtained. To measure MTR in the NAWM, square regions of interest (ROI) of an area of 8.6 mm2 were used. This was compared with the results obtained, using the same technique, from 13 relapsing-remitting patients who underwent follow-up for 3 months with the same imaging procedure. For each MTR examination, 8.6 mm2 ROI also were placed in 11 different brain areas with NAWM, according to a previously published technique (16). The MTR of NAWM from the patient were compared with the MTR of white matter from 10 healthy control volunteers, obtained using the same approach. For each time point, brain MT histograms were obtained after the image postprocessing method described in detail by van Buchem et al (17) and Rovaris et al (15). An average brain MT histogram for the patient then was created and compared with that obtained from the healthy control volunteers. The following measures were compared: the relative peak height (ie, number of pixels at the most common MTR values), the peak position (ie, the most common MTR), and mean brain MTR. All histographically derived measures are representative of the tissue studied as a whole, thus including both MS lesions and normal-appearing white and gray matter (15, 17).
A total of 29 lesions were seen on the entry dual-echo images: one small lesion was infratentorial, 12 were periventricular (two small, five intermediate, and five large), six were discrete (four small and two intermediate), and 10 were juxtacortical (five small and five intermediate). No additional lesions were seen on the fast fluid-attenuated inversion recovery (FLAIR) image. Ten of the lesions enhanced. Hyperintense lesion load on T2-weighted images was 17.5 mL, and hypointense lesion load on contrast-enhanced T1-weighted images was 0.7 mL (T1:T2 ratio = 0.04). In Table 1, the numbers of enhancing lesions (total and new) and the numbers of new lesions seen on dual-echo images are reported. Only one of the 43 new lesions was located in an eloquent neurologic area (ie, the right median cerebellar peduncle; the longest axis of this lesion was shorter than 5 mm). FLAIR imaging did not reveal additional lesions compared with dual-echo rapid-acquisition relaxation-enhanced images. Of the 36 new enhancing lesions that could be followed from the beginning to the end of enhancement, 27 lesions enhanced on a single image (ie, enhancement duration was between 4 and 8 weeks) and nine on two consecutive images (ie, enhancement duration was longer than 8 weeks but shorter than 12). At the end of the follow-up period, hyperintense lesion load on T2-weighted images was 21.5 mL and hypointense lesion load on contrast-enhanced T1-weighted images was 1.1 mL (T1:T2 ratio = 0.05).
TABLE 1:
Numbers of enhancing and new lesions detected on dual-echo and post-contrast T1-weighted MR scans during the presymptomatic phase of a patient with CDMS

The average lesion MTR of the overall lesion population from the patient was 37.2% (Standard deviation [SD] = 2.7%). The mean percentage MTR reduction in new lesions compared with NAWM from the patient was 38.9% (SD = 14.7%). The MTR values from the NAWM areas of the patient were always within the mean MTR values ± 2 SD obtained from the same areas studied in the healthy control volunteers.
In Table 2, the mean brain MTR, histogram peak height, and peak location obtained using the six MT histograms from each time point of the follow-up period are reported. For reference, the mean and SD for these metrics obtained from the healthy control volunteers also are reported. Only the mean peak height of the patient's histogram was 2 SD below the mean peak height obtained from control volunteers (Fig 2).
TABLE 2:
Mean MT histogram-derived metrics from a patient with CDMS before the onset of clinical symptoms and from 10 healthy controls

fig 2.
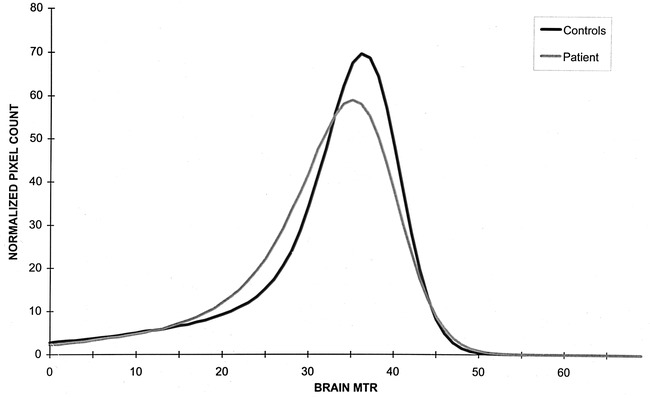
MT histograms of a patient with CDMS, obtained before the onset of clinical symptoms (gray line), and MT histograms of 10 healthy control volunteers (black line)
On the first spinal cord MR image, two lesions were seen on the dual-echo image, one located at C2–C3 and one at C7. These lesions were seen throughout the entire follow-up period; the lesion at C3 enhanced at 3 months (Fig 3). Another two lesions appeared at 3 months on dual-echo images; they were located at C4 and C6. Both of these lesions enhanced on the two consecutive images. On the last image, another enhancing lesion was seen at C1–C2. Thus, a total of four active lesions were seen in the cord; all were shorter than one spinal cord segment, did not occupy the entire cord, and did not cause cord swelling.
fig 3.
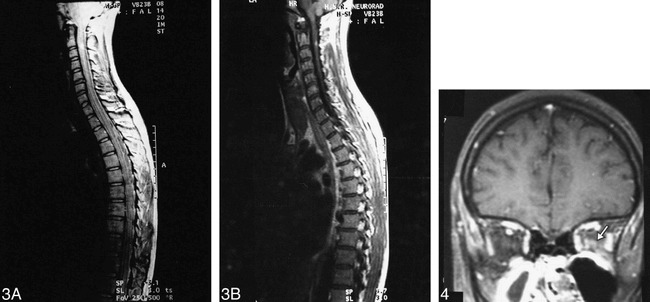
Coronal MR images of the spinal cord of a patient with CDMS, obtained before the onset of clinical symptoms. On the proton density–weighted image (A), a small lesion is visible in the posterior part of the cord at C2–C3. This lesion enhances on the contrast-enhanced T1-weighted image (B).fig 4. Coronal T1-weighted MR image of the brain of a patient, obtained at the time of an acute optic neuritis when a diagnosis of CDMS was made. Enhancement is visible (arrow) in the intraorbital portion of the left optic nerve
During this period, the results of the neurologic examinations performed before each imaging session by the same observer were always normal. The patient did not receive any drug during the study period, and did not report any neurologic symptoms. Blood and urine tests were repeated at the end of the follow-up period, and the results were normal. On this occasion, after a careful explanation of the MR results, the patient agreed to undergo a lumbar puncture and oligoclonal bands were found in her CSF.
Two months after the last MR image was obtained, the patient had an episode of hypesthesia in her left arm and leg. This lasted 1 week, and resolved spontaneously. The neurologic examination showed slight hyperreflexia in the left side. One month later, the patient developed an acute optic neuritis in her left eye. Visual acuity declined to finger counting only. The results of the fundoscopic examination were normal. The pupillary reflexes of the left eye were slowed, and a Marcus-Gunn phenomenon was observed. Visual field analysis showed a left central scotoma. Visual evoked response was significantly delayed with stimulation of the left eye. According to Poser's criteria (18), a diagnosis of clinically definite multiple sclerosis (CDMS) was made at that time. The patient was treated with an administration of methylprednisolone (1 g intravenously, daily for 5 days), and she experienced a complete recovery of her visual acuity in approximately 10 days.
During this exacerbation and before starting the steroid treatment, MR images were obtained with the same acquisition procedures used for the presymptomatic phase. Optic nerve MR images also were obtained ([short-tau inversion recovery: 3500/60/110; 157 × 251 field of view; 286 × 512 matrix]; [after the injection of 0.1 mmol/kg of contrast medium, T1-weighted with fat-suppression: 656/12; 157 × 251 field of view; 128 × 256 matrix]). For both sequences, coronal sections with a thickness of 3 mm and an intersection gap of 0.3 mm were acquired. In the brain, 31 new lesions (17 juxtacortical, nine discrete, three periventricular, and two infratentorial; six large, 17 intermediate, and eight small) were revealed by T2-weighted imaging. Twenty-seven of these lesions were enhanced on contrast-enhanced T1-weighted images. The hyperintense lesion load on T2-weighted images was 34.4 mL, and the hypointense lesion load on contrast-enhanced T1-weighted images was 0.8 mL (T1:T2 ratio = 0.02). The average lesion MTR was 35.0% (SD = 2.6%). The histogram average MTR of the brain was 36.7%. A small enhancing lesion also was detected in the intraorbital tract of the left optic nerve (Fig 4). No new lesions were found in the spinal cord. Nonetheless, the lesion previously detected at C4 was re-enhancing.
Discussion
Previous pathologic studies (1–5) showed that CNS abnormalities compatible with MS may appear in the absence of any previous, related symptoms. Similarly, MR studies (6–8) conducted of patients at presentation with clinically isolated syndromes suggestive of MS indicated that MR abnormalities may precede the clinical manifestation of the disease in approximately half of the patients. Our study describes the dynamics of the presymptomatic phase of MS in a patient who came to our attention for brain MR abnormalities suggestive of MS who then developed CDMS.
Although a definitive diagnosis could not be made for this patient before the appearance of clinical symptoms, MS was the most likely cause of the abnormalities seen on the MR images for four reasons. First, other possible causes were excluded carefully. Second, the appearance, size, and location of the lesions detected using MR imaging were those typically included in all the proposed MR diagnostic criteria for MS (19–21). Third, we demonstrated, using serial MR imaging, a dissemination of the lesions both in time and space, which are the accepted hallmarks for a clinical diagnosis of MS (18). Fourth, the spinal cord abnormalities detected in this patient were similar to those described in cases of established MS (22–24).
In this patient, disease activity before the development of clinical symptoms of MS was similar to that found in the early phases of relapsing-remitting MS (25, 26). Many new lesions formed during the follow-up period, and consistently enhanced at the time of their appearance. Duration of enhancement was also similar to that found in early relapsing-remitting MS (25–27). As a consequence of this activity, there was an increase of the disease burden, similar to that found in patients with MS, and a relatively low baseline lesion volume (28). In addition, as already described with early relapsing-remitting MS (24), disease activity was more pronounced in the brain than in the spinal cord.
Despite this, no clinical manifestations of the disease were seen for at least several months. Three factors may explain this discrepancy. First, during the presymptomatic phase, the vast majority of preexisting and new lesions in the brain were located in noneloquent neurologic areas. For lesions in the spinal cord, it is known that both at presentation with clinically isolated syndromes (29) and in early relapsing-remitting MS (24), spinal cord lesions may not result in neurologic deficits. Second, the absence of any MTR reduction in the NAWM of the brain suggested that the pathologic process was confined to visible T2-weighted images. On the contrary, diffuse, microscopic damage of the NAWM is a frequent finding in cases of established MS (30–33) and it has been shown to be relevant to the development of disability (31, 33). Finally, there is evidence that the intrinsic pathologic damage of the lesions seen in this patient was mild. Hypointense lesions on T1-weighted images and lesions with low MTR are those in which more severe tissue damage has occurred (34–37). Our patient's lesions were characterized by a higher average MTR, and the percentage decrease of MTR in newly formed lesions compared with NAWM was significantly higher than were those found in patients with relapsing-remitting MS (16). This suggests that the amount of tissue damage within the lesions of this patient was mild, thus increasing the likelihood for a better recovery. This agrees with the demonstration that the T1:T2 lesion volume ratio, at the beginning and at the end of the follow-up period, was much lower than that found in established MS (4–5% versus 10–30%) (38–40). Additionally, the demonstration that the patient's MT histogram had reduced peak height but normal average brain MTR and peak location, compared with those of the control volunteers, suggests the mildness of the changes in the diseased tissue and in the NAWM (17).
These observations are confirmed by the MR changes found at the time the patient developed CDMS. At this time, the patient developed new lesions in neurologically eloquent areas, and one of them was clearly responsible for the visual deficit. In addition, a generalized worsening of the overall disease burden was observed. Many active lesions were seen, and, as a consequence, T2-weighted lesion volume increased markedly. Marked decreases of the average lesion and brain MTR values also were found. This agrees with changes revealed by MR spectroscopy that occur in the brain tissue of patients with MS during the course of clinical relapses (41, 42). The significance of such changes is unclear, but the changes might be the result of diffuse increases of cytokines and other inflammatory mediators (43).
In conclusion, this study reports the characteristics of brain and spinal cord MR findings for a patient during the presymptomatic phase of CDMS. It suggests that the dynamics of this condition are similar to those of early relapsing-remitting MS, but the amount and severity of the destructive pathologic abnormalities is milder.
Acknowledgments
We thank Dr. Jack C. Sipe for helpful comments regarding the manuscript.
Footnotes
Address reprint requests to Massimo Filippi, MD, Neuroimaging Research Unit, Department of Neuroscience, Scientific Institute Ospedale San Raffaele, Via Olgettina, 60, 20132 Milan, Italy.
References
- 1.Georgi W. Multiple sklerose. Pathologisch-anatomische befund multiple sklerose bei klinisch diagnostizierten krankheiten. Wochenschrift 1961;91:605-607 [Google Scholar]
- 2.Mackay RP, Hirano A. Forms of benign multiple sclerosis. Report of two “clinically silent” cases discovered at autopsy. Arch Neurol 1967;17:588-600 [DOI] [PubMed] [Google Scholar]
- 3.Moriaru M, Klatzow WF. Subclinical multiple sclerosis. J Neurol 1976;213:71-76 [DOI] [PubMed] [Google Scholar]
- 4.Gilbert JJ, Sadler M. Unsuspected multiple sclerosis. Arch Neurol 1983;40:533-536 [DOI] [PubMed] [Google Scholar]
- 5.Engell T. A clinical patho-anatomical study of clinically silent multiple sclerosis. Acta Neurol Scand 1989;79:428-430 [DOI] [PubMed] [Google Scholar]
- 6.Morrissey SP, Miller DH, Kendall BE, et al. The significance of magnetic resonance imaging abnormalities at presentation with clinically isolated syndromes suggestive of MS. Brain 1993;116:135-146 [DOI] [PubMed] [Google Scholar]
- 7.Filippi M, Horsfield MA, Morrissey SP, et al. Quantitative brain MRI lesion load predicts the course of clinically isolated syndromes suggestive of multiple sclerosis. Neurology 1994;44:635-641 [DOI] [PubMed] [Google Scholar]
- 8.Miller DH, Albert PS, Barkhof F, et al. Guidelines for the use of magnetic resonance techniques in monitoring the treatment of multiple sclerosis. Ann Neurol 1996;39:6-16 [DOI] [PubMed] [Google Scholar]
- 9.Thompson AJ, Polman CH, Miller DH, et al. Primary progressive multiple sclerosis. Brain 1997;120:1085-1096 [DOI] [PubMed] [Google Scholar]
- 10.Rao SM, Cognitive Function Study Group NMSS. A manual for the brief repeatable battery of neuropsychological tests in multiple sclerosis.. New York: National Multiple Sclerosis Society; 1990
- 11.Miller DH, Barkhof F, Berry I, Kappos L, Scotti G, Thompson AJ. Magnetic resonance imaging in monitoring the treatment of multiple sclerosis. Concerted action guidelines. J Neurol Neurosurg Psychiatry 1991;54:683-688 [DOI] [PMC free article] [PubMed] [Google Scholar]
- 12.Filippi M, Yousry TA, Alkadhi H, Stehling M, Horsfield MA, Voltz R. Spinal cord MRI in multiple sclerosis with multicoil arrays. A comparison between fast spin echo and fast FLAIR. J Neurol Neurosurg Psychiatry 1996;61:632-635 [DOI] [PMC free article] [PubMed] [Google Scholar]
- 13.Yousry TA, Filippi M, Becker C, Horsfield MA, Voltz R. Comparison of MR pulse sequences in the detection of multiple sclerosis lesions. AJNR Am J Neuroradiol 1997;18:959-963 [PMC free article] [PubMed] [Google Scholar]
- 14.Rovaris M, Filippi M, Calori G, et al. Intra-observer reproducibility in measuring new putative MR markers of demyelination and axonal loss in multiple sclerosis. A comparison with conventional T2-weighted images. J Neurol 1997;244:266-270 [DOI] [PubMed] [Google Scholar]
- 15.Rovaris M, Filippi M, Falautano M, et al. Relationship between brain MR abnormalities and patterns of cognitive impairment in patients with multiple sclerosis. Neurology 1998;50:1601-1608 [DOI] [PubMed] [Google Scholar]
- 16.Filippi M, Rocca MA, Rizzo G, et al. Magnetization transfer ratios in MS lesions enhancing after different doses of gadolinium-DTPA. Neurology 1998;50:1289-1293 [DOI] [PubMed] [Google Scholar]
- 17.van Buchem MA, McGowan JC, Kolson DL, Polansky M, Grossman RI. Quantitative volumetric magnetization transfer analysis in multiple sclerosis. Estimation of macroscopic and microscopic disease burden. Magn Reson Med 1996;36:632-636 [DOI] [PubMed] [Google Scholar]
- 18.Poser CM, Paty DW, Scheinberg L, et al. New diagnostic criteria for multiple sclerosis. Guidelines for research protocols. Ann Neurol 1983;13:227-231 [DOI] [PubMed] [Google Scholar]
- 19.Paty DW, Oger JJF, Kastrukoff LF, et al. MRI in the diagnosis of MS. A perspective study with comparison of clinical evaluation, evoked potentials, oligoclonal banding, and CT. Neurology 1988;38:180-185 [DOI] [PubMed] [Google Scholar]
- 20.Fazekas F, Offenbacher H, Fuchs S, et al. Criteria for an increased specificity of MRI interpretation in elderly subjects with suspected multiple sclerosis. Neurology 1988;38:1822-1825 [DOI] [PubMed] [Google Scholar]
- 21.Barkhof F, Filippi M, Miller DH, et al. Comparison of MRI criteria at first presentation to predict conversion to clinically definite multiple sclerosis. Brain 1997;120:2059-2069 [DOI] [PubMed] [Google Scholar]
- 22.Campi A, Filippi M, Comi G, et al. Acute transverse myelopathy. Spinal and cranial MR study with clinical follow-up. AJNR Am J Neuroradiol 1995;16:115-123 [PMC free article] [PubMed] [Google Scholar]
- 23.Tartaglino LM, Friedman DP, Flanders AE, Lublin FD, Knobler RL, Liem M. Multiple sclerosis in the spinal cord. MR appearance and correlations with clinical parameters. Radiology 1995;195:725-732 [DOI] [PubMed] [Google Scholar]
- 24.Thorpe JW, Kidd D, Moseley IF, et al. Serial gadolinium-enhanced MRI of the brain and spinal cord in early relapsing-remitting multiple sclerosis. Neurology 1996;46:373-378 [DOI] [PubMed] [Google Scholar]
- 25.Miller DH. Magnetic resonance in monitoring the treatment of multiple sclerosis. Ann Neurol 1994;36:S91-S94 [DOI] [PubMed] [Google Scholar]
- 26.Filippi M, Rossi P, Campi A, Colombo B, Pereira C, Comi G. Serial contrast-enhanced MR in patients with multiple sclerosis and varying levels of disability. AJNR Am J Neuroradiol 1997;18:1549-1556 [PMC free article] [PubMed] [Google Scholar]
- 27.McDonald WI, Miller DH, Barnes D. The pathological evolution of multiple sclerosis. Neuropathol Appl Neurobiol 1992;18:319-334 [DOI] [PubMed] [Google Scholar]
- 28.Filippi M, Sormani MP, Rovaris M, Comi G. How does brain MRI lesion volume change in patients with multiple sclerosis? Magn Reson Imaging 1998;16:1181-1183 [DOI] [PubMed] [Google Scholar]
- 29.O'Riordan JI, Losseff NA, Phatouros C, et al. Asymptomatic spinal cord lesions in clinically isolated optic nerve, brain stem, and spinal cord syndromes suggestive of demyelination. J Neurol Neurosurg Psychiatry 1998;64:353-357 [DOI] [PMC free article] [PubMed] [Google Scholar]
- 30.Barbosa S, Blumhardt LD, Roberts N, Lock T, Edwards RH. Magnetic resonance relaxation time mapping in multiple sclerosis. Normal appearing white matter and the “invisible” lesion load. Magn Reson Imaging 1994;12:33-42 [DOI] [PubMed] [Google Scholar]
- 31.Filippi M, Campi A, Dousset V, et al. A magnetization transfer imaging study of normal-appearing white matter in multiple sclerosis. Neurology 1995;45:478-482 [DOI] [PubMed] [Google Scholar]
- 32.Loevner LA, Grossman RI, Cohen JA, Lexa FJ, Kessler D, Kolson DL. Microscopic disease in normal-appearing white matter on conventional MR images in patients with multiple sclerosis. Assessment with magnetization-transfer measurements. Radiology 1995;96:511-515 [DOI] [PubMed] [Google Scholar]
- 33.Fu L, Matthews PM, De Stefano N, et al. Imaging of axonal damage of normal appearing white matter in multiple sclerosis. Brain 1998;121:103-113 [DOI] [PubMed] [Google Scholar]
- 34.van Walderveen MAA, Kamphorst W, Scheltens P, et al. Histopathologic correlate of hypointense lesions on T1-weighted spin-echo MRI in multiple sclerosis. Neurology 1998;50:1282-1288 [DOI] [PubMed] [Google Scholar]
- 35.Bruck W, Bitsch A, Kolenda H, et al. Inflammatory central nervous system demyelination. Correlation of magnetic resonance imaging findings with lesion pathology. Ann Neurol 1997;42:783-793 [DOI] [PubMed] [Google Scholar]
- 36.Grossman RI. Magnetization transfer in multiple sclerosis. Ann Neurol 1994;36:S97-S99 [DOI] [PubMed] [Google Scholar]
- 37.van Waesberghe JHTM, van Walderveen MAA, de Groot C, David R, Lycklama à Nijeholt GJ. Postmortem correlation between axonal loss, MTR, and hypointensity on T1 SE in MS. Proceedings of the International Society for Magnetic Resonance in Medicine 1998;2:1334 [Google Scholar]
- 38.van Walderveen MAA, Barkhof F, Hommes OR, Brück Y, Stiefel M, Lassmann H. Correlating MRI and clinical disease activity in multiple sclerosis. Relevance of hypointense lesions on short TR/short TE (T1-weighted) spin-echo images. Neurology 1995;45:1684-1690 [DOI] [PubMed] [Google Scholar]
- 39.Truyen L, van Waesberghe JHTM, van Walderveen MAA, et al. Accumulation of hypointense lesions (“black holes”) on T1 spin-echo MRI correlates with disease progression in multiple sclerosis. Neurology 1996;47:1469-1476 [DOI] [PubMed] [Google Scholar]
- 40.Filippi M, Rocca MA, Horsfield MA, et al. Increased spatial resolution using a three-dimensional T1-weighted gradient-echo MR sequence results in greater hypointense lesion volumes in multiple sclerosis. AJNR Am J Neuroradiol 1998;19:235-238 [PMC free article] [PubMed] [Google Scholar]
- 41.De Stefano N, Matthews PM, Narayanan S, Francis GS, Antel JP, Arnold DL. Axonal dysfunction and disability in a relapse of multiple sclerosis. Longitudinal study of a patient. Neurology 1997;49:1138-1141 [DOI] [PubMed] [Google Scholar]
- 42.De Stefano N, Matthews PM, Fu L, et al. Axonal change correlates with disability in patients with relapsing-remitting multiple sclerosis. Results of a longitudinal magnetic resonance spectroscopy study. Brain 1998;121:1469-1477 [DOI] [PubMed] [Google Scholar]
- 43.Moreau T, Coles A, Wing M, et al. Transient increase in symptoms associated with cytokine release in patients with multiple sclerosis. Brain 1996;119:457-463 [DOI] [PubMed] [Google Scholar]