Abstract
BACKGROUND AND PURPOSE: Fluid-attenuated inversion-recovery (FLAIR) MR imaging is widely accepted for brain diagnoses, though to our knowledge no description of the MR FLAIR appearance of the normal infantile brain has been published. The purpose of this study was to investigate the appearance of normal infantile brain maturation on FLAIR MR images.
METHODS: FLAIR images were obtained in 52 children between the ages of 1 day and 4 years who had clinically suspected brain disease but no neurologic abnormality or growth retardation. T1- and T2-weighted images were also obtained in all the children, and these images were compared with the FLAIR sequences for the appearance of brain maturation. A grading system for the differences in signal intensity between gray and white matter on FLAIR images was introduced to make detailed profiles of maturation in each brain region, including the posterior limb of the internal capsule, the cerebellar peduncle, the frontal deep white matter, the occipital deep white matter, and the centrum semiovale. These grades were plotted against patients' ages.
RESULTS: On the FLAIR images, the myelinated white matter, including the cerebellar peduncle and the posterior limb of the internal capsule, showed high signal intensity relative to gray matter at birth. Thereafter, the white matter lost signal intensity with time and showed low signal intensity at 50 weeks and beyond. The unmyelinated white matter, including the frontal deep white matter, the occipital deep white matter, and the centrum semiovale, showed low signal intensity at birth. The white matter showed high signal intensity at 20 to 30 weeks, and low signal intensity again at 100 to 160 weeks and after.
CONCLUSION: The dynamics of brain myelination can be accurately delineated and evaluated on FLAIR images without other spin-echo (SE) sequences. The FLAIR appearance of infantile white matter can be divided into two phases, reflecting development of the myelination process: the first phase is similar to that seen on SE T1-weighted images and the second phase is similar to that seen on SE T2-weighted images.
Fluid-attenuated inversion recovery (FLAIR) is an inversion-recovery pulse sequence designed to nullify or greatly reduce the signal from CSF. It provides heavily T2-weighted images without a very high signal or potential artifacts from CSF (1–6).
Clinical applications of the FLAIR technique have been described (3–6), and its clinical utility has been widely accepted, especially for brain diagnoses. No description of the MR FLAIR appearance of the normal infantile brain has been published, to our knowledge. In the present study, we examined a series of normal infantile brains with MR FLAIR sequences and used the findings to obtain a profile of normal brain maturation.
Methods
Fifty-two patients, 29 boys and 23 girls, ranging in age from 1 day to 4 years, were examined. Their ages were corrected if they were not born at full term, and the corrected ages were used in the study (age distribution is shown graphically in Fig 1). All the patients were clinically suspected to have brain disease, but without any neurologic abnormality. The final diagnosis (normal in all cases) was made on the basis of MR findings and clinical follow-up over a period of 3 months.
fig 1.
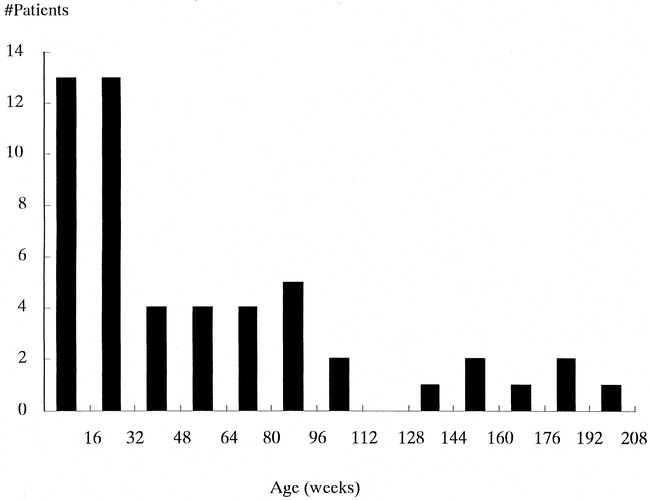
Age distribution of patients in study group, comprising 52 children ranging in age from 1 week to 4 years
Of the 52 patients, 22 were imaged with a 0.5-T MR unit, and for the remaining 30 patients, a 1.5-T MR unit was used. All 52 patients were examined with FLAIR sequences and with spin-echo (SE) T2- and T1-weighted MR sequences.
On the 0.5-T MR unit, parameters for the FLAIR technique were 4000/100/2 (TR/TE/excitations), an inversion time (TI) of 1500, a 192 × 128 matrix with a 20-cm field of view, and 8-mm-thick sections with a 2-mm intersection gap. T1- and T2-weighted images were obtained with parameters of 500/25/3 and 2000/90/2, respectively.
On the 1.5-T MR unit, the parameters for the FLAIR images obtained with a fast SE version of the original FLAIR sequence were 8000/120/1, a TI of 2000, a 192 × 256 matrix with a 20-cm field of view, and 6-mm-thick sections with a 1-mm intersection gap. T1- and T2-weighted images were obtained with parameters of 500/15/2 and 4000/120/2, respectively. The T2-weighted images were also acquired with the use of a fast SE technique.
Comparisons between gray and white matter signal intensity on FLAIR images were made and scored by consensus of two observers on a scale of −1 to +1 for each patient. The following white matter areas were selected as regions of interest: the posterior limb of the internal capsule, the cerebellar peduncle, the frontal deep white matter, the occipital deep white matter, and the centrum semiovale. The signal intensities of these regions were compared visually with those of gray matter. A grade of +1 was given when the signal of the gray matter was brighter than that of white matter. The reverse intensity pattern was defined as a grade of −1. Grade 0 indicated that there was no difference in signal intensity between the gray and white matter on FLAIR images. Using the data set of each patient, we plotted the grades according to age, and smoothed curves were reconstructed from the data for each brain region (Fig 2).
fig 2.
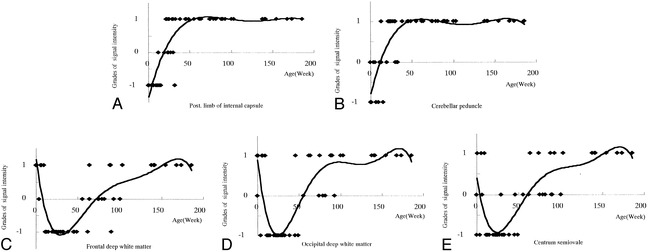
A–E, Grades of signal intensity on FLAIR images plotted against the patient's age for individual anatomic sites: posterior limb of internal capsule (A), cerebellar peduncle (B), frontal deep white matter (C), occipital deep white matter (D), and centrum semiovale (E). Diamonds represent the grade of each patient
To investigate the cause of signal changes with brain maturation, we calculated the proton-density, T1, and T2 values in the regions of the posterior limb of the internal capsule, the cerebellar peduncle, and the corona radiata in three patients (Table). The method for arriving at these calculations was described in detail by Araki et al (7). Briefly, the signal intensity on SE images is expressed by the following equation:
 |
where K is the nondimensional coefficient of the equation, f(v) is the function of flow component, and D is the proton density. To solve this equation and derive T1, T2, and proton-density values, the three imaging sequences (T1-, T2-, and proton density–weighted sequences) were obtained. The T1- and proton density–weighted sequences had the same TE. The T2- and proton density–weighted sequences had the same TR. The three equations allowed us to obtain T1, T2, and proton-density values. The regions of interest were 3 mm in diameter (about 15 pixels).
T1, T2, and proton-density values of the internal capsule, middle cerebellar peduncle, and corona radiata on 0.5-T MR images

Results
We observed two patterns of myelination curves for brain development. The first pattern was seen in the patterns of the posterior limb of the internal capsule and cerebellar peduncle, where the curve showed an upslope to the right monophasically during the first 50 weeks, then reached a plateau (Fig 2). The second pattern was seen in the frontal deep white matter, the centrum semiovale, and the occipital deep white matter, with a biphasic curve (Fig 2). The curve showed a downslope during the first 30 weeks, then rose gradually. The curve in the region of the occipital deep white matter was the first to reach grade +1, at 100 weeks of age, while the curves in the region of the frontal deep white matter and the centrum semiovale reached grade +1 at 150 weeks of age (Fig 2). On the FLAIR images, the myelinated portions of the brain appeared as high signal intensity at birth, whereas unmyelinated portions were seen as low signal intensity (Fig 3). The signal intensity of the myelinated regions declined with brain maturation (Fig 4) and acquired the same values as those of adults by age 2 years (Fig 5).
fig 3.
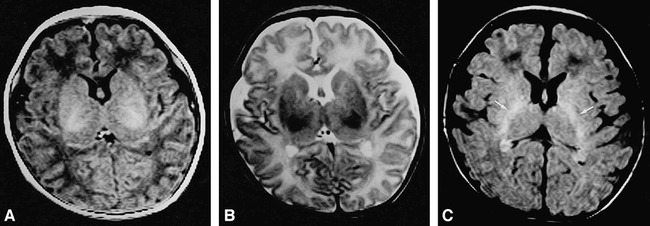
Brain MR images at the level of the internal capsule of a 1-week-old infant.
A, T1-weighted (500/15/2) image shows high signal intensity in the posterior limb of the internal capsule.
B, T2-weighted (4000/120/2) SE image shows low signal intensity in the posterior limb of the internal capsule.
C, FLAIR (8000/120/1, TI = 2000) image shows high signal intensity in the posterior limb of the internal capsule (arrows). The signal intensity of the gray and white matter is similar to that on T1-weighted images.
fig 4.
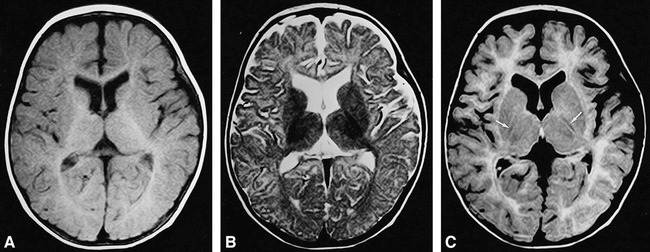
Brain MR images of a 30-week-old infant.
A, T1-weighted (500/15/2) image shows high signal intensity in the posterior limb of the internal capsule. The occipital white matter shows high intensity, suggesting myelination.
B, T2-weighted (4000/120/2) SE image shows low signal intensity of the posterior limb of the internal capsule.
C, FLAIR (8000/120/1, TI = 2000) image shows decreased signal intensity the posterior limb of the internal capsule (arrows). The occipital white matter shows increased signal intensity.
fig 5.
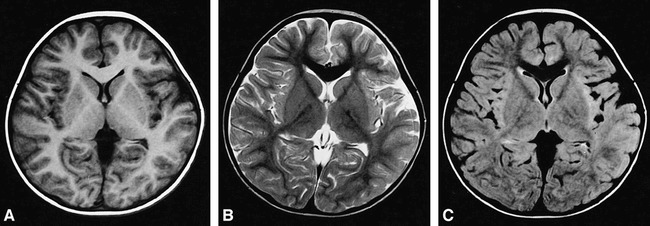
Brain MR images of a 34-month-old child.
A and B, T1-weighted (500/15/2) (A) and T2-weighted (4000/120/2) (B) SE images show the brain already has an adult pattern of signal intensity.
C, On this FLAIR (8000/120/1, TI = 2000) image, the myelinated areas show low signal intensity with time and become similar to that on the SE T2-weighted image.
The grade of signal intensity and the calculated values of T1, T2, and proton density for three patients are listed in Table 1. In the 21-week-old infant, the areas of high signal intensity on the FLAIR images, such as the corona radiata, had greater T1 and T2 values as compared with such low signal intensity areas as the cerebellar peduncle and posterior limb of the internal capsule. However, there was no difference among these areas on proton density–weighted sequences. In the 30-week-old infant, the FLAIR appearances were similar to those of the 21-week-old patients, but the three regions had approximately the same T1, T2, and proton-density values. In contrast, in the 64-week-old infant, the posterior limb of the internal capsule, the cerebellar peduncle, and the corona radiata showed low signal intensity on FLAIR images, and had approximately the same T1, T2, and proton-density values.
Discussion
Myelination is a dynamic process in the developing infant brain, and for this reason is an excellent marker of brain maturation. MR imaging has for the first time provided a method for imaging the evolution of myelination in vivo (8–10).
Brain myelination usually occurs in highly predictable and very orderly patterns. In general, myelination progresses from the caudad to the cephalad and from the dorsal to the ventral parts of the brain (8, 9). The myelination process continues during the first decade of life, and is said to be complete by the second decade (8, 9). The time-course signal changes were found to be in complete correspondence with the development and process of myelination (8, 9).
On T1-weighted images, unmyelinated white matter is of low signal intensity, and it becomes hyperintense with myelin development. On T2-weighted images, unmyelinated white matter appears hyperintense, followed by a decrease of signal intensity with myelin maturation (8–10). On FLAIR images, myelinated white matter, including the dorsal aspect of the pons, the cerebellar peduncle, and the posterior limb of the internal capsule, shows high signal intensity relative to gray matter at birth. Thereafter, the white matter loses signal intensity with time, and the FLAIR appearance of the brain becomes similar to an adult pattern by the age of 2 years (Fig 2). Unmyelinated white matter is of low signal intensity on FLAIR images. The FLAIR images of the unmyelinated white matter at birth showed a complicated biphasic pattern, unlike the T1- and T2-weighted images, which showed monophasic patterns. The process of brain maturation thus can be shown more precisely by FLAIR images than by T1- or T2-weighted images. In fact, the maturation process that proceeds from posterior to anterior was well confirmed by the maturation curves obtained from the FLAIR images (Fig 2).
Myelin maturation can be consistently detected earlier on T1- than on T2-weighted images. Barkovich et al (8, 9) ascertained that T1-weighted images are most useful in monitoring myelin development in the first 6 to 8 months of life, whereas T2-weighted images are more useful after 6 months. However, the present findings clearly demonstrate that myelination in the entire period from birth to its completion can be evaluated by FLAIR images alone, without the aid of SE T1- or T2-weighted imaging. With the current SE sequences, myelinated white matter at birth shows high signal intensity on T1-weighted images and low signal intensity on T2-weighted images. These SE signal intensities remain unchanged throughout the human life span. Unlike SE images, FLAIR images depict the signal changes of the myelinated white matter according to brain maturation, from high to low signal intensity (Fig 5). We think that it is possible to divide MR FLAIR appearances of myelinated white matter into an early stage, characterized by high signal intensity, and a late stage, typified by low signal intensity. Our observations indicate that FLAIR imaging is useful for making a detailed evaluation of myelination dynamics.
FLAIR is essentially a T2-weighted technique, although the signal intensity on FLAIR images is at least partially T1-dependent (5). The signal intensity on FLAIR images is calculated according to the following formula (11):
 |
This equation of signal intensity of the inversion recovery technique indicates that all values of T1 and T2 relaxation times and proton density influence the signal intensity of FLAIR images. Holland et al (12) reported the measurements of T1 and T2 relaxation times of white matter in children ranging from neonates to 16-year-olds. Substituting the T1 and T2 values obtained by these authors with the equation above produces a biphasic pattern of the curves of white matter signal intensity. The graph shows an upslope from 6 months of age. This biphasic pattern quite resembles the biphasic pattern of our signal intensity curves in the frontal deep white matter.
T1 and T2 values in white matter decrease as the brain matures (12), a finding that was also obtained in the present study (Table 1). The T1 and T2 values in the white matter of the infants were relatively high compared with those of the older children. Thus, when T1 and T2 values are high, the values of exp(−TE/T2) and 2exp(−TI/T1) are low. The signal intensity on FLAIR images of an infant therefore depends mainly on the third term of Equation 2: {1−2exp(−TI/T1)+exp(−TR/T1)}. Thereafter, when the value of the term reaches 1, the signal intensity is influenced mainly by the second term of the equation: exp(−TE/T2). The signal intensity of white matter on FLAIR images is thus influenced by T1 values at first, and subsequently influenced by T2 values. We suspect that the signal intensity of gray and white matter on FLAIR images is approximately the same as that on SE T1-weighted images and subsequently similar to that on SE T2-weighted images.
In addition, on FLAIR images, high signal intensity arises from a short T1 value, a long T2 value, and a high proton-density value (7). In three patients, ages 21 to 64 weeks, we measured the T1, T2, and proton-density values of the corona radiata, the cerebellar peduncle, and the posterior limb of the internal capsule (Table 1). The T2 values of the corona radiata were 62.8, 54.9, and 51.3 for the 21-, 30-, 64-week-old children, respectively. The signal intensity of the corona radiata was decreased. Our findings suggest that the change from high to low signal intensity in myelinated areas on FLAIR images depends on the shortening of T2 values in the brain parenchyma.
Barkovich et al (8, 9) found that the changes on the T1-weighted images correspond to the accumulation of cholesterol and glycolipids, the building blocks of myelination, in the hemispheric white matter. The changes on the T2-weighted images correspond temporally with formation of the complete myelin sheath and probably reflect changes in water distribution from an intact myelin sheath. The present findings thus suggest that the FLAIR appearance of infantile white matter reflects the changes on both T1- and T2-weighted images.
Conclusion
Our study establishes that the FLAIR appearance of brain maturation can be divided into two stages: the early stage, when signal intensity of gray and white matter is approximately similar to that on SE T1-weighted images, and the late stage, when the appearance of the brain is similar to that on SE T2-weighted images. The dynamics of brain myelination can be accurately delineated and evaluated by FLAIR images without using other SE sequences.
Footnotes
Address reprint requests to Ryuichiro Ashikaga, MD.
References
- 1.Hajnal JV, Bryant DJ, Kasuboski L, et al. Use of fluid attenuated inversion recovery (FLAIR) pulse sequences in MRI of the brain. J Comput Assist Tomogr 1992;16:841-844 [DOI] [PubMed] [Google Scholar]
- 2.White SJ, Hajnal JV, Young IR, Bydder GM. Use of fluid-attenuated inversion-recovery pulse sequences for imaging of the spinal cord. Magn Reson Med 1992;28:153-162 [DOI] [PubMed] [Google Scholar]
- 3.De Coene B, Hajnal JV, Gatehouse P, et al. MR of the brain using fluid-attenuated inversion recovery (FLAIR) pulse sequences. AJNR Am J Neuroradiol 1992;13:1555-1564 [PMC free article] [PubMed] [Google Scholar]
- 4.Noguchi K, Ogawa T, Inugami A, Toyoshima H, Okudera T, Uemura K. MR of acute subarachnoid hemorrhage: a preliminary report of fluid-attenuated inversion-recovery pulse sequences. AJNR Am J Neuroradiol 1994;15:1940-1943 [PMC free article] [PubMed] [Google Scholar]
- 5.Tsuchiya K, Mizutani Y, Hachiya J. Preliminary evaluation of fluid-attenuated inversion-recovery MR in the diagnosis of intracranial tumors. AJNR Am J Neuroradiol 1996;17:1081-1086 [PMC free article] [PubMed] [Google Scholar]
- 6.Ashikaga R, Araki Y, Ishida O. MRI of head injury using FLAIR. Neuroradiology 1997;39:239-242 [DOI] [PubMed] [Google Scholar]
- 7.Araki Y, Ashikaga R, Takahashi S, Ueda J, Ishida O. High signal intensity of the infundibular stalk on fluid-attenuated inversion recovery MR. AJNR Am J Neuroradiol 1997;18:89-93 [PMC free article] [PubMed] [Google Scholar]
- 8.Barkovich AJ, Kjos BO, Jackson DE, Norman D. Normal maturation of the neonatal and infant brain: MR imaging at 1.5T. Radiology 1988;166:173-180 [DOI] [PubMed] [Google Scholar]
- 9.Barkovich AJ. Pediatric Neuroimaging New York: Raven; 1990;5-34
- 10.Bird CR, Hedberg M, Drayer BP, Keller PJ, Flom RA, Hodak JA. MR assessment of myelination in infants and children: usefulness of marker sites. AJNR Am J Neuroradiol 1989;10:731-740 [PMC free article] [PubMed] [Google Scholar]
- 11.Fleckenstein JL, Archer BT, Barker BA, Vaughan JT, Parkey RW, Peshock RM. Fast short-tau inversion-recovery MR imaging. Radiology 1991;179:499-504 [DOI] [PubMed] [Google Scholar]
- 12.Holland BA, Haas DK, Norman D, Brant-Zawadzki M, Newton TH. MRI of normal brain maturation. AJNR Am J Neuroradiol 1986;7:201-208 [PMC free article] [PubMed] [Google Scholar]


