

Abstract
BACKGROUND AND PURPOSE: Our purpose was to document the nature and progression of brain abnormalities in Salla disease, a lysosomal storage disorder, with MR imaging.
METHODS: Fifteen patients aged 1 month to 43 years underwent 26 brain MR examinations. In 10 examinations, signal intensity was measured and compared with that of healthy volunteers of comparable ages.
RESULTS: MR images of a 1-month-old asymptomatic child showed no pathology. In all other patients, abnormal signal intensity was found: on T2-weighted images, the cerebral white matter had a higher signal intensity than the gray matter, except in the internal capsules. In six patients, the white matter was homogeneous on all images. In four patients, the periventricular white matter showed a somewhat lower signal intensity; in five patients, a higher signal intensity. In the peripheral cerebral white matter, the measured signal intensity remained at a high level throughout life. No abnormalities were seen in the cerebellar white matter. Atrophic changes, if present, were relatively mild but were found even in the cerebellum and brain stem. The corpus callosum was always thin.
CONCLUSION: In Salla disease, the cerebral myelination process is defective. In some patients, a centrifugally progressive destructive process is also seen in the cerebral white matter. Better myelination in seen in patients with milder clinical symptoms.
Salla disease, first diagnosed in 1979 (1), is a recessively inherited lysosomal storage disease caused by an error in sialic acid metabolism. Free sialic acid accumulates in the lysosomes of various tissues because of a defect in the mechanism of transport across the lysosomal membrane (2, 3). Recently, the gene locus has been found in the long arm of chromosome 6 (4).
In patients with Salla disease, intrauterine growth is normal. The first signs of neurologic abnormality, usually visible at 3 to 6 months of age, are hypotonia, ataxia, often nystagmus, and always retarded motor development. The main feature is severe psychomotor retardation, but there is wide phenotypic variation. Developmental delay progresses slowly, and deterioration becomes more pronounced during the second or third decade. Life expectancy is only slightly decreased. In most patients, the disease is of the conventional type: they learn to walk and speak words or short sentences. A minority, about one patient in four (5), are severely affected, never being able to walk independently because of early-onset progressive spasticity and severe ataxia. In the present article, this phenotype is referred to as the clinically severe type. About 20% of the patients have epilepsy. Diagnosis is based on the typical clinical onset, increased urinary excretion of sialic acid, and enlarged lysosomes in a skin biopsy specimen.
In a few patients with Salla disease, MR findings in the brain may be interpreted as arising from defective myelination (5, 6). We describe the findings in a more extensive series of patients of varying ages, most of them examined repeatedly. Our aim was to document the nature and progression of brain involvement.
Methods
Patients
Our study group comprised 15 patients with Salla disease (eight males and seven females), ranging in age from 1 month to 43 years (Table 1), who were seen at four university hospitals. Fourteen patients, the youngest of them 5 months old, had a confirmed diagnosis at the time of entry into the study. One patient, 1 month old, had no symptoms at study entry, but was a sibling of another patient; clinical disease developed during the follow-up period.
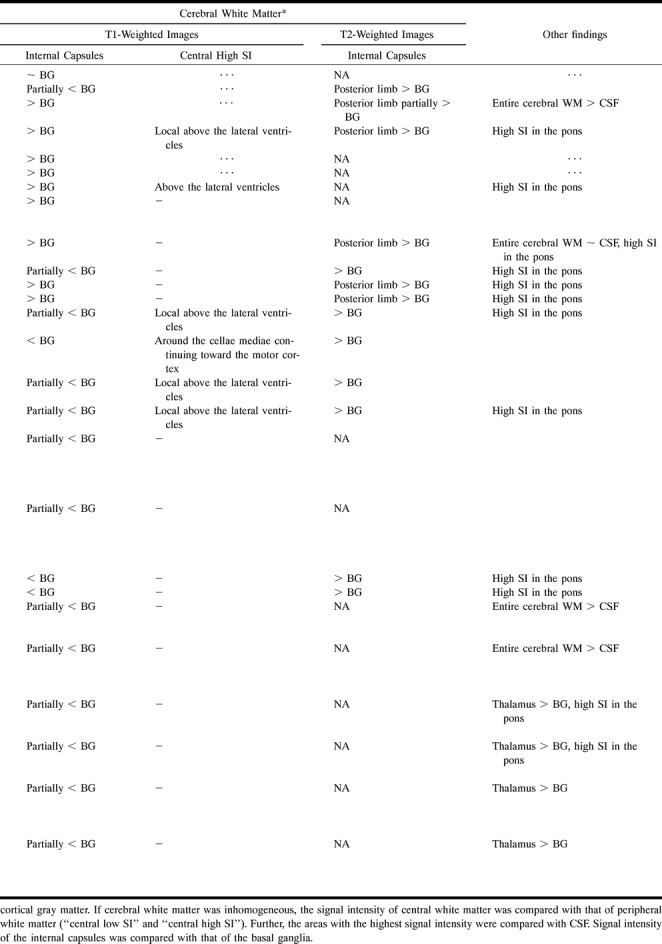
TABLE 1:
Summary of main MR findings in 15 patients with Salla disease

In all patients, the diagnosis was confirmed by the findings of free sialic acid in the urine and enlarged lysosomes in skin biopsy specimens, and by DNA linkage analysis.
Thirteen of the 15 patients (all but cases 2 and 7) were reexamined by the pediatric neurologist of our group for clinical grading of the disease. However, the phenotypes are very difficult to distinguish during the first years of life. All the patients were mentally retarded, with clinical symptoms of varying severity. Patient 1 was neurologically normal at the first MR examination when she was 1 month old but displayed the first symptom, transient nystagmus, at the age of 3 months. The patients were graded as having severe, conventional, or mild disease. Three patients (cases 11, 13, and 14) had the severe type with marked spasticity, epilepsy, and profound mental retardation (IQ < 20). Eight patients (cases 1, 3–6, 9, 10, and 15) had the conventional type (see Introduction for symptoms). Two patients (cases 8 and 12) had the mild type. Their IQs were 45. They had learned to walk independently during the third year of life and were able to speak better than the others.
Control Group
In two of the hospitals, healthy volunteers had been examined using the same MR equipment and the same imaging parameters as for the patients. In total, there were 19 healthy control subjects for 10 patients of comparable age. The ages of the control subjects ranged from 27 months to 40 years. These volunteers, who were all healthy at the time of the examination, or their parents were interviewed carefully by the authors before imaging. The subjects had not had any neurologic symptoms or any diseases that might have affected the brain. All the volunteers were examined after informed consent was obtained; children and adolescents were examined with the consent of their parents. The study was approved by the local ethics committees.
MR Examinations
The examinations had been performed at four hospitals with imagers operating at 0.5 T, 1.0 T, or 1.5 T. These differences caused some variation in the imaging technique. For every patient, axial T2-weighted and sagittal T1-weighted spin-echo images were available. In some cases, axial T1-weighted and coronal T1- or T2-weighted images were also obtained.
We performed follow-up examinations in 11 of 15 patients. The follow-up period ranged from 11 months to 5 years.
Visual Image Analysis
All examinations were reevaluated by three of us without knowledge of the clinical data. There was no interobserver disagreement about the signal intensity properties. The observers disagreed on atrophy classification in two parameters in two patients. In these cases, consensus between two of the analyzers was taken as a final result.
Atrophy, as in earlier studies (9), was graded by comparing the images with standard sets of images representing various sizes of each ventricle and of the sulci (estimated for each lobe) and cisterns. The standard images showed the upper limits of atrophy for each class as follows: no atrophy, +, ++, +++.
Signal intensity was analyzed visually by comparing certain anatomic structures or areas. The signal intensity of the white matter was related to that of the cortical gray matter in both the cerebrum and cerebellum. If the white matter was not homogeneous, the peripheral white matter was used as a reference and the locations of the low- or high-intensity areas were recorded. On T2-weighted images, the signal intensity of each high-signal region was compared with that of CSF. CSF was used as a reference because no CSF abnormalities have been found in Salla disease. The signal intensity of the internal capsule was compared with that of the basal ganglia on both T1- and T2-weighted images. We used the same evaluation criteria at all ages. In suitable cases, the findings were afterward related to normal brain maturation milestones (7).
Measurements
In 13 examinations of nine patients (aged 1 to 43 years) the brain stem diameters were measured on a screen and compared with the normal values (8). In four patients, the data were not saved on a diskette or the diskette could not be read. In two patients, the position of the sections was not optimal for measurements.
Signal intensity was measured in 10 patients and in 19 control subjects, using a method described and discussed in detail elsewhere (9). Signal intensity was measured on T2-weighted images, using the imager's display console. The CSF in the tips of the frontal horns, where the flow effect is minimal, was used as a signal intensity reference. The measurements were performed in the sections traversing the frontal horns. Signal intensity was measured bilaterally in the white matter at many sites near the cortex and in the caudate nucleus, putamen, and thalamus. The mean value for each structure was used in calculating the signal intensity ratios. The final quantitation was done by calculating the ratio between each structure and the CSF. All ratios were calculated from signal intensity values measured on the same section.
Results
Findings in Visual Signal Intensity Analysis
On T2-weighted images, the peripheral cerebral white matter had a higher signal intensity than the cortex or the deep gray matter in all patients. Naturally, this condition was physiological in the youngest patients. Myelination of the internal capsules, if any, was poor during the first year of life. Later, myelin was detected in the internal capsules on T1-weighted images (Fig 1C). On T2-weighted images, the myelination of the internal capsules was seen to be defective (Fig 2) in all but two patients (cases 8 and 12), in whom the signal intensity was lower than that of the basal ganglia and thalami.
fig 1.

Case 8: 7-year-old boy with clinically mild type of Salla disease.
A–C, At the age of 27 months the corpus callosum is very thin. T2-weighted (2500/90) spin-echo MR images show high signal intensity in the cerebral white matter (A) and somewhat high signal intensity in the internal capsules (B) as a sign of hypomyelination. Myelin was better seen in the internal capsules on T1-weighted image (C).
D and E, At the age of 7 years, T2-weighted images show myelination of the internal capsules had progressed (D), and myelin was also seen above the atria (E).
fig 2.

Case 6: 6-year-old girl with conventional type of Salla disease. MR image shows homogeneous high signal intensity in the cerebral white matter, including the internal capsules.
fig 3. Case 11: 15-year-old boy with clinically severe type of Salla disease. MR image shows extremely high signal intensity around the lateral ventricles and moderate atrophic changes.
fig 4. Case 13: 20-year-old man with clinically severe type of Salla disease. MR image shows very high signal intensity in the entire cerebral white matter.
The cerebral white matter was homogeneous in at least one examination in seven patients (cases 1, 2, 3, 5, 6, 7, and 13). The patients examined at the ages of 5 to 21 months (cases 2, 3, 5, 6, the second examination of patient 1, and the first examination of patient 7) did not show the normal decrease in periventricular signal intensity on T2-weighted images. No signal increase was seen under the motor cortex on their T1-weighted images. These findings were interpreted as due to lack of myelination. In six of 15 patients, the white matter was homogeneous on the latest examination at the ages of 8 months, 9 months, 12 months, 5 years, 6 years, and 20 years (cases 3, 5, 1, 2, 6, and 13, respectively) (Fig 2). Their myelination stage was typical for age at 5 months or less (7). Patient 13 deviated from the others in that he had extremely high white matter signal intensity, higher than that of CSF, on both examinations.
Two patients (cases 8 and 12) had lower signal intensity periventricularly (Fig 1E) above the cellae mediae, but not around the frontal horns, on T2-weighted images. This finding was interpreted as a sign of some myelination. One of these patients (case 8), examined at 2 and 7 years of age, showed some progression of myelination (Fig 1B–E) on both T2- and T1-weighted images, while in the other (case 12) the appearance was identical at 13 and 15 years of age. The latter patient had homogeneous cerebral white matter on T1-weighted images. In the third patient (case 9), the finding was uncertain on T2-weighted images, but a high signal intensity, consistent with myelin, was detected on T1-weighted images above the atria. The myelination stage of this 30-month-old child corresponded to that seen at about 6 months in healthy children (7). The oldest patient (case 15) had a very thin layer with a lower signal intensity around the lateral ventricles. This pattern did not correspond to the normal myelination process.
Five patients (cases 4, 7, 10, 11, and 14) showed a somewhat higher signal intensity around the lateral ventricles on T2-weighted images (Fig 3). In two of the patients, the increase in signal intensity developed (case 7) or progressed (case 14) during follow-up. In the patients who were 10 and 24 years old (cases 11 and 14), the periventricular white matter showed signal intensity as high as that of CSF. One other patient (case 13) had equally high signal intensity throughout the cerebral white matter (Fig 4). On T1-weighted images, two patients (cases 4 and 10) had increased signal intensity locally above the lateral ventricles; the others had homogeneous cerebral white matter.
On the T2-weighted images of all patients the basal ganglia and thalami appeared darker than the cerebral white matter. In the two oldest patients, examined at ages 24 to 43 years, the thalami were hyperintense relative to the basal ganglia.
The signal intensity of the pons was diffusely increased on T2-weighted images in eight patients, ages 13 months to 28 years. In these patients, T1-weighted images showed low signal intensity. The cerebellar white matter appeared normal even in the patients with cerebellar atrophy. However, in those patients for whom coronal sections were not available the cerebellar signal intensity was difficult to determine.
Signal Intensity Measurements
The ratios between the signal intensity of the deep gray matter structures (caudate nucleus, putamen, and thalamus) and that of the peripheral cerebral white matter revealed clearly different courses in patients and control subjects (Fig 5). The signal intensity of the deep gray matter did not differ between the patients and control subjects, but the peripheral white matter had a higher signal intensity in the patients than in the control group (Fig 6). These results are compatible with sparsity of myelin. No measurements were performed in the periventricular areas of reduced or increased signal intensity.
fig 5.

A and B, Ratios between signal intensity in the deep nuclei and in the peripheral cerebral white matter with 1.5-T equipment (A) and with 1.0-T equipment (B). Solid circles indicate patients; open circles, control subjects
fig 6.

A and B, Signal intensity in the deep nuclei and peripheral cerebral white matter expressed as a percentage of the intensity of CSF signal in the tips of the frontal horns. Examinations with 1.5-T equipment (A) and with 1.0-T equipment (B). The number of subjects measured varies in the figures, because in two patients and in four control subjects the frontal horns were very small or the sections containing the structures of interest were not optimally located in the sections. Solid circles indicate patients; open circles, control subjects
Atrophic Changes
In all the patients, the corpus callosum was very thin (Table 1, Fig 1A), which may be a sign of hypoplasia rather than of atrophy. Eight of the 15 patients, five of them more than 10 years old, showed other signs of atrophy on visual analysis. There was no typical pattern of atrophic change (Table 1). Atrophy, even in the cerebellum and brain stem, was most severe in the patients in whom the periventricular or general cerebral white matter signal intensity was highest. Brain atrophy is not a prominent feature in Salla disease. Widening of ventricles, sulci, and cisternae was mild to moderate even in the oldest patients and in those in whom the disease was most severe (Figs 3 and 4). All had normal head sizes.
Brain stem measurements revealed atrophy in eight of the nine patients (Table 2). In visual analysis, only one mesencephalon was estimated to be atrophic. The youngest patient with abnormal brain-stem size was 6 years old.
TABLE 2:
Measurements of the brain stem in nine patients with Salla disease

Course of the Disease during Radiologic Follow-up
Five of the 11 patients examined twice displayed a more pathologic state at the later MR imaging study.
The asymptomatic infant, when studied at the age of 1 month, did not have any obvious pathologic signs (Patient 1, Table 1). The second examination, at the age of 12 months, when she showed clinical symptoms, yielded definite signs of delayed myelination. Pontine signal abnormality was seen in two patients (cases 2 and 4) at the ages of 5 and 4 years, respectively, on both T2- and T1-weighted images but the finding had not been pathologic at 5 and 9 months, respectively. On T1-weighted images, the signal intensity above the lateral ventricles was increased in both patients at the follow-up.
In one patient (case 7), high periventricular T2 signal intensity and cerebellar atrophy developed between the ages of 21 months and 40 months.
The progression of the disease was very slow in the patients aged 10 years or older: examinations repeated at intervals of 2 to 5 years did not reveal any visual progression of the atrophy in these five patients, and progression of signal intensity abnormalities was seen in only one patient (case 14).
Only two patients (cases 6 and 8) showed some positive developmental course during the follow-up period of 5 years. Progress was minimal in case 6, appearing as increasing myelination of the internal capsules and as a general decrease in signal intensity in the cerebral white matter relative to CSF. In case 8, there was normalization of the pontine signal intensity and progressive myelination toward the motor cortex.
Relationship between Radiologic andClinical Findings
Patients whose disease was of the severe type (cases 11, 13, and 14) had very high signal intensity periventricularly or in the entire cerebral white matter, and in all of them the CSF spaces were greatly dilated. Patients with the clinically mild type of Salla disease (cases 8 and 12) had lower periventricular signal intensity above the lateral ventricles, this being a sign of myelination, and the internal capsules appeared normal at the ages of 7 years and 13 to 15 years. These patients had no atrophic changes other than a thin corpus callosum. The remaining eight patients (cases 1, 3–6, 9, 10, and 15), with the conventional type of Salla disease, had various radiologic findings (Table 1). In four of them, the cerebral white matter was homogeneous (cases 1, 3, 5, and 6); in two, the periventricular signal intensity was increased (cases 4 and 10); and in two, the periventricular myelination was minimal (cases 9 and 15).
Discussion
MR findings have previously been described in nine patients with Salla disease (5, 6). In both studies high signal intensity of the cerebral white matter was found and the etiologic factor was considered to be defective myelination. Our study is the first with follow-up data and has the greatest age range. Our results support the theory of defective myelination and indicate an association between clinical onset and radiologically demonstrable disease. Obvious delay of myelination was seen from the age 5 months onward, and the 1-month-old girl, still without clinical symptoms, was estimated to be within the limits of normal variation.
In the earlier studies, all the patients had homogeneous cerebral white matter. Our larger series and follow-up studies enabled us to recognize three different radiologic patterns for cerebral changes: one with slowly progressive periventricular myelination, another with homogeneous white matter and myelin in the internal capsules only, and the third one showing an extremely high periventricular signal intensity on T2-weighted images and the most obvious atrophic changes. Some degree of association was found between these radiologic types and the clinical severity of the disease.
An abnormal pontine signal intensity has been described earlier in only one patient, but we found it in eight of 15 patients. Abnormal signal intensity has been described in the cerebellar white matter of two siblings (6) but we did not see any deviation of cerebellar signal intensity in our patients. There may be different subtypes of the disease.
Our findings of relatively mild atrophic changes are in line with earlier observations. Our study also confirms the hypoplastic etiology of the extremely thin corpus callosum.
Quantitative methods are needed for characterization of normal and abnormal tissues. The signal intensity of each MR image has arbitrary scaling and is affected by a number of patient- and device-dependent factors. If the signal intensity pattern is abnormal, it may be difficult to know which, if any, tissue is normal. In the present study, the deep gray matter, surrounded by the hyperintense white matter, appeared dark on T2-weighted images but, when measured, was of normal signal intensity. It is good to remember that measurements can reveal only major differences and do not exclude smaller deviations from the normal intensity level. In the two oldest patients, visible thalamic hyperintensity was seen in the basal ganglia on T2-weighted images. In healthy persons, the thalami are hypointense relative to the basal ganglia at a comparable age (10). In many other lysosomal diseases, the thalami show strongly reduced signal intensity (11–17). However, an increase in the measured signal intensity of the thalami has been described in the later stages of one lysosomal disease, the infantile type of neuronal ceroid lipofuscinosis (INCL) (11). A process of the same type, maybe gliosis (18), possibly occurs in patients with Salla disease.
By using intensity measurements, it is possible to make comparisons among subjects. We have shown that the peripheral cerebral white matter signal intensity in our patients, representing different age groups, did not vary much but was clearly different from that of the control subjects. This observation supports the theory of defective myelination.
With brain stem measurements, we were able to demonstrate atrophic changes that were not detectable visually. We used a rapid method with linear measurements. Volumetric methods have an even higher potential for revealing small atrophic changes. Diagnosis of brain stem atrophy is not of great importance for the individual patient but, in a study of disease pathogenesis, it is important to document which areas of the brain are affected.
Neuropathologic symptoms have been described only in two patients, both 41 years old (19). The lateral ventricles were slightly enlarged and the corpus callosum very thin, only about 1-mm thick. Histologically, loss of axons and myelin sheaths was accompanied by pronounced astrocytic proliferation. Many cortical cells displayed abnormal amounts of lipofuscin. Neurofibrillary tangles were seen in nerve cells of the neocortex, nucleus basalis of Meynert, and locus ceruleus. The cerebellum showed a moderate loss of Purkinje cells.
In lysosomal diseases, MR studies have revealed three different types of white matter involvement. Mucopolysaccharidoses with cavitary perivascular spaces (13–15) are a special group. In many diseases, the signal intensity of the cerebral white matter increases as a result of demyelination or dysmyelination. Pathologic areas may appear in infancy and progress rapidly, or may be very slight and slowly progressive, developing during adolescence. INCL is an example of the first kind and the juvenile type of the latter kind (17). The cerebellar white matter may also be involved, as in Krabbe disease (20). Defective myelination has been documented in aspartylglycosaminuria and in Salla disease. In aspartylglycosaminuria, a delayed but continuous maturation process has been shown and the patients reach almost normal cerebral myelination during the second decade (21). Salla disease has a different course, cerebral myelination being minimal as the result of an extremely slow process. Patients with the severe type of disease and the highest periventricular signal intensity show resemblances to the more common types of lysosomal storage disorders.
The differential diagnosis from many other metabolic or neurodegenerative diseases can often be made clinically, but MR imaging can be a helpful tool in early differentiation from diseases with a clinical resemblance.
Pelizaeus-Merzbacher disease has some clinical resemblances to Salla disease. Lack of myelin is typical of both diseases, but in Pelizaeus-Merzbacher disease, both the cerebellar and the cerebral white matter are usually involved, although the myelin in the brain stem and cerebellum may be spared (22). These patients also have brain atrophy. The white matter may have a patchy, so-called tigroid appearance (23). Pelizaeus-Merzbacher disease is most often X-linked, whereas Salla disease is autosomally inherited.
In the infantile type of Canavan disease, the brain is enlarged (12, 24, 25). These patients have megaloencephaly, whereas in Salla disease the head size is normal.
Early atrophy is not pathognomonic for Salla disease, being common in many other metabolic disorders. In patients with INCL, typical findings are early cerebral atrophy and a low signal intensity of the thalami on T2-weighted images (11, 15, 17). Periventricular rims with high signal intensity appear before or at the age of 1 year in INCL, whereas in Salla disease the white matter is homogeneous. The internal capsules have a normal appearance in INCL. Low thalamic signal intensity is also typical of gangliosidosis GM-2, but the signal intensity on T1-weighted images may be high (12–15). White matter findings have been variable in GM-2.
In some cases, the clinical pictures of Krabbe and Salla diseases may show similarities. In Krabbe disease, MR imaging reveals early leukodystrophic changes in the cerebellar white matter and around the atria of the lateral ventricles, but the peripheral white matter appears normal. In addition, the thalamic signal intensity varies and may be inhomogeneous (16, 20, 26–28).
Myelination of the brain is delayed in aspartylglycosaminuria (21), but does progress slowly, whereas in Salla disease it is lacking or extremely slow. The thalami show lower signal intensity than the basal ganglia, in contrast to patients with Salla disease.
In Rett syndrome, all the patients are girls, whereas Salla disease affects both girls and boys. No radiologic abnormality has been seen in the early stages of Rett syndrome (15, 29).
Conclusion
It seems that in Salla disease the cerebrum does not undergo normal myelination. In patients with the most common clinical presentation, myelination, though delayed and defective, is found in the internal capsules. A few patients, often with the clinically mild type of the disease, also have some periventricular myelination. Regular myelination can be seen in the cerebellum, while in the brain stem it may be delayed or abnormal. Some patients, often with the most clinically severe type of the disease, have extremely high periventricular or general cerebral white matter signal intensity, which, in combination with atrophic changes, indicates an additional active, destructive, maybe demyelinating, process. This hypothesis is further supported by the fact that even the patients with the best progression of myelination have some signs of atrophy. The underlying pathogenesis of the disease is not yet known.
TABLE 1:
Extended</?>
Footnotes
Address reprint requests to Pirkko Sonninen, MD, Department of Diagnostic Radiology, University Hospital of Turku, FIN-20520 Turku, Finland.
References
- 1.Aula P, Autio S, Raivio KO. “Salla disease”: a new lysosomal storage disorder. Arch Neurol 1979;36:88-94 [DOI] [PubMed] [Google Scholar]
- 2.Renlund M, Aula P, Raivio KO, et al. Salla disease: a new lysosomal disorder with disturbed sialic acid metabolism. Neurology 1983;33:57-66 [DOI] [PubMed] [Google Scholar]
- 3.Renlund M, Tietze F, Gahl WA. Defective sialic acid egress from isolated fibroblast lysosomes of patients with Salla disease. Science 1986;232:759-762 [DOI] [PubMed] [Google Scholar]
- 4.Haataja L, Schleutker J, Laine AP, et al. The genetic locus for free sialic acid storage disease maps to the long arm of chromosome 6. Am J Hum Genet 1994;54:1042-1049 [PMC free article] [PubMed] [Google Scholar]
- 5.Haataja L, Parkkola R, Sonninen P, et al. Phenotypic variation and magnetic resonance imaging (MRI) in Salla disease, a free sialic acid storage disorder. Neuropediatrics 1994;25:1-7 [DOI] [PubMed] [Google Scholar]
- 6.Robinson RO, Fensom A, Lake B. Salla disease: rare or underdiagnosed? Dev Med Child Neurol 1997;39:153-157 [DOI] [PubMed] [Google Scholar]
- 7.Barkovich AJ. Normal postnatal brain development. In: Pediatric Neuroimaging Philadelphia: Lippincott-Raven; 1996:20-35 [Google Scholar]
- 8.Raininko R, Autti T, Vanhanen SL, Ylikoski A, Erkinjuntti T, Santavuori P. The normal brain stem from infancy to old age: a morphometric MRI study. Neuroradiology 1994;36:364-368 [DOI] [PubMed] [Google Scholar]
- 9.Salonen O, Autti T, Raininko R, et al. MRI of the brain in neurologically healthy middle-aged and elderly individuals. Neuroradiology 1997;39:537-545 [DOI] [PubMed] [Google Scholar]
- 10.Autti T, Raininko R, Vanhanen SL, et al. MRI of the normal brain from early childhood to middle age, II: age dependence. Neuroradiology 1994;36:649-651 [DOI] [PubMed] [Google Scholar]
- 11.Vanhanen SL, Raininko R, Autti T, Santavuori P. MRI evaluation of the brain in infantile neuronal ceroid-lipofuscinosis, 2: MRI findings in 21 patients. J Child Neurol 1995;10:444-450 [DOI] [PubMed] [Google Scholar]
- 12.Brismar J. CT and MRI of the brain in inherited neurometabolic disorders. J Child Neurol 1992;7(Suppl):112. [DOI] [PubMed] [Google Scholar]
- 13.Yoshikawa H, Yamada K, Sakunagawa N. NMR in the early stage of Tay-Sachs disease. Neuroradiology 1991;33:25-29 [DOI] [PubMed] [Google Scholar]
- 14.Koelfen W, Freund M, Jaschke W, Koenig S, Schultze C. GM-2 gangliosidosis (Sandhoff's disease): two years follow-up by MRI. Neuroradiology 1994;36:152-154 [DOI] [PubMed] [Google Scholar]
- 15.Blaser SI, Clarke JT, Becker LE. Neuroradiology of lysosomal disorders. Pediatr Neuroradiol 1994;2:283-298 [PubMed] [Google Scholar]
- 16.Sasaki M, Sakuragawa N, Takashima S, Hanaoka S, Arima M. MRI and CT findings in Krabbe disease. Pediatr Neurol 1991;7:283-288 [DOI] [PubMed] [Google Scholar]
- 17.Autti T, Raininko R, Vanhanen SL, Santavuori P. MRI of neuronal ceroid lipofuscinosis, I: cranial MRI of 30 patients with juvenile neuronal ceroid lipofuscinosis. Neuroradiology 1996;38:476-482 [DOI] [PubMed] [Google Scholar]
- 18.Vanhanen SL, Raininko R, Santavuori P, Autti T, Haltia M. MRI evaluation of the brain in the infantile neuronal ceroid-lipofuscinosis, I: postmortem MRI with histopathologic correlation. J Child Neurol 1995;10:438-443 [DOI] [PubMed] [Google Scholar]
- 19.Autio-Harmainen H, Oldfors A, Sourander P, Renlund M, Dammert K, Similä S. Neuropathology of Salla disease. Acta Neuropathol (Berl) 1988;75:481-490 [DOI] [PubMed] [Google Scholar]
- 20.Barone R, Bruhl K, Stoeter P, Fiumara A, Pavone L, Beck M. Clinical and neuroradiological findings in classic infantile and late-onset globoid-cell leukodystrophy (Krabbe disease). Am J Med Genet 1996;63:209-217 [DOI] [PubMed] [Google Scholar]
- 21.Autti T, Raininko R, Haltia M, et al. Aspartylglucosaminuria: radiologic course of the disease with histopathologic correlation. J Child Neurol 1997;12:369-375 [DOI] [PubMed] [Google Scholar]
- 22.Van der Knaap MS, Valk J. Non-leukodystrophic white matter changes in inherited disorders. Int Neuroradiol 1995;56-66
- 23.Kim TS, Kim IO, Kim WS, et al. MR of childhood metachromatic leukodystrophy. AJNR Am J Neuroradiol 1997;18:733-738 [PMC free article] [PubMed] [Google Scholar]
- 24.Goutieres F, Boulloche J, Bourgeois M, Aicardi J. Leukoencephalopathy, megalencephaly, and mild clinical course. J Child Neurol 1996;11:439-444 [DOI] [PubMed] [Google Scholar]
- 25.Brismar J, Brismar G, Gascon G, Ozand P. Canavan disease: CT and MR imaging of the brain. AJNR Am J Neuroradiol 1990;11:805-810 [PMC free article] [PubMed] [Google Scholar]
- 26.Vanhanen SL, Raininko R, Santavuori P. Early differential diagnosis of infantile neuronal ceroid lipofuscinosis, Rett syndrome, and Krabbe disease by CT and MR. AJNR Am J Neuroradiol 1994;15:1443-1453 [PMC free article] [PubMed] [Google Scholar]
- 27.Finelli DA, Tarr RW, Sawyer RN, Horwitz SJ. Deceptively normal MR in early infantile Krabbe disease. AJNR Am J Neuroradiol 1994;15:167-171 [PMC free article] [PubMed] [Google Scholar]
- 28.Baram TZ, Goldman AM, Percy AK. Krabbe disease: specific MRI and CT findings. Neurology 1986;36:111-115 [DOI] [PubMed] [Google Scholar]
- 29.Nihei K, Naitoh H. Cranial computed tomographic and magnetic resonance imaging studies on the Rett syndrome. Brain Dev 1990;12:101-105 [DOI] [PubMed] [Google Scholar]