

Abstract
BACKGROUND AND PURPOSE: The MR imaging appearance of intracranial manifestations in tuberous sclerosis varies with age. The aim of this study was to specify MR characteristics in a coherent group of neonates and infants in order to distinguish them from the mature pattern.
METHODS: The MR studies of seven patients under 3 months old were reviewed retrospectively. Imaging appearance, number, and distribution of tubers, white matter anomalies, subependymal nodules, and subependymal giant cell astrocytomas were analyzed.
RESULTS: All patients had more white matter anomalies, subependymal nodules, subependymal giant cell astrocytomas, transmantle dysplasias, and left-hemispheric and temporal lesions, but less cortical tubers than did older patients in previous series. The lesions were easy to detect as hyperintense foci on T1-weighted images. Visibility as hypointensities on T2-weighted images was comparatively poor.
CONCLUSION: The nodular subependymal and linear parenchymal tuberous sclerosis lesions in infants under 3 months old are hyperintense on T1-weighted images and hypointense on T2-weighted images as opposed to the reverse pattern of signal intensity in older persons. The scarce myelination helps to identify white matter anomalies, which become less visible as myelination progresses. Conversely, purely intracortical tubers are more difficult to diagnose in infants. Because the overall number and conspicuity of all other lesions in our series were greater than in previous series with older subjects, our findings indicate that infant age does not compromise, but facilitates, the correct MR diagnosis of tuberous sclerosis. Therefore, if tuberous sclerosis is clinically suspected within the first 3 months of life, imaging should not be delayed.
Tuberous sclerosis is a phakomatosis with dysplasias and hamartomas frequently affecting the brain, eyes, kidneys, heart, and skin (1, 2). It may be transmitted as an autosomal dominant trait with variable penetrance (3), but 60% to 70% of cases occur sporadically. Three different mutations have been associated with the disorder, located on chromosomes 9, 11, and 16 (4–6). The prevalence/clinical penetrance of tuberous sclerosis is now estimated to be from one in 6000 to one in 12,000 live births (7, 8). The mean age of diagnosis is 5 years (9) and ranges from early childhood to late in the second decade (10). Overall, epilepsy and mental deficits are the most common neurologic problems and tend to be more severe if manifested early (11).
Although a number of articles have reported neuroimaging findings in tuberous sclerosis, most of these have dealt exclusively with the imaging of older children and adults. Case reports of neonates with tuberous sclerosis (12–14) and imaging series (four patients ≤4 months of age [15] and one neonate [16]) have shown that the appearance of cerebral tuberous sclerosis varies with age. Our own experience suggests that the appearance of tuberous sclerosis on MR imaging studies of the brain in neonates differs considerably from that in older children and adults. In this study of seven neonates and infants under the age of 3 months, we proposed to precisely describe and quantify the distinguishing neuroimaging features of tuberous sclerosis in this age group and trace the evolution of imaging characteristics over that time period. Recognition of the specific imaging characteristics of tuberous sclerosis in early infancy will help to establish the diagnosis as early as possible, thus ensuring appropriate clinical management of the patients and counseling of the parents.
Methods
A review of records between 1991 and 1998 disclosed brain MR studies of seven patients under the age of 3 months who were examined at our facility. The youngest patient, a premature neonate of 33 weeks' gestational age, was imaged 2 days after birth; the oldest, a term infant, was imaged at 10 weeks. Indications for the examinations included infantile spasms (n = 3), cardiac tumor on a prenatal sonogram (n = 2), intraventricular mass on a cranial sonogram (n = 1), and the presence of a cardiac tumor in a monozygotic twin (n = 1). Two of the patients (one with seizures, one with an intraventricular mass) additionally were macrocephalic. We found no patients imaged between 3 and 6 months, possibly because our group is a selection of seriously affected infants who all presented before that age. To show the difference between the neonatal appearance and that of older infants, we illustrate images of two patients with tuberous sclerosis who were examined because of infantile spasms, one at age 6.5 months, the other at age 8 months.
Imaging was performed at 1.5 T and included axial and sagittal spin-echo (SE) T1-weighted sequences (500–600/8–20/2 [TR/TE/excitations]) with a section thickness of 3 or 4 mm and a gap of 0.5 to 1 mm, and axial SE proton density—and T2-weighted sequences (3000/60,120/1) with a section thickness of 4 mm and a gap of 2 mm in all patients. In four patients, coronal 3D spoiled gradient-recalled acquisition in the steady state (SPGR) sequences (36/9/1; flip angle, 35°; section thickness, 1.5 mm with no gap) were obtained. Two patients were examined with an additional coronal 3D fast spin-echo (FSE) sequence (4000/85eff/1; echo train length, 16; section thickness, 1.5 mm, overlapping). The acquisition matrix was always 192 × 256 or 256 × 256, the field of view varied between 16 and 20 cm. Four patients received contrast material before the axial and sagittal T1-weighted images. One patient who eventually underwent epilepsy surgery was additionally examined with a high-resolution phased-array surface coil. She had several follow-up studies, including CT, up to the age of 8 months.
All MR studies were reviewed by two radiologists in order to differentiate white matter anomalies, tubers, subependymal nodules, and subependymal giant cell astrocytomas (SGCA); to determine their number, size, shape, lobar, and left-right distribution; and to assess their visibility on different sequences (especially T1- versus T2-weighted) and contrast uptake. A lesion was considered to be present if both reviewers agreed it was present on any sequence. A tuber was defined as a lesion of abnormal signal intensity located within a cortical gyrus. Tubers were divided into the expansile (Pellizzi 1) or shrunken-appearing (Pellizzi 2) phenotypes (17). A transmantle dysplasia was defined as dysplastic tissue extending from the cortex to the wall of the ventricle (ie, a contiguous large tuber and large white matter anomaly) (18). Subependymal nodules were defined as lesions originating from the wall of the lateral ventricle and protruding into the ventricular lumen. A subependymal lesion was considered to be moderately suggestive of a giant cell astrocytoma if the nodule was greater than 12 mm in size or if it caused CSF flow obstruction; if both these signs were present and/or if there was contrast enhancement, the nodule was considered highly suggestive of SGCA (11, 15). White matter anomalies were defined as areas of abnormal signal intensity within the white matter; the signal intensity of all lesions was compared with that of unmyelinated white matter. If very large tubers, white matter anomalies, or transmantle dysplasias involving more than one lobe were present, their location was classified according to the site of the major portion.
The number of tubers versus white matter anomalies, tubers versus subependymal nodules, and white matter anomalies versus subependymal nodules, respectively, were correlated using the Spearman rank correlation. The Wilcoxon test was used to compare the number of tubers in the left and right hemispheres.
Results
White Matter Anomalies
All patients had white matter anomalies, for a total of 205, ranging from four to 69 per patient (see the Table). Of these, 203 were visible as foci of high signal on T1-weighted images, although less than half of these were picked up as hypointense on T2-weighted sequences. None of the white matter anomalies were either hypointense on T1-weighted images or hyperintense on T2-weighted images. Left-right distribution was fairly even in single patients as well as in the whole group (see Table). Additionally, one patient had a solitary cerebellar white matter focus of T1 and T2 shortening.
TABLE: Distribution and conspicuity of white matter anomalies and tubers in seven patients with tuberous sclerosis
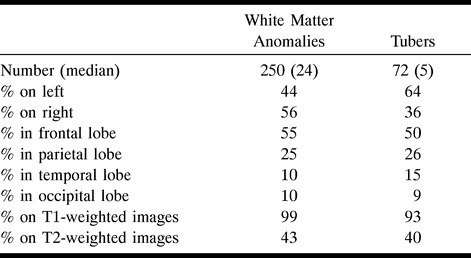
Thirty-nine percent of white matter anomalies were perceived as punctate signal anomalies ranging in size from 1 to 4 mm without obvious contiguity on adjacent sections or linear correlates in other section directions, whereas 59% appeared as streaks in at least one plane. Most of the latter had a transverse diameter of 1 or 2 mm, and their longitudinal axis was perpendicular to the wall of the lateral ventricle. On sagittal T1-weighted images, they were always best appreciated as a radial pattern, sometimes visible all the way from the wall of the lateral ventricle to the cortex (Figs 1 and 2A). Wedge- or cone-shaped white matter anomalies with a transverse diameter above 2 mm occurred in 1.5% of visualized lesions. Furthermore, diffuse signal changes affecting more than one third of the white matter in one hemisphere were present in two patients. Both were combined with striking left-hemispheric transmantle dysplasias with large tubers involving more than one lobe and several subependymal nodules lining the subjacent ventricular wall (Figs 2 and 3). The linear, wedge-shaped, and diffuse anomalies often ended immediately adjacent to a subependymal nodule on the ventricular side and a tuber on the cortical side.
fig 1.
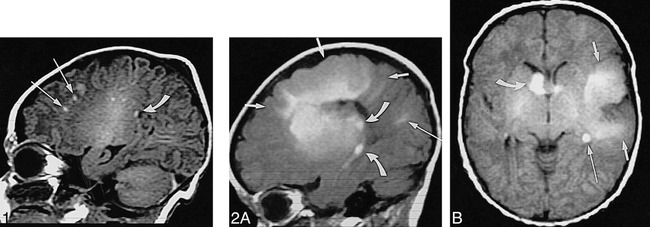
Neonate, 4 days. Sagittal SE T1-weighted MR image (600/8/2) shows white matter anomalies as punctate hyperintensities (two marked by long arrows) radiating toward ventricles, several subependymal nodules (one marked by curved arrow) in left atrium, and incidental postnatal findings of hyperintense subdural hemorrhage overlying cerebellum and parietal caput succedaneum (not marked).
fig 2. Neonate, 7 days.
A, Sagittal SE T1-weighted MR image (600/15/2) shows left-hemispheric large transmantle dysplasia (short arrows) as hyperintense area extending from frontoparietal cortex to lateral ventricle; bright subependymal nodules (two marked by curved arrows), located around atrium and temporal horn; and parietal hyperintense linear white matter anomalies (long arrow).
B, Axial SE T1-weighted MR image (500/15/2) shows transmantle dysplasia (short arrows) underlying asymmetrically large perisylvian subarachnoid space; hyperintense probable SGCA (>12 mm) is seen at right foramen of Monro (curved arrow) and subependymal nodules at left foramen of Monro and atrium (only atrium marked, long arrow).
fig 3.
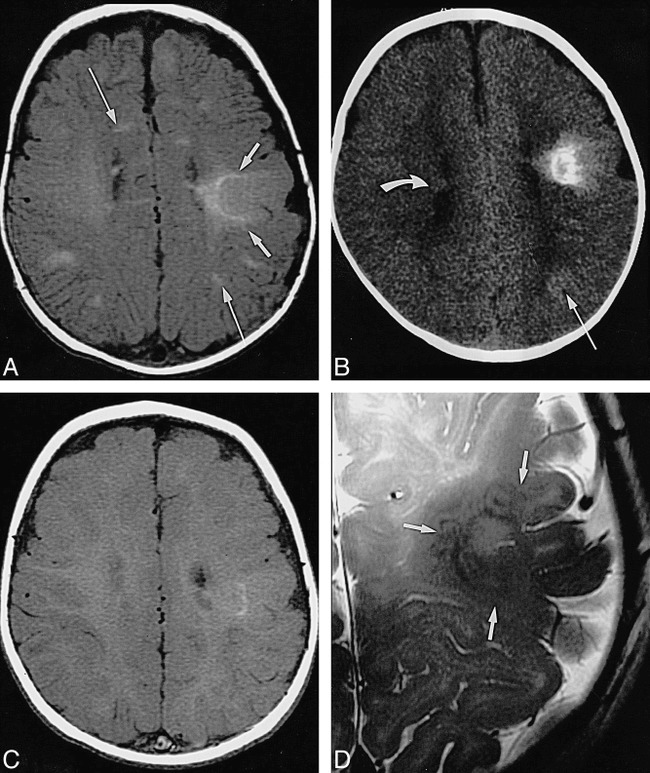
Infant, imaged at ages 10 weeks, 4 months, and 8 months.
A, Axial SE T1-weighted MR image (500/13/2) at 10 weeks: pachygyric left frontoparietal cortical tuber is less hyperintense than semilunar deep white matter “rim” of transmantle dysplasia (short arrows), which extends all the way to the wall of the lateral ventricle; overlying subarachnoid space is enlarged; various linear white matter anomalies (only two marked by long arrows) are present in both hemispheres; and small subependymal nodules are seen along cellae mediae of both lateral ventricles (not marked).
B, Axial CT scan at 4 months: periphery of transmantle dysplasia is densely calcified, strands of “sunburst” pattern extend toward cortex and left lateral ventricle (not marked); left parietal white matter anomalies (long arrow) are faintly hyperdense; and small subependymal nodules can be seen, for example, in the right lateral ventricle (curved arrow).
C, Axial SE T1-weighted MR image (500/12/2) at 8 months: note that intensity pattern of transmantle dysplasia (not marked) has changed (compare with A); subependymal nodules are visible at cella media of left ventricle (not marked), but white matter anomalies are not visible.
D, Axial high-resolution (surface coil) FSE T2-weighted MR image (4000/112eff/1) at 8 months: transmantle dysplasia is depicted as layered swirls of different signal intensity (arrows).
In the 5-day-old monozygotic twins, there was an almost identical appearance of the few white matter anomalies and subependymal nodules. One tuber could be detected in one of them; this infant developed infantile spasms at age 7 months. It has been suggested that these early differences in twins can be a predictor of normal versus delayed neuromotor development (19).
Tubers
Seventy-two tubers were detected (ranging in number from 0 to 30 per patient; see Table), and were significantly more common in the left hemisphere (P ≤ .05). The lobar distribution is given in the Table. Again, almost all, although not quite as many as with the white matter anomalies, were seen as high signal lesions on T1-weighted images, whereas less than half were visible on T2-weighted images; and all were hypointense. No tubers were perceived as T1 hypointense or T2 hyperintense. In general, more T1 hyperintense tubers were detected on the thinner sagittal images than on the thicker axial images. Except for two cases of questionable Pellizzi 2 phenotype, all tubers exhibited some degree of gyral enlargement and subarachnoid encasement (Pellizzi 1). Two tubers larger than 2 cm in diameter showed transmantle extension to the wall of the lateral ventricle. There was mixed signal on T1-weighted images in two tubers, one of which appeared calcified on CT scans. Both were found in one of the patients who had severe transmantle malformations. Figure 3 shows the signal development in one of these calcified tubers and the adjacent white matter anomalies over a period of 5.5 months. Many similarities can be noted in another severe left-sided transmantle dysplasia (Fig 2).
Subependymal Nodules and Subependymal Giant Cell Astrocytomas
Ninety-six subependymal nodules (median, 13 per patient; range, six to 24 per patient) could be seen, 42% on the left side. Two were highly (Fig 4) and one moderately (Fig 2B) suggestive of SGCA. Thirty-four percent of the subependymal nodules were located at the foramina of Monro or frontal horns, 40% at the atria, and 26% at the temporal horns. There was one subependymal nodule in the occipital horn; none were found at the third or fourth ventricle. While 95 hyperintense subependymal nodules were detected on T1-weighted images, T2-weighted images only revealed 46, all hypointense compared with unmyelinated white matter. None were T1 hypointense or T2 hyperintense. The temporal nodules were appreciated best on the T1-weighted sagittal images (Fig 2A) and were almost invariably missed on the T2-weighted axial images. The youngest patient, examined 2 days after birth at 33 weeks' gestation, already had hydrocephalus induced by two lesions highly suggestive of SGCA (Fig 4). The likely case of SGCA occurred in a 1-week-old neonate with incipient obstruction of the ipsilateral foramen of Monro (Fig 2B).
fig 4.
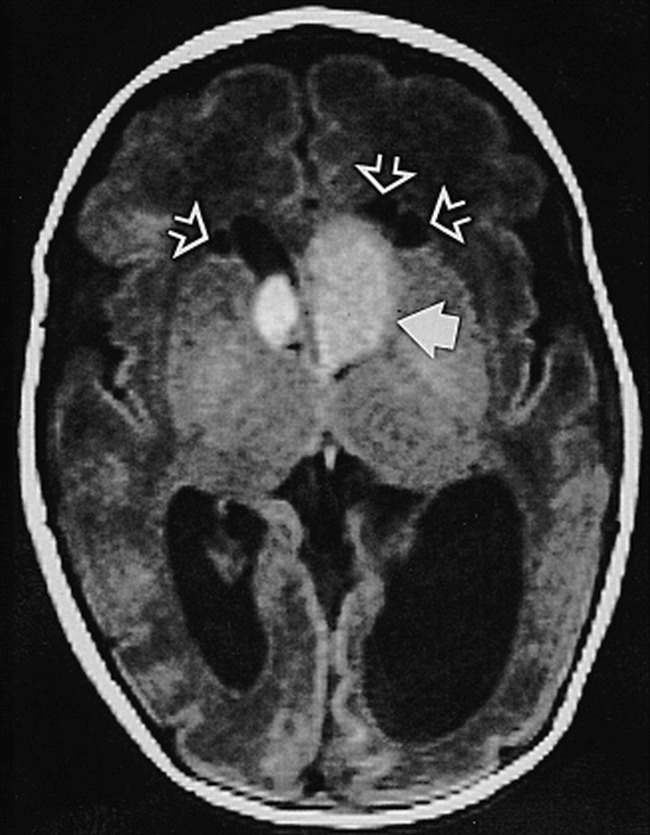
Neonate, 2 days (33 weeks' gestation). Axial SE T1-weighted MR image (750/20/2) shows large presumed SGCA at left foramen of Monro (solid arrow), smaller one on right (not marked); hydrocephalus, more pronounced on left; and three cysts adjacent to frontal horns of lateral ventricles (open arrows)
Common Features in White Matter Anomalies, Tubers, and Subependymal Nodules
Of all tuberous sclerosis lesions, 98% were diagnosed as hyperintensities on T1-weighted images whereas T2-weighted sequences revealed hypointensity in 44%. There was a positive correlation between the number of tubers and white matter anomalies (P < .01), subependymal nodules and white matter anomalies (P < .01), and tubers and subependymal nodules (P < .05; Spearman's ρ .93, .85, and .83, respectively). In those cases with numerous anomalies of all categories, the lesions tended to cluster in the same lobes. As a general observation, the larger the diameter of any of the anomalies (white matter anomalies, tubers, subependymal nodules, SGCA), the larger the diameter of the other two.
Sequential images in one patient revealed that detectability of the tubers and white matter anomalies deteriorated dramatically beyond age 6 months (Fig 3). This reduced conspicuity, which was supported in studies of a 6-month-old control subject that showed CT to have a greater sensitivity than MR imaging (Fig 5A and B), appears to be the result of myelination. Continued myelination seems to cause a frank reversal of intensity of some lesions, producing the adult intensity pattern (Fig 6). Such a striking difference in conspicuity and signal reversal could not be demonstrated for subependymal nodules or SGCA, although the contrast in relation to unmyelinated white matter and basal ganglia (Figs 2B and 4) is certainly better than in the older infants (Figs 5A and 6A). The patients shown in Figures 5 and 6 were not included in the numerical analysis.
fig 5.
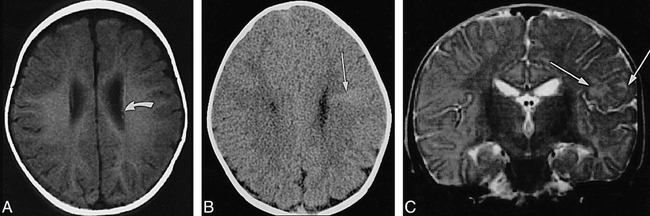
Infant, 6 months: T1 reversal point.
A, Axial SE T1-weighted MR image (350/20/2) shows two barely distinguishable subependymal nodules (arrow points to more frontal one) along wall of left lateral ventricle; no tuber or white matter anomalies can be seen.
B, Axial CT scan shows hyperdense left frontal wedge-shaped white matter anomalies (arrow).
C, Coronal SE T2-weighted MR image (4000/90/1) shows left frontal tuber and white matter anomalies as slightly hyperintense (arrows).
fig 6.
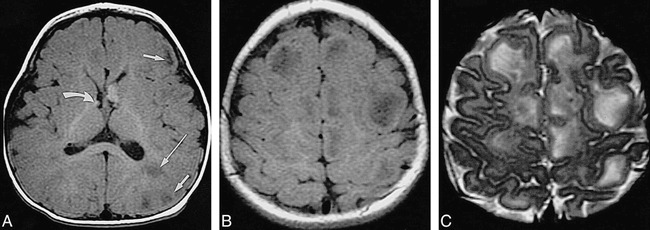
Infant, 8 months: “adult” signal pattern.
A, Axial SE T1-weighted MR image (550/20/2) shows multiple bihemispheric tubers (only left frontal and parietal ones are marked by short arrows) and left parietal white matter anomalies (long arrow), all moderately to markedly hypointense; subependymal nodules at both foramina of Monro (only smaller one on right is marked by curved arrow) are moderately hyperintense.
B, Axial SE T1-weighted MR image (550/20/2) shows numerous hypointense tubers (not marked) in both hemispheres.
C, Axial SE T2-weighted MR image (3600/90/1) shows tubers (not marked) as marked hyperintensities.
Associated Features
The premature neonate (33 weeks' gestation) with obstructive hydrocephalus due to SGCA had three white matter cysts, which were located adjacent to the frontal horns (Fig 5B and C). None were seen in other patients.
The subarachnoid space overlying huge transmantle dysplasias was very large in the two cases seen (Figs 2 and 3). This enlargement was greater than what would be expected from mere retraction of the subjacent tuber. We have observed similar findings in other cortical dysplasias not associated with tuberous sclerosis.
No callosal agenesis or retinal hamartomas were seen.
Incidental Findings
Three patients had a cavum septi pellucidi and one a cavum vergae. There were subdural postnatal hematomas in two patients and one caput succedaneum (Fig 1).
Discussion
In our neonatal and early infancy series, semiology and lesion number deviated considerably from those seen in older patients. We will first discuss findings on a lesion-by-lesion basis, then review the clinical, technical, and differential diagnostic implications.
White Matter Anomalies
Using MR imaging, we detected white matter anomalies in all patients. By contrast, others have found fewer (93% in patients 1 month to 27 years old [15]) or even considerably fewer (21%; 91% in patients over 2 years old [20]) white matter anomalies in their MR series. Furthermore, the median number of white matter anomalies in our group is 24, versus a mean of six reported by others (15). Thus, the white matter anomalies/tuber ratio was 2.8 (see Table) as opposed to 0.52 (15). This sixfold relative increase in the ratio probably reflects two factors: that T1-hyperintense white matter anomalies may be better detected in neonatal brains, and that our patients may have an increased number of lesions, since they represent a selection of very young infants with early onset of infantile spasms and/or large cardiac rhabdomyomas, both ominous signs for clinical outcome (20, 21). Correspondingly, a mean of more than six white matter anomalies has only been reported in retarded children (9). In that series of 110 patients aged 3 months to 18 years, no correlation between age and number of lesions could be detected by X-ray CT.
The prevailing radial ventriculofugal pattern of the white matter anomalies is explained by embryologic development (15, 22), the white matter anomalies representing altered development along the migratory pathways of neurons and glia.
Rarely, high frontoparietal punctate hypointense white matter anomalies could be perceived on T2-weighted images, as the early myelination in this area renders them lower in free protons than the adjacent white matter. Conversely, T2-weighted imaging missed more than half the entire number of white matter anomalies, the proportion being even higher in the deep white matter.
Tubers and Transmantle Dysplasias
Thirty-eight of 69 tubers were missed on T2-weighted images that were visible on T1-weighted images (Table). This can be explained by similarly long relaxation times in the highly cellular tubers and the unmyelinated brain, and goes along with earlier reports (12, 13, 15). However, even combining all MR sequences, fewer tubers could be detected in our patients (median, five tubers per patient; range, none to 30; tuber/white matter anomaly ratio, 0.35) as compared with a series spanning a wider age group: mean, 11.6 tubers per patient; range, none to more than 50; tuber/white matter anomaly ratio, 1.9; patients' ages, 1 month to 27 years (15). Given the fact that disorganized clusters of poorly differentiated glioneural elements are present from the time embryologic migration is disturbed (8–22 weeks) (12, 23), this is unlikely to result from the presence of different numbers of tubers at different ages. On the contrary, it has been shown (20) that patients who presented with seizures between ages 0 and 3 months, later had a mean of 19.2 tubers revealed by MR imaging. The likelihood of the first seizure being an infantile spasm increased significantly (P < .001) with an increasing number of tubers. Although, in contrast to our evaluation criteria, these investigators inferred the presence of a cortical tuber from architectural distortion or signal anomalies immediately subjacent to the cortex, this difference alone should not quadruple the number of tubers and would not have done so in our patients. It is more reasonable to assume that brain maturation, hamartomatous growth, and dystrophic calcification render tubers more conspicuous over time. Additionally, the hyperintense appearance of the cortex on T1-weighted images (Figs 1, 2, and 5) may mask purely intracortical anomalies. Thus, some tubers may have been missed if the gray/white matter junction was not bulging, a fact demonstrated in a pathologic-radiologic correlation study by Nixon et al (24), accounting for 7% of all tubers missed on T1-weighted images but in turn picked up on T2-weighted images. Still, our results do not support previous conclusions that tuber visualization, and hence diagnosis of tuberous sclerosis based on MR imaging findings, can only be reliably achieved after the age of 16 to 18 months (25).
The tuber distribution (see Table) for the frontal, parietal, and occipital lobes matches the numbers reported by Braffman et al (15), whereas Houser et al (25) report a higher prevalence of frontal lobe tubers (up to 90%). The percentage of temporal lobe lesions in our patients is five times higher than that in other series (15). This higher temporal lobe prevalence, in turn, coincides with an analysis of patients with infantile spasms who had almost twice as many temporal lobe tubers as patients with a first presentation of generalized seizures (20). A recent report links temporal lobe tubers to autism in tuberous sclerosis, possibly a result of severe intellectual deficiency due to extremely frequent seizures (26).
A large frontal lobe tuber load, if combined with infantile spasms, is an ominous sign for neuromotor development, as frontal lobe tubers induce more secondary bilateral synchronies, which are drug-resistant (27). Correspondingly, Hayashi et al (28) report a solitary frontal lobe tuber in a 6-day-old neonate presenting with infantile spasms, and Shepherd et al (20) suggest that a large number of frontal lobe tubers is a predictor of mental retardation.
All our patients had more tubers in the left hemisphere than in the right. This observation seems to substantiate speculations that lesions in the dominant hemisphere have a higher rate of epileptogenicity. In general, left-right asymmetry of neuroradiologic findings in tuberous sclerosis (15) and asymmetric clinical presentation of infantile spasms (29, 30) are not unusual.
Based on the classification proposed by Braffman et al (15) we diagnosed two questionable cases of so-called Pellizzi type 2 tubers. These researchers had first described this pattern in analogy to the pathologic report by Pellizzi (17) and found it in 12% of their patients. Given the imaging appearance (see Figs 2 and 3) and the young age of our patients, it seems more likely that they represent a malformation of cortical development (31), with a large overlying subarachnoid space rather than a central depression resulting from atrophy (32). This is supported by other cases in which the histologic borderline between tuberous sclerosis and other forms of cortical dysplasia is not well defined (33, 34); indeed, many consider the cerebral lesions of tuberous sclerosis to be malformations of cortical development (15, 35, 36).
Two of our patients had severe transmantle anomalies with contiguous tubers, white matter anomalies, and subependymal nodules, both left hemispheric (Figs 2 and 3). This is compatible with a worst-case scenario, as both transmantle dysplasia and dominant-hemisphere lesions are known to be very epileptogenic (18).
The calcification identified in one tuber (Fig 3) supports previous reports demonstrating calcified tubers at very early ages (28), even in newborns (37). Furthermore, it shows that the concentric pattern of calcification depicted on sequential MR and CT examinations changes over time. There have been reports of a targetlike calcified tuber with a T1 hyperintense rim in an infant of 8 months (38) and of gyriform calcifications in tuberous sclerosis that simulated Sturge-Weber disease (39). Regan (32) found a corresponding pattern of concentric spheres of calcium in pathologic specimens of subependymal hamartomas. The varied MR appearance can be explained by varying crystalline surface areas (40–42), possibly in different “generations” of calcium deposits. The relatively long T1 relaxation time of the surrounding infant brain accentuates this effect (14, 16). From the similar MR appearance in Figure 2B we infer early calcification already in this 1-week-old neonate (she was not examined by CT).
Subependymal Nodules
All patients in our group had subependymal nodules. The median of 13 subependymal nodules per patient is very high compared with the 3.8 per patient seen on CT scans by Altman et al (16) or the six per patient seen on MR images by Braffman et al (15). The usual percentage of patients with more than 10 subependymal nodules is 12% (43) versus 57% (four of seven) in our group. Our results mirror the known predilection for the foramina of Monro and the atria, but we found a surprisingly high rate of temporal subependymal nodules (26% of all subependymal nodules versus 2.2% seen by Braffman et al [15]), paralleling the high prevalence of tubers and white matter anomalies in the temporal lobe. All these observations most likely reflect the severity of the phenotype of the neonate presenting with infantile spasms.
The signal of the subependymal nodules was always T1 hyperintense and T2 iso/hyperintense, suggesting either cellular lesions or the presence of hydrated calcium (40–42). In the older patients (Figs 5 and 6), subependymal nodule signal intensity blended with advanced periventricular myelination, rendering detection on T1-weighted images more difficult. But, unlike tubers and white matter anomalies, there was no reversal of signal intensity in the older patients (Figs 5A and 6A).
Subependymal Giant Cell Astrocytomas
Although none of our patients had surgical proof of intraventricular lesions, we saw two in seven patients with three very likely SGCAs. This is in the range of the 17% to 20% reported in other series (15, 43). Others (44–46) have already reported isolated cases of SGCA in very young infants, even before birth (47). This observation emphasizes that these tumors can evolve in utero. The fact that no patient in the series of Kingsley et al (9) had SGCA diagnosed before 3.5 years of age again reflects the more severe affliction in our neonates.
Interestingly, Menor et al (43) reported that 80% of SGCA manifestations were associated with cardiac rhabdomyomas; we saw one such association among the two patients with SGCA.
Cysts
Cystic white matter lesions have recently been proposed to be a feature of tuberous sclerosis (48). These authors discuss cystic white matter degeneration, enlarged perivascular spaces, or neuroepithelial cysts. Others have suggested that infarctions due to tuberous sclerosis–related arterial (49) or venous anomalies (50) could lead to cystic encephalopathy. The only cysts that we observed occurred in the neonate with severe hydrocephalus (Fig 4). The cause and significance of these lesions remain obscure.
Clinical Significance
Our study group was composed of neonates with severe tuberous sclerosis. All except one asymptomatic twin had serious clinical signs. It is known that mental retardation develops in 86% of patients with tuberous sclerosis who present with infantile spasms (20). On the other hand, although ultimately 78% to 90% of all patients with tuberous sclerosis will have epilepsy, and 53% of patients with tuberous sclerosis will have a learning disorder, the 4% in whom seizures develop after 16 years of age are not cognitively impaired (20, 51).
The number of tubers and the risk of retardation are positively correlated. A recent metaanalysis (10) has established that the threshold for mental retardation is around seven tubers, although an average number of 18 tubers per handicapped patient (20) and cut-offs between five (52) and 11 (43) tubers have been reported. It is evident that the early age of onset and the fact that 90% of patients with tuberous sclerosis who present with infantile spasms will continue to have frequently pharmacoresistant seizures are important pathogenetic factors (10, 20, 21). Thus, patients with uncontrollable seizures and well-localized epileptogenic foci in whom a diagnosis is made early in life may benefit from accelerated epilepsy surgery (53).
The neuroradiologic tuber count is, thus, a statistical predictor of outcome and allows for a cautious individual prognosis. However, genetic counseling is difficult, owing to a high rate of spontaneous mutations and mosaicisms (5, 54). Adding to the difficulty of parental counseling are the findings in a recent analysis that suggest that sporadically occurring tuberous sclerosis, like all that in our group, is often more severe than familial disease (3).
Conversely, cardiac rhabdomyomas, with a rate of occurrence of 50% (55), spontaneously regress within the first 6 years of life (12, 56). Other visceral hamartomas develop after 2 to 3 years of age (57). The presence of renal angiomyolipomas, renal cysts, and renal carcinoma, found in 49%, 32%, and 2.2.% of patients with tuberous sclerosis, respectively (58), positively correlates with age. These entities can be screened and effectively treated, thus preventing tumor hemorrhage or renal failure (51, 59). Pulmonary lymphangioleiomyomatosis occurs in 1% of patients, all female (60), and about half of these have benign courses or can be controlled by hormone therapy (61); the others may require lung transplants (62). Thus, manifestations and symptoms of cerebral tuberous sclerosis are the most important factors that determine clinical outcome.
Imaging Technique
For successful imaging of cerebral lesions in neonates and young infants with tuberous sclerosis, T1-weighted sequences in two orthogonal planes are most important. Section thickness should be 4 mm or less, and the gap as small as possible. If available, a volumetric T1-weighted sequence should be obtained and reformatted for optimal assessment of the brain. White matter anomalies and subependymal nodules were best appreciated on axial and sagittal T1-weighted images, probably because these planes allow maximal visualization of the longitudinal extent of most white matter anomalies and of the subependymal nodules of the temporal horns. An axial T2-weighted sequence serves to exclude other causes of T1 shortening, such as hemorrhage, but is less important for assessing the number and extent of tuberous sclerosis lesions. In our group, contrast material did not add to the radiologic work-up.
Other groups have reported that fluid-attenuated inversion-recovery (FLAIR) sequences (63) and magnetization transfer (64, 65) helped depict more tubers and white matter anomalies than did conventional SE images in older children and adults, facilitated differentiation between subependymal nodules and SGCA, and minimized the use of contrast material. In neonates and young infants, however, both techniques are of limited value: magnetization transfer because it diminishes T1 effects from myelin (which are not present in neonates), and FLAIR because it relies on T2 contrast, which is less effective in depicting brain anomalies in these patients.
Differential Diagnoses
Although the complete constellation of intracranial tuberous sclerosis findings in early infancy is quite characteristic, the presence of a solitary or a few hyperintense lesions can pose a diagnostic problem. The most misleading and, in terms of clinical implications, most important differential diagnosis is subacute hemorrhage, the more so since both conditions frequently are found in neonates with seizures. CT cannot always solve that dilemma, as, owing to the high water content of the unmyelinated brain, even noncalcified tuberous sclerosis lesions can be hyperdense (16). Additionally, the inherent high water content reduces the visibility of edema as an auxiliary sign. Viewing T1-weighted images in multiple planes to look for radiation from the ventricular surface can be useful in differentiating the two. Parenchymal lesions, such as white matter anomalies and tubers, if appropriately round or diffuse, may be difficult to detect until the time of signal reversal at about 6 months; again, looking for radiation of T1 shortening from a suspected lesion to the ventricular surface may be helpful. Subependymal nodules can mimic germinal matrix hemorrhage; however, the known involution of the germinal matrix after approximately 32 postconceptional weeks makes this a problem primarily in premature infants, who represent a vast minority of cases. The identification of associated linear parenchymal foci of T1 shortening radiating perpendicular to the ventricle will help to establish the proper diagnosis. If there are several parenchymal foci, hemorrhagic emboli might be considered; these are unlikely to be linear or transmantle in configuration. Linear white matter anomalies can be mistaken for thrombosed transmedullary veins (66).
Another possible differential diagnosis is congenital infection. In particular, ependymal calcifications and cortical malformations can be seen with congenital cytomegalovirus infections (67); the affected infants might also have infantile spasms. However, patients with congenital cytomegalovirus typically have a diffuse petechial rash and hepatosplenomegaly, which would help to differentiate them from patients with tuberous sclerosis. Subependymal nodular heterotopia (68–70) may be confused with subependymal nodules, although heterotopias should always be isointense with gray matter and never enhance with contrast material. Solitary tubers may occur in 3% of tuberous sclerosis cases (38) and thus may be confused with cortical dysplasias of other causes (33, 34), such as transmantle dysplasias (18) or focal subcortical heterotopia (31). There is not only a neuroradiologic but also a considerable histopathologic overlap among these entities (71) owing to the fact that different incidents at the same point of embryological evolution or the same incident at different points in time may bring about similar or different developmental anomalies, further varying with location or extent of damage (36). The situation may be further confounded by somatic mosaicism (36, 54).
Conclusion
Early imaging (before age 3 months) in a small series of patients with tuberous sclerosis and infantile spasms revealed severely afflicted brains with more white matter anomalies, subependymal nodules, SGCA, transmantle dysplasias, left-hemispheric lesions, and temporal lesions, but with fewer tubers than found in other series that consisted of mostly older patients. MR imaging revealed a great number of brain anomalies, as they were hyperintense relative to immature white matter on T1-weighted sequences and hypointense on T2-weighted sequences. White matter anomalies, subependymal nodules, and SGCA seem to be detected better in neonates than in children older than 6 months of age. Although detection of cortical tubers is more difficult than it is after myelination is complete, T1 hyperintensity makes tubers that extend into the subcortical white matter quite conspicuous against the hypointense unmyelinated white matter. These findings argue against delaying MR imaging until the infants are older. As myelination proceeds, the signal intensities of gray and white matter start to reverse at approximately 6 months of age, causing a period of further diminished sensitivity, which ultimately results in the mature relative signal intensity of the malformations. A future study should determine the precise timing of this transition.
Footnotes
Address reprint requests to A. James Barkovich, MD, Department of Radiology, Neuroradiology Section, L 371, University of California, San Francisco, 505 Parnassus Ave, San Francisco, CA 94143.
References
- 1.Gomez MR. History. In: Tuberous Sclerosis. 2nd ed. New York: Raven Press; 1988:1–9
- 2.Roach ES, Smith M, Huttenlocher P, Bhat M, Alcorn D, Hawley L. Diagnostic criteria, tuberous sclerosis complex: report of the Diagnostic Criteria Committee of the National Tuberous Sclerosis Association. J Child Neurol 1992;7:221-224 [DOI] [PubMed] [Google Scholar]
- 3.Jones AC, Daniells CE, Snell RG,, et al. Molecular genetic and phenotypic analysis reveals differences between TSC1 and TSC2 associated familial and sporadic tuberous sclerosis. Hum Mol Genet 1997;6:2155-2161 [DOI] [PubMed] [Google Scholar]
- 4.Haines JL, Amos J, Attwood J,, et al. Genetic heterogeneity in tuberous sclerosis: study of a large collaborative dataset. Ann N Y Acad Sci 1991;615:256-264 [DOI] [PubMed] [Google Scholar]
- 5.Sepp T, Yates JR, Green AJ. Loss of heterozygosity in tuberous sclerosis hamartomas. J Med Genet 1996;33:962-964 [DOI] [PMC free article] [PubMed] [Google Scholar]
- 6.van Slegtenhorst M, de Hoogt R, Hermans C,, et al. Identification of the tuberous sclerosis gene TSC1 on chromosome 9q34. Science 1997;277:805-808 [DOI] [PubMed] [Google Scholar]
- 7.Osborne JP, Fryer A, Webb D. Epidemiology of tuberous sclerosis. Ann N Y Acad Sci 1991;615:125-127 [DOI] [PubMed] [Google Scholar]
- 8.Editorial Progress in tuberous sclerosis. Lancet 1990;336:598-599 [PubMed] [Google Scholar]
- 9.Kingsley DP, Kendall BE, Fitz CR. Tuberous sclerosis: a clinicoradiological evaluation of 110 cases with particular reference to atypical presentation. Neuroradiology 1986;28:38-46 [DOI] [PubMed] [Google Scholar]
- 10.Goodman M, Lamm SH, Engel A, Shepherd CW, Houser OW, Gomez MR. Cortical tuber count: a biomarker indicating neurologic severity of tuberous sclerosis complex. J Child Neurol 1997;12:85-90 [DOI] [PubMed] [Google Scholar]
- 11.Griffiths PD, Martland TR. Tuberous sclerosis complex: the role of neuroradiology. Neuropediatrics 1997;28:244-252 [DOI] [PubMed] [Google Scholar]
- 12.Christophe C, Bartholome J, Blum D,, et al. Neonatal tuberous sclerosis. US, CT, and MR diagnosis of brain and cardiac lesions. Pediatr Radiol 1989;19:446-448 [DOI] [PubMed] [Google Scholar]
- 13.Dawson KL, Moore SG, Ariagno RL. Neonatal tuberous sclerosis: magnetic resonance appearance of subependymal tubers. Australas Radiol 1990;34:247-248 [DOI] [PubMed] [Google Scholar]
- 14.Quint DJ. Tuberous sclerosis: CT and MR findings. AJNR Am J Neuroradiol 1991;12:806-807 [PMC free article] [PubMed] [Google Scholar]
- 15.Braffman BH, Bilaniuk LT, Naidich TP,, et al. MR imaging of tuberous sclerosis: pathogenesis of this phakomatosis, use of gadopentetate dimeglumine, and literature review. Radiology 1992;183:227-238 [DOI] [PubMed] [Google Scholar]
- 16.Altman NR, Purser RK, Post MJ. Tuberous sclerosis: characteristics at CT and MR imaging. Radiology 1988;167:527-532 [DOI] [PubMed] [Google Scholar]
- 17.Pellizzi GB. Contributo allo studio dell'idiozia: rivisita sperimentale di freniatria e medicina legale delle alienazioni mentali. Riv Sper Freniat 1901;27:265-269 [Google Scholar]
- 18.Barkovich AJ, Kuzniecky RI, Bollen AW, Grant PE. Transmantle dysplasia: a specific malformation of cortical development. Neurology 1997;49:1048-1052 [DOI] [PubMed] [Google Scholar]
- 19.Gomez MR, Kuntz NL, Westmoreland BF. Tuberous sclerosis, early onset of seizures, and mental subnormality: study of discordant homozygous twins. Neurology 1982;32:604-611 [DOI] [PubMed] [Google Scholar]
- 20.Shepherd CW, Houser OW, Gomez MR. MR findings in tuberous sclerosis complex and correlation with seizure development and mental impairment. AJNR Am J Neuroradiol 1995;16:149-155 [PMC free article] [PubMed] [Google Scholar]
- 21.Jozwiak S, Goodman M, Lamm SH. Poor mental development in patients with tuberous sclerosis complex: clinical risk factors. Arch Neurol 1998;55:379-384 [DOI] [PubMed] [Google Scholar]
- 22.Barkovich AJ, Lyon G, Evrard P. Formation, maturation, and disorders of white matter. AJNR Am J Neuroradiol 1992;13:447-461 [PMC free article] [PubMed] [Google Scholar]
- 23.Barkovich AJ, Gressens P, Evrard P. Formation, maturation, and disorders of brain neocortex. AJNR Am J Neuroradiol 1992;13:423-446 [PMC free article] [PubMed] [Google Scholar]
- 24.Nixon JR, Miller GM, Okazaki H, Gomez MR. Cerebral tuberous sclerosis: postmortem magnetic resonance imaging and pathologic anatomy. Mayo Clin Proc 1989;64:305-311 [DOI] [PubMed] [Google Scholar]
- 25.Houser OW, Gomez MR. CT and MR imaging of intracranial tuberous sclerosis. J Dermatol 1992;19:904-908 [DOI] [PubMed] [Google Scholar]
- 26.Bolton PF, Griffiths PD. Association of tuberous sclerosis of temporal lobes with autism and atypical autism. Lancet 1997;349:392-395 [DOI] [PubMed] [Google Scholar]
- 27.Seri S, Cerquiglini A, Pisani F, Michel CM, Pascual Marqui RD, Curatolo P. Frontal lobe epilepsy associated with tuberous sclerosis: electroencephalographic-magnetic resonance image fusioning. J Child Neurol 1998;13:33-38 [DOI] [PubMed] [Google Scholar]
- 28.Hayashi Y, Yoshimura K, Nakae Y, Nara T, Hamada R, Maekawa K. Neonatal tuberous sclerosis with heart and brain tumors. Acta Paediatr Jpn 1990;32:571-574 [DOI] [PubMed] [Google Scholar]
- 29.Miyazaki M, Hashimoto T, Omura H,, et al. Infantile spasms with predominantly unilateral cerebral abnormalities. Neuropediatrics 1994;25:325-330 [DOI] [PubMed] [Google Scholar]
- 30.Gaily EK, Shewmon DA, Chugani HT, Curran JG. Asymmetric and asynchronous infantile spasms. Epilepsia 1995;36:873-882 [DOI] [PubMed] [Google Scholar]
- 31.Barkovich AJ, Kuzniecky RI. Neuroimaging of focal malformations of cortical development. J Clin Neurophysiol 1996;13:481-494 [DOI] [PubMed] [Google Scholar]
- 32.Regan T. Neuropathology. In: Gomez M, ed. Tuberous Sclerosis. 2nd ed. New York: Raven Press; 1988:63–74
- 33.Palmini A, Andermann F, Olivier A,, et al. Neuronal migration disorders: a contribution of modern neuroimaging to the etiologic diagnosis of epilepsy. Can J Neurol Sci 1991;18:580-587 [DOI] [PubMed] [Google Scholar]
- 34.Farrell MA, DeRosa MJ, Curran JG,, et al. Neuropathologic findings in cortical resections (including hemispherectomies) performed for the treatment of intractable childhood epilepsy. Acta Neuropathol 1992;83:246-259 [DOI] [PubMed] [Google Scholar]
- 35.Barkovich AJ, Kuzniecky RI, Dobyns WB, Jackson GD, Becker LE, Evrard P. A classification scheme for malformations of cortical development. Neuropediatrics 1996;27:59-63 [DOI] [PubMed] [Google Scholar]
- 36.Norman MG, McGillivray BC, Kalousek DK, Hill A, Poskitt KJ. Neuronal migration disorders and cortical dysplasias, part 2: cortical dysplasias and ectomesoderma syndromes. In: Norman MG, McGillivray BC, Kalousek DK, Hill A, Poskitt KJ, eds. Congenital Malformations of the Brain. New York: Oxford University Press; 1995:279–307
- 37.Sugita K, Itoh K, Takeuchi Y,, et al. Tuberous sclerosis: report of two cases studied by computer-assisted cranial tomography within one week after birth. Brain Dev 1985;7:438-443 [DOI] [PubMed] [Google Scholar]
- 38.DiPaolo D, Zimmerman RA. Solitary cortical tubers. AJNR Am J Neuroradiol 1995;16:1360-1364 [PMC free article] [PubMed] [Google Scholar]
- 39.Wilms G, van Wijck E, Demaerel PH, Smet M-H, Plets C, Brucher JM. Gyriform calcifications in tuberous sclerosis simulating the appearance of Sturge-Weber disease. AJNR Am J Neuroradiol 1992;13:295-297 [PMC free article] [PubMed] [Google Scholar]
- 40.Barkovich AJ. Comment: tuberous sclerosis: CT and MR findings. AJNR Am J Neuroradiol 1991;12:807. [PMC free article] [PubMed] [Google Scholar]
- 41.Kucharczyk W, Henkelman RM. Visibility of calcium on MR and CT: can MR show calcium that CT cannot? AJNR Am J Neuroradiol 1994;15:1145-1148 [PMC free article] [PubMed] [Google Scholar]
- 42.Henkelman RM, Watts JF, Kucharczyk W. High signal intensity in MR images of calcified brain tissue. Radiology 1991;179:199-206 [DOI] [PubMed] [Google Scholar]
- 43.Menor F, Marti-Bonmati L, Mulas F, Poyatos C, Cortina H. Neuroimaging in tuberous sclerosis: a clinicoradiological evaluation in pediatric patients. Pediatr Radiol 1992;22:485-489 [DOI] [PubMed] [Google Scholar]
- 44.Ramenghi LA, Verrotti A, Domizio S, Di Rocco C, Morgese G, Sabatino G. Neonatal diagnosis of tuberous sclerosis. Childs Nerv Syst 1996;12:121-123 [DOI] [PubMed] [Google Scholar]
- 45.Stricker T, Zuerrer M, Martin E, Boesch C. MRI of two infants with tuberous sclerosis. Neuroradiology 1991;33:175-177 [DOI] [PubMed] [Google Scholar]
- 46.Tien RD, Hesselink JR, Duberg A. Rare subependymal giant-cell astrocytoma in a neonate with tuberous sclerosis. AJNR Am J Neuroradiol 1990;11:1251-1252 [PMC free article] [PubMed] [Google Scholar]
- 47.Sonigo P, Elmaleh A, Fermont L, Delezoide AL, Mirlesse V, Brunelle F. Prenatal MRI diagnosis of fetal cerebral tuberous sclerosis. Pediatr Radiol 1996;26:1-4 [DOI] [PubMed] [Google Scholar]
- 48.Van Tassel P, Cure JK, Holden KR. Cystlike white matter lesions in tuberous sclerosis. AJNR Am J Neuroradiol 1997;18:1367-1373 [PMC free article] [PubMed] [Google Scholar]
- 49.Gomez MR. Strokes in tuberous sclerosis: are rhabdomyomas a cause? Brain Dev 1989;11:14-19 [DOI] [PubMed] [Google Scholar]
- 50.Barkovich AJ. Abnormal vascular drainage in anomalies of neuronal migration. AJNR Am J Neuroradiol 1988;9:939-942 [PMC free article] [PubMed] [Google Scholar]
- 51.Webb DW, Fryer AE, Osborne JP. Morbidity associated with tuberous sclerosis: a population study. Dev Med Child Neurol 1996;38:146-155 [DOI] [PubMed] [Google Scholar]
- 52.Jambaque I, Cusmai R, Curatolo P, Cortesi F, Perrot C, Dulac O. Neuropsychological aspects of tuberous sclerosis in relation to epilepsy and MRI findings. Dev Med Child Neurol 1991;33:698-705 [DOI] [PubMed] [Google Scholar]
- 53.Bebin EM, Kelly PJ, Gomez MR. Surgical treatment for epilepsy in cerebral tuberous sclerosis. Epilepsia 1993;34:651-657 [DOI] [PubMed] [Google Scholar]
- 54.Yates JR, van Bakel I, Sepp T,, et al. Female germline mosaicism in tuberous sclerosis confirmed by molecular genetic analysis. Hum Mol Genet 1997;6:2265-2269 [DOI] [PubMed] [Google Scholar]
- 55.Blossom HJ. Tuberous sclerosis in early infancy: a case report. J Fam Pract 1993;36:344-346 [PubMed] [Google Scholar]
- 56.DiMario FJ Jr, Diana D, Leopold H, Chameides L. Evolution of cardiac rhabdomyoma in tuberous sclerosis complex. Clin Pediatr (Phila) 1996;35:615-619 [DOI] [PubMed] [Google Scholar]
- 57.Barkovich AJ. The phakomatoses: tuberous sclerosis. In: Pediatric Neuroimaging. 2nd ed. New York: Raven Press; 1995:296–304
- 58.Cook JA, Oliver K, Mueller RF, Sampson J. A cross sectional study of renal involvement in tuberous sclerosis. J Med Genet 1996;33:480-484 [DOI] [PMC free article] [PubMed] [Google Scholar]
- 59.Schillinger F, Montagnac R. Chronic renal failure and its treatment in tuberous sclerosis. Nephrol Dial Transplant 1996;11:481-485 [PubMed] [Google Scholar]
- 60.Muir TE, Leslie KO, Popper H,, et al. Micronodular pneumocyte hyperplasia. Am J Surg Pathol 1998;22:465-472 [DOI] [PubMed] [Google Scholar]
- 61.Castro M, Shepherd CW, Gomez MR, Lie JT, Ryu JH. Pulmonary tuberous sclerosis. Chest 1995;107:189-195 [DOI] [PubMed] [Google Scholar]
- 62.Boehler A, Speich R, Russi EW, Weder W. Lung transplantation for lymphangioleiomyomatosis. N Engl J Med 1996;335:1275-1280 [DOI] [PubMed] [Google Scholar]
- 63.Takanashi J, Sugita K, Fujii K, Niimi H. MR evaluation of tuberous sclerosis: increased sensitivity with fluid-attenuated inversion recovery and relation to severity of seizures and mental retardation. AJNR Am J Neuroradiol 1995;16:1923-1928 [PMC free article] [PubMed] [Google Scholar]
- 64.Girard N, Zimmerman RA, Schnur RE, Haselgrove J, Christensen K. Magnetization transfer in the investigation of patients with tuberous sclerosis. Neuroradiology 1997;39:523-528 [DOI] [PubMed] [Google Scholar]
- 65.Jeong MG, Chung TS, Coe CJ, Jeon TJ, Kim DI, Joo AY. Application of magnetization transfer imaging for intracranial lesions of tuberous sclerosis. J Comput Assist Tomogr 1997;21:8-14 [DOI] [PubMed] [Google Scholar]
- 66.Iwasaki S, Nakagawa H, Kichikawa K,, et al. MR and CT of tuberous sclerosis: linear abnormalities in the cerebral white matter. AJNR Am J Neuroradiol 1990;11:1029-1034 [PMC free article] [PubMed] [Google Scholar]
- 67.Barkovich AJ, Lindan CE. Congenital cytomegalovirus infection of the brain: Imaging analysis and embryologic considerations. AJNR Am J Neuroradiol 1994;15:703-715 [PMC free article] [PubMed] [Google Scholar]
- 68.DiMario FJ Jr, Cobb RJ, Ramsby GR, Leicher C. Familial band heterotopias simulating tuberous sclerosis. Neurology 1993;43:1424-1426 [DOI] [PubMed] [Google Scholar]
- 69.Jardine PE, Clarke MA, Super M. Familial bilateral periventricular nodular heterotopia mimics tuberous sclerosis. Arch Dis Child 1996;74:244-246 [DOI] [PMC free article] [PubMed] [Google Scholar]
- 70.Barkovich AJ. Subcortical heterotopia: a distinct clinicoradiologic entity. AJNR Am J Neuroradiol 1996;17:1315-1322 [PMC free article] [PubMed] [Google Scholar]
- 71.Vinters HV, De Rosa MJ, Farrell MA. Neuropathologic study of resected cerebral tissue from patients with infantile spasms. Epilepsia 1993;34:772-779 [DOI] [PubMed] [Google Scholar]