Abstract
BACKGROUND AND PURPOSE: To our knowledge, no large-scale studies comparing the accuracy of CT angiography (CTA) to intraarterial digital subtraction angiography (DSA) of intracranial stenosis have been reported. We attempted to determine the diagnostic value of intracranial CT angiography (CTA) of normal vasculature and variants as well as of stenoocclusive disease.
METHODS: One-hundred and twelve patients underwent CTA and intraarterial angiography, and 2205 vascular segments were examined to ascertain presence, visibility, and degree of arterial stenoses (n = 105) as well as anatomic variants. Source, maximum intensity projection (MIP), and MIP-generated multiplanar reformatted (MPR) images were evaluated.
RESULTS: All 55 anatomic variants were identified correctly. Visibility of small-vessel segments was increased from 75% to 83% by using source images. MPR was helpful in differentiating distal vertebral hypoplasia from stenosis and in overcoming artifacts. All 43 occlusive segments were graded correctly (sensitivity = 100%, predictive value = 93.4%) as follows: severely stenotic ([n = 23], sensitivity = 78%, predictive value = 81.8%); moderately stenotic ([n = 36], sensitivity = 61%, predictive value = 84.6%); and mildly stenotic ([n = 3], sensitivity = 66%, predictive value = 28%). Normal segments (n = 2100) had a sensitivity of 99.5%, and CTA evinced a specificity of 99% for detecting stenoocclusive disease. Approximately one-third of wrong assessments were related to the petrous segment of the carotid artery.
CONCLUSION: CTA with double-detector technology and advanced postprocessing algorithms, including MPR, is about as reliable as MRA in depicting the vasculature of the anterior and posterior circulation and in grading intracranial stenoocclusive lesions, with the exception of the petrous segment of the carotid artery. CTA might be superior to MRA in the evaluation of poststenotic low-flow segments.
Spiral CT angiography (CTA) is a new diagnostic tool that has proved its usefulness in depicting intracranial aneurysms (1, 2) as well as carotid artery (3) and renal artery stenoses (4). Earlier CTA studies of intracranial vasculature (5) covered no more than 6 cm, which is not always a sufficient range for visualizing the anterior and posterior circulation with one examination. Double-detector technology overcomes this problem, giving a coverage of 12 cm at 1.3-mm collimation and pitch 1.
To our knowledge no large-scale studies have yet been reported comparing the accuracy of CTA to intraarterial DSA in the assessment of intracranial stenosis. Maximum intensity projection (MIP) is a common rendering technique used to obtain an “angiographic” display of vascular anatomy (6). Nonetheless, MIP has limitations. Degree of vascular stenosis on MIP images depends on the selected window center values (4), and vessels can become blurred depending on viewing plane (5,7). To minimize these problems, we included the axial raw data in the examination as well as a new tool called “MasterCut” to analyze MIP images. MasterCut enables the examination of vessels with multiplanar reformatting (MPR) relating the course of the vessel, as defined by MIP, to a two-dimensional (2D) MPR. Spiral CTA is a minimally invasive technique competing with MR angiography (MRA). To discuss the clinical relevance of CTA, a comparison with MRA is necessary, and we made the design of this study comparable to major investigations concerning MRA of intracranial stenosis (8, 9).
Our study was designed 1) to demonstrate the ability of double-detector CTA technology to depict the normal vascular anatomy in the vertebrobasilar system and anterior system with one examination, 2) to evaluate the usefulness of axial source data in depicting small vessels, 3) to compare the accuracy of CTA with MIP imaging to DSA in quantifying stenoocclusive disease, and 4) to assess whether 2D reconstructions improve the accuracy of MIP results in the detection and grading of stenosis.
Methods
Patients
We retrospectively studied the imaging findings in 112 patients with suspected cerebrovascular disease who had undergone selective DSA after, or, in two cases, before CTA. Sixty-two patients experienced cerebral infarction or cerebral transient ischemic attack, and 50 presented with suspected aneurysms. The mean interval between DSA and CTA was 5 days. Informed consent for all examinations was obtained from every patient.
Intraarterial Digital Subtraction Angiography (DSA)
Selective cerebral angiography of at least two vessels was performed on a Polytron system (Siemens, Erlangen, Germany), using a 1024 × 1024 matrix and a 30-cm-diameter image intensifier, via the femoral route.
Spiral CT Angiography
Helical CT data sets of all patients were obtained on a CT Twin Flash Scanner (Elscint, Haifa, Israel), using 1.3-mm collimation, a 1.3-mm/s table speed (pitch 1), and 0.6-mm reconstruction intervals. Scanning time ranged from 40 to 60 seconds. Other parameters were 120 kV, 210 mAs, and a 360° reconstruction algorithm.
With these parameters, double-detector technology enables a coverage of 12 cm (10). Scanning began above the atlas vertebra and continued cranially up to the centrum semiovale. Twenty-five seconds before starting, 120 mL of nonionic contrast material (270 mg I/mL; Imagopaque, Nycomed, Oslo, Norway) was injected intravenously at the rate of 2.0 mL/s. One examination produced 160–180 images that were transferred to an independent OmniPro imaging workstation (Elscint, Haifa; based on a Silicon Graphics [Mountain View, Calif]) platform.
CT Data Postprocessing
The data sets were postprocessed with an MIP algorithm followed by two bone editing (removal of bone or other high-density tissue from image) algorithms. The first semiautomatic algorithm was based on defining the tissue to be removed by setting the highlight window combined with a tool called “seed” planting. Seed planting defines an area by identifying adjacent voxels of the same defined density range. The second algorithm was based on manual contour drawing either on axial source or MIP images, creating a freehand user-defined region of interest (ROI). With this technique, removal of all structures blocking the view of the desired anatomy was possible within 10 minutes, enabling the assessment of the vasculature of the posterior fossa, the circle of Willis, and the more cranial vessels. After bone editing, the MIP data set was narrowed further by a user-defined ROI that eliminated tissue concealing desired anatomy. To reduce vessel overlapping and background noise, the MIP data set was reduced and various free, hand-drawn volumes of interest were created (targeted MIP) to encompass vertebrobasilar arteries (coronal view) with projections at various angles around the z-axis, the circle of Willis (axial view), the supratentorial circulation (axial view), the anterior circulation (coronal view), and special projections for optimal visualization of the desired vascular segment.
In cases of vessels with stenotic segments, or if the displayed MIP image did not clearly depict the desired vessel, an additional evaluation based on the MasterCut tool was performed. MasterCut produces a curved 2D MPR (ie, a plane passing through the desired vessel) by drawing a line over the vessel as seen on the MIP image. By using different suitable MIP views, it is possible to follow the course of vessels in coiling or questionable delineation. The MasterCut tool creates a panoramic image by spreading a curved surface. A swivel function on the MIP image can generate new wide-range views from different directions.
CTA assessments can be performed by a radiologist in approximately 15 to 20 minutes. The user interface of the OmniPro workstation is very similar to that of Microsoft Windows (Microsoft Corp., Seattle, WA). For a radiologist with basic experience of window applications, it would take about 5 to 10 hours to learn to use the workstation and to perform CTA examinations.
Evaluation and Data Analysis
The DSA images were reviewed independently by two radiologists who were blinded to all clinical information. In seven cases the reviewers disagreed, and the final assessment of the degree of stenosis in these cases was made by consensus. The CTA data sets were reviewed independently by two additional radiologists who were blinded to the results of the DSA examinations. During the first session, MIP images were evaluated at the workstation by observer-defined projections. In the second session, the data sets were reevaluated at the workstation with axial source images obtained by interactive cine display to assess the visibility of small vessels and with MasterCut to verify and evaluate intracranial stenosis.
Visibility of Intracranial Vessels
The visibility (ie, yes/no, hypoplastic/hyperplastic) of the following arterial segments and anatomic variants was noted: anterior cerebral artery (A1 and A2 segments); anterior communicating artery (AcomA); distal internal carotid artery; middle cerebral artery (MCA, M1 and M2 segments); posterior communicating artery (PcomA); posterior cerebral artery (PCA, P1 and P2 segments); basilar artery (BA); superior cerebellar artery (SCA); posterior cerebellar artery (PICA); intracranial vertebral artery; hypoplastic A1; hypoplastic P1; hypoplastic intracranial vertebral artery; fetal PCA, and doubled SCA. MIP images were compared with the combined evaluation (MIP plus source images using interactive cine mode).
Stenosis Quantification
The degree of intracranial stenosis on DSA images was expressed as the percentage of diameter reduction on the projection that showed the greatest extent of stenosis. The minimal residual diameters and nearby normal vessel diameters were measured on images with a ×10 precision scale magnifier of 0.1-mm scale. Stenoses were categorized according to the following scale: normal (0–9%); mild (10–29%); moderate (30–69%); severe (70–99%); and occluded (no flow detected). Stenosis on MIP images was measured by visual inspection.
Results
Normal Vascular Anatomy
Of the 112 CT angiograms correlated with DSA, six were slightly impaired by technical artifacts caused by a prolonged circulation time in four cases and patient movement in two. All major vessels were correctly identified. Examination of the MCA revealed 100% of segments ranging from M1 to M3, and 80% of M4 segments. Examination of the PCA revealed 100% of segments ranging from P1 to P3, and 50% of P4 segments. The results for the depiction of normal intracranial arterial vasculature are presented in Table 1. Superimposition of veins and other structures, even in the posterior fossa, was effectively surmounted by targeted MIP (Fig 1). Visibility of small vessels is improved by using source images. Of 703 arterial segments revealed by DSA, 527 (75%) were seen with targeted MIP alone, and 584 (83%) were seen on source images. The measurement of vessel diameters has shown that arteries with diameters less than 0.6 mm cannot be shown by CTA, vessels with diameters between 0.6 mm and 0.7 mm can be identified on source images, and vessels with greater than 0.8 mm diameters are generally visible on targeted MIPs. In 10 cases, the AcomA was visible on the CT angiogram but not on the digital subtraction angiogram (in cases of DSA performed without compression of the contralateral carotid artery).
TABLE 1:
Visibility of Intracranial Arteries and Anatomic Variants
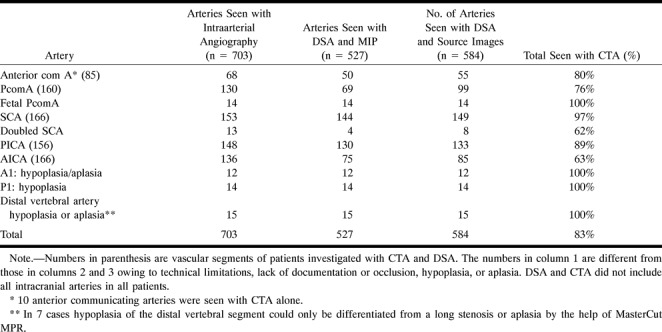
fig 1.
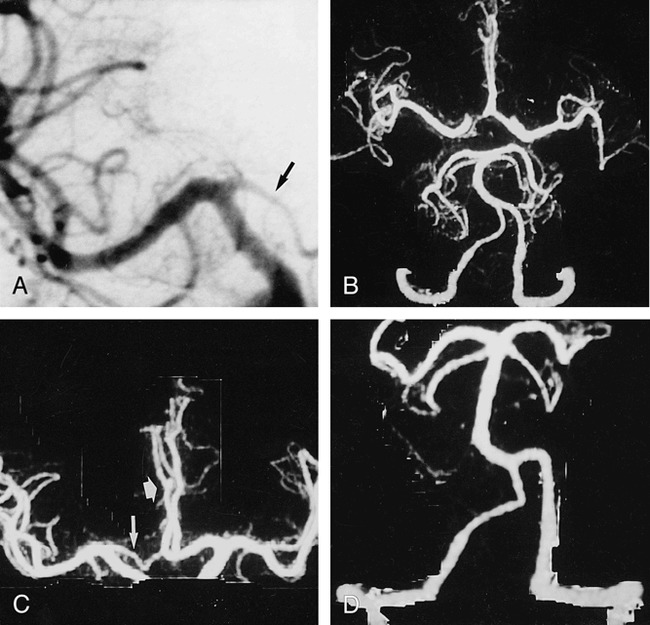
CTA with targeted MIP was performed in a 48-year-old man with surgically confirmed pericallosal arterial aneurysm and hypoplasia of A1 segment.
A, Anteroposterior (AP) arteriogram of right carotid artery shows hypoplasia of A1 segment (arrow).
B, CTA with targeted MIP reveals extended coverage of CTA with double-detector technology. Complete arterial volume is shown by MIP, ranging from the atlas loop to the pericallosal artery. By drawing a freehand line on any selected projection of the volume, targeted MIPs can be created (C and D), avoiding superimposition of vessels.
C, Targeted MIP of anterior circulation clearly shows hypoplasia of A1 segment (long arrow) as well as aneurysm (short arrow).
D, Targeted MIP of posterior circulation shows normal vasculature.
Anatomic Variants
The most frequently seen variant was hypoplasia of the intracranial vertebral segment, which was present in 15 cases. In 12 segments it was identified on MIP alone, and in two cases with the help of the source images. One segment of approximately 0.5-mm diameter remained invisible on the CT angiogram. The fetal type of the PcomA was identified correctly on MIP images in all 14 segments where it occurred. All 12 segments with A1 hypoplasia were correctly identified during CTA. A doubled SCA was present in 13 cases and identified correctly on MIP and source images in 8 subjects.
Stenoocclusive Lesions
A total of 2205 arterial segments was reviewed. One-hundred and five stenoocclusive lesions were seen with DSA. Table 2 presents location and Table 3 grading of the evaluated stenoses. MasterCut MPR improved the ability to detect and grade stenoses in 21 cases (19%). It was most helpful in confirming stenosis of the distal vertebral segment (Fig 2) and in differentiating it from severe hypoplasia. The rate of complete agreement between DSA and CTA concerning the degree of stenosis was 70% on the basis of MIP images alone. Combining MIP images and source images improved the consistency of findings to 80%. Stenosis grading was overestimated in 13 cases and underestimated in five cases by 1° (Table 4). The bulk of wrong assessments came from the carotid arteries. Nonetheless, occlusion of the petrous portion of the carotid artery was seen correctly in all cases (Fig 3). In most cases, the analysis and evaluation of source images was necessary. But the detectability of stenosis and its grading was poor and could not be improved by MasterCut MPR.
TABLE 2:
Localization of Intracranial Vessel Disease according to DSA and Evaluation with CTA
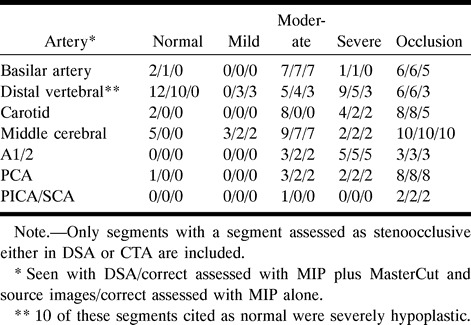
TABLE 3:
Assessment of Intracranial Stenoocclusive Disease with Intraarterial DSA and CTA

fig 2.
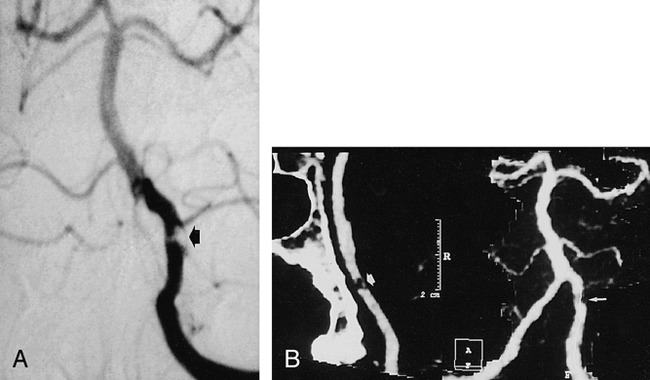
Severe stenosis of distal segment of left vertebral artery.
A, AP of left vertebral artery shows severe stenosis (arrow).
B, AP MIP of CTA (right frame) underestimates stenosis (small arrow). MasterCut MPR (arrow) shows more clearly lesion severity and exclusion of reconstruction artifact.
TABLE 4:
Results of CTA as Compared to DSA for the Evaluation of Intracranial Stenoses According to Localization
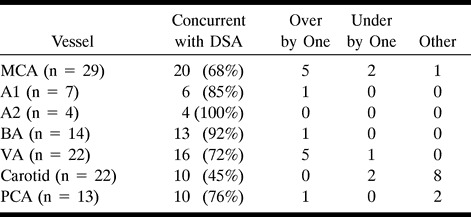
fig 3.

Partial occlusion of ICA.
A, Lateral angiogram of right ICA artery shows occlusion of cervical and petrous segments and filling of the carotid siphon and supraclinoid segments (arrow) via collateral flow from ophthalmic artery.
B, CTA with Mastercut MPR shows two-frame window. Right frame contains MIP image, and left frame contains a reformatted curved plane (panoramic image) related to white cut line drawn on the MIP image. Start of cut line is marked with asterisk. Owing to reconstruction artifacts caused by vessel contact with bone (especially with petrous segment of carotid artery), vasculature cannot be assessed reliably with MIP images (arrows) alone. The MasterCut MPR image clearly depicts occluded (broad arrows) and open (thin arrows) segments with the same accuracy as the arteriogram.
C, CTA with MIP (right) and MasterCut MPR (left) of normal left ICA. Start of the cut line (asterisk) is shown.
Similarity between CTA and DSA results is summarized in Table 4. From 2100 segments defined as normal by means of DSA, 10 were seen as slightly or severely stenotic by CTA. One was misinterpreted as occlusion. Best consistency was seen for stenoocclusive lesions of the basilar artery (92%). Ten of 35 moderate stenoses were not identified; these were all stenoses of the petrous carotid segment. Concerning all other vessels, 22 of 25 were graded correctly (Fig 4). Three of 23 high-grade stenoses were interpreted as occlusions, all others were graded correctly. From 43 occlusions, all were identified correctly by CTA (Fig 5).
fig 4.

Moderate tandem stenoses of right MCA.
A and B, AP angiogram (A) and CT angiogram (B) clearly depict stenosis grading (arrows).
fig 5.
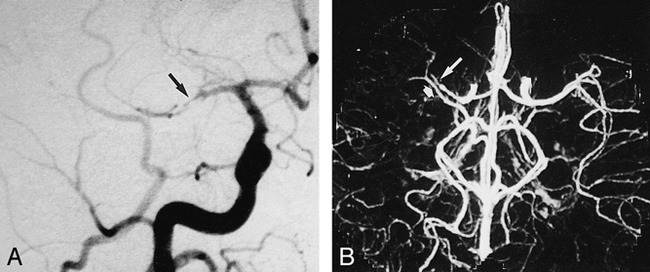
A 40-year-old patient with embolic occlusion of right MCA.
A, AP angiogram of right carotid artery.
B, Axial collapsed CTA enables good visualization of occlusion site (long arrow). Superimposition of veins causes no diagnostic problem (broad arrow).
Discussion
Clinical Importance
The warfarin-aspirin symptomatic intracranial disease study (11) showed that symptomatic patients with 50% to 99% stenosis of an intracranial artery (carotid, anterior, middle, posterior, vertebral, or basilar) benefited from treatment with warfarin compared to a control group treated with aspirin. Therefore, it is of clinical importance to depict correctly the degree of intracranial stenosis and yet avoid the risks of intraarterial angiography (12). The increased coverage of double-detector technology allows the visualization of anterior and posterior circulation with one examination. This is of clinical importance owing to the difficulty in clinically differentiating carotid from basilar artery territory stroke shortly after onset in some cases (13). The ability to reveal vessel occlusion is important in making the decision for thrombolytic therapy.
CTA with double-detector technology enables the reliable visualization of intracranial vessels exceeding a 0.7-mm diameter. Clinically important variants (A1-hypoplasia, vertebral-hypoplasia, AcomA-hypoplasia) are depicted correctly. This is consistent with an earlier study (5) that was, however, restricted to the circle of Willis.
The closest correlation between CTA and DSA results was evident in cases of occlusion and high-grade stenoses. High-grade stenoses were seen as occlusion in only three of 23 cases. These were cases of hypoplasia of the distal vertebral artery in which the vessels were not delineated and were thereby misinterpreted as occluded. Arteriosclerotic or embolic vessel occlusion was detected correctly in all cases. In cases of MCA stenoocclusive lesions, CTA enables good visualization of poststenotic vasculature important for assessing collateral blood flow (Fig 6). Nonetheless, the capacity of collateral flow cannot be determined because of CTA's inability to measure flow velocities or flow volumes. We noticed several cases with good filling of the postocclusive MCA vasculature in the acute state, but with demarcation of a large infarction in this territory the following week (Fig 7). Thus, according to our preliminary results, a predictive value of the collateral flow for the extent of the infarction, as seen with CTA, cannot be established reliably from our data. Visualization of post-stenoocclusive low-flow segments may, however, be helpful for the planning of surgical revascularization in certain cases (eg, moyamoya disease, Fig 6).
fig 6.
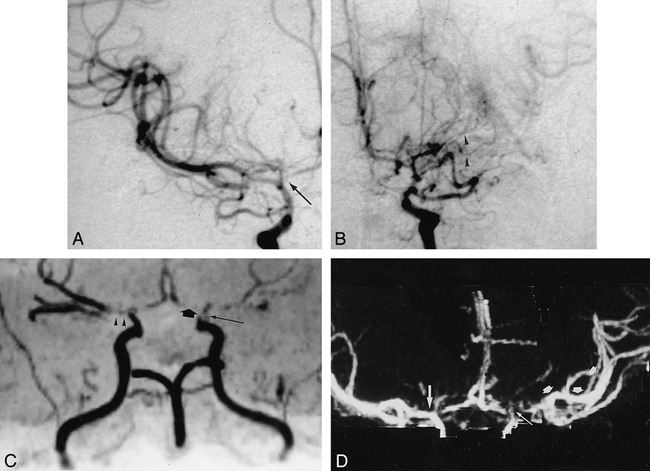
A 50-year-old woman with moyamoya disease and history of transient ischemic attacks.
A and B, AP arteriogram of the right (A) and left (B) carotid artery reveals stenoses of distal carotid artery on both sides as well as high-grade stenoses of the A1 segment (arrow) and occlusion of left M1 segment. Collateral vessels of left M1 segment (arrowheads) cannot be seen by either MRA (C) or CTA (D).
C, MRA, oblique AP view, is impaired by poststenotic signal loss, belying an occlusion of the left A1 segment (broad arrow), as well as the right M1 segment (arrowheads). The postocclusive branches of the left MCA are filled by collateral vessels, and very low flow in these segments results in poor MRA signal. Thus, postocclusive segments of the MCA (left) cannot be seen clearly. Notice stenosis of supraclinoid segment of ICA (long arrow).
D, CTA, targeted-MIP AP view, correctly shows the right M1 segment as open and presents the clearest depiction of the left distal MCA branches (arrows).
fig 7.
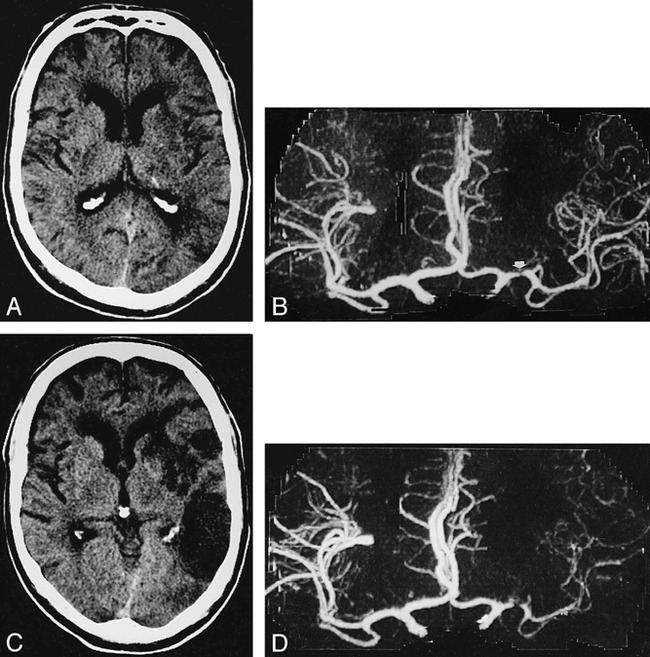
A 54-year-old man with history of aphasia and right upper extremity weakness.
A, Axial noncontrast CT 20 hours after onset of stroke shows subtle low density in left nucleus lentiformis and periinsular region.
B, AP CTA 8 hours after onset of left hemispheric stroke shows severe stenoocclusive lesion of left M1 segment (arrow) but distal MCA segments are depicted as intense (right), indicating a seemingly good collateral blood flow.
C and D, In spite of therapy with intravenous heparine, on follow-up CT 7 days later, a large area of infarction has demarcated on axial noncontrast CT (C). Same-day CTA shows a markedly reduced filling of left MCA vessels (D).
In recently published CTA studies of intracranial stenoocclusive disease (14, 15), only a few cases were correlated with DSA. Both groups did not refer to the grading of stenoses in their results, but found a good correlation concerning occlusions. Knauth et al (14) point out that CTA correctly predicted the size of 21of 34 hemispheric infarctions by identifying areas with no parenchymal enhancement. In all cases they found that unenhanced brain parenchyma during CTA were hypodense on follow-up CT images. Kuchinski et al (16) point out that carotid “T” occlusion is a predictor of fatal outcome in patients undergoing intraarterial thrombolytic therapy. According to our results, carotid “T” occlusion can be detected reliably with CTA, which emphasizes the clinical importance of CTA for the therapy of acute stroke.
Scanning Parameters
There is still no consensus about “optimal” CTA parameters (pitch, collimation, slice overlap, and reconstruction algorithm). Davros et al (17) demonstrated in a phantom study of renal artery stenoses that a collimation of 1 mm is clearly superior to that of 3 mm. This is attributable to partial volume averaging of surrounding voxels filled with lower attenuating brain tissue or CSF. For a collimation of 3 mm the authors report that vessels or stenoses of less than 3 mm diameter fade or become discontinuous because of volume averaging. In our study the same phenomenon was also observed with a collimation of 1 mm in vessels less than 0.8 mm, mostly in hypoplastic distal vertebral arteries. At the beginning of our study we reconstructed MIP images of 10 patients from 1-mm collimation at 360° as well as 180° z-axis linear interpolation. We found no improvement of diagnostic quality with 180° interpolation; the images were simply noisier. Also, image quality of MIPs from 1.5-pitch source images was inferior to 1-pitch images. Further studies are required to determine if this loss in image quality is of diagnostic importance. According to our experience, “optimal” CTA parameters for postprocessing are partly dependent on scanner and software type.
Artifacts
Automatic removal of bone structures or calcification is possible, but depending on the matrix of the software, adjacent pixels also can be affected, resulting in incorrect assessment of vessel diameter or overestimation of stenosis. The most serious problem in this regard occurs when a hypoplastic vertebral artery is located directly adjacent to bone. In this situation source slices and MasterCut MPR are required for a correct assessment (Fig 2). We do not use a slab editor technique with thresholding, but bone is removed by defining it on the axial raw slices by highlight window center and highlight window width settings. Then the bone structures, which were defined in this way, are erased from the MIP volume. The amount of time required for this is 2 to 3 minutes. All window settings mentioned above have to be found by user interaction, and can be different from patient to patient. Consequently, we cannot give concrete recommendations for other investigators. We generally used a 1270–1330 (Hounsfield units [HU]) setting for the highlight window center, and a width of 1900–2040 HU for the highlight window. Minimal experience with the OmniPro workstation is necessary for finding appropriate values, because settings are graphically displayed in color by overlaying desired tissue in the raw slices.
MPR images generated from the MasterCut tool have a 1-pixel thickness. Therefore, different cutlines can be drawn within a vessel with a diameter greater than 1 pixel. Additionally, the usefulness of MasterCut, as with other MPR-generated images, depends on the orientation of the cutline in relation to the vessel. For example, the selected cutline in Figure 2 overestimates the stenosis because the stenosis is eccentrically located. It is critical for the cutline to fit the vessel's course exactly. When the cutline runs partly outside a normal vessel, an occlusion is simulated. To overcome this problem in stenoses with complex morphology, several cutlines with different orientations (eg, coronal, oblique) are routinely generated and assessed.
Eight stenoses in our population, excluding those of the carotid artery, had calcifications that did not affect their diagnoses. A small motion of the patient's head may affect only a few slices. In one case, this resulted in an apparent discontinuity in a vessel that was misinterpreted as an embolic occlusion. These artifacts can be ruled out best by analyzing the source slices with cine mode.
Maximum Intensity Projection
The value of CTA and MRA depends very much on secondary reconstruction possibilities. Van Hoe et al (4) report problems in measuring stenosis with MIP, and point out that the appropriate window setting for evaluating of vascular stenoses depends on the real diameters of the stenotic and nonstenotic vessel segment. Because these measurements are unknown at the time of CTA, the radiologist examining MIP images cannot determine the appropriate window settings. This is also what we have experienced. Like Van Hoe et al and other investigators, we alter the window setting manually until we feel it is appropriate. This process is similar to the window setting for DSA, and is influenced by the imager's experience. In contrast to DSA, there is no available “electronic” measurement of stenoses for MIP images. Our settings for window centers ranged from 100 to 250 HU, and from 190 to 290 HU for window width. Van Hoe et al (4) conclude that combined evaluation of both MIP images and axial source images is more reliable than study of MIP images alone for assessing the severity of renal artery stenosis. Korogi et al (9) came to the same conclusion concerning the evaluation of intracranial stenoses with MRA-MIP images. They estimate that MPR images require too much effort and time for routine clinical use. Nonetheless, MasterCut is a new tool for creating MPR images in a short time, because the cut line is directly and interactively drawn on MIP images. In difficult cases it does not take more than 1 minute to create MasterCut MPRs of any vessel. According to our results, MasterCut function is superior to mere assessment of source images. In addition, on the resulting panoramic MPR images, stenoses and occlusions are much easier to identify during film-reading sessions. Brink et al (18) argue that MIP images generated from unedited or partly edited image data are inferior in depicting residual flow when compared to MPR images in which the edited volume is limited strictly to the vessel.
MR Angiography
Recently published studies of advanced MRA techniques (8, 9, 19) show that the ability of double-detector helical CTA to depict intracranial vessels of the anterior and posterior circulation as well as anatomic variants is equivalent to modern time-of-flight MRA. Regardless, MRA has limitations. Fürst et al (8) report that 20% of intracranial MR angiograms were compromised by irregular or discontinuous signal intensity in vessels close to the skull base caused by the large susceptibility gradients present in this area. Only a few cases were incorrectly assessed because of this problem, however, resulting in a superiority of MRA over CTA findings within this region.
Unresolved problems regarding the clinical use of MRA are the dependence of the MRA signal from flow velocity as well as the poststenotic signal loss owing to turbulence (20). The length of the poststenotic signal loss increases with degree of stenoses. Therefore, MR angiograms do not directly reveal high-grade stenoses; they appear as a clearly deleted segment in the vessel. On the other hand, CTA performs similarly to DSA by revealing the contrast agent within the vessel, for avoiding flow problems. Thus stenosis form is depicted more directly, which should theoretically result in a better grading of these stenoses. The current literature presents slightly better results for MRA of moderate and severe stenoses (8, 9, 19), but the validity of the results obtained from our study population was influenced by 10 cases of carotid artery stenosis in the petrous part. Further studies with more cases correlating DSA, CTA, and MRA are required.
CTA cannot determine flow direction and flow velocity, nor can it demonstrate intracranial collateral blood flow. Sensitivity of selective MRA in detecting intracranial collateral circulation via the anterior and posterior communicating artery was proved to be 95% and 97% in a study by Fürst et al (21).
Conclusion
CTA can be performed within minutes, which is clinically useful for assessing patients in critical condition. It is less affected by patient motions than is MRA. Therefore, we use CTA predominately for emergency examinations because it is effective in identifying acute occlusions of intracranial vessels and in controlling the success of thrombolytic therapy of the middle cerebral artery as well as the vertebrobasilar arteries. In several follow-up examinations, the success of intraarterial and intravenous thrombolytic therapy could be demonstrated. Furthermore, CTA may be superior to TOF-MRA in depicting arterial segments of very low flow that may be present postocclusively or poststenotically in the MCA as well as in the basilar artery. The weak point of CTA, the poor grading of stenosis in the petrous portion of the carotid artery, may be solved in the near future by subtraction CTA (22). So far we agree with Brant-Zawadzki (23) that CTA “still must take second place” if advanced MR technology is available. But CTA with double-detector technology is a serious alternative that might be better under certain circumstances. Soon the choice may depend on the resources of each institution.
Footnotes
Address reprint requests to Dr. Bernd Skutta, Institut für Diagnostische und Interventionelle Radiologie, Klinikum Kassel Kassel, Mönchebergstrasse 41–43, 34125 Kassel, Germany.
References
- 1.Hope JKA, Wilson JL, Thomson FJ. Three-dimensional CT angiography in the detection and characterization of intracranial berry aneurysms. AJNR Am J Neuroradiol 1996;17:439-445 [PMC free article] [PubMed] [Google Scholar]
- 2.Nakajima Y, Yoshimine T, Yoshida H,, et al. Computerized tomography angiography of ruptured cerebral aneurysms: factors affecting time to maximum contrast concentration. J Neurosurg 1998;88:663-669 [DOI] [PubMed] [Google Scholar]
- 3.Link J, Brossmann J, Grabener M,, et al. Spiral CT angiography and selective digital subtraction angiography of internal carotid artery stenosis. AJNR Am J Neuroradiol 1996;17:89-94 [PMC free article] [PubMed] [Google Scholar]
- 4.Van Hoe L, Vandermeulen D, Gryspeerdt S,, et al. Assessment of accuracy of renal artery stenosis grading in helical CT angiography using maximum intensity projections. Eur Radiol 1996;6:658-664 [DOI] [PubMed] [Google Scholar]
- 5.Katz DA, Marks MP, Napel SA, Bracci PM, Roberts SL. Circle of Willis: evaluation with spiral CT angiography, MR angiography, and conventional angiography. Radiology 1995;195:445-449 [DOI] [PubMed] [Google Scholar]
- 6.Schreiner S, Paschal CB, Galloway RL. Comparison of projection algorithms used for the construction of maximum intensity projection images. J Comput Assist Tomogr 1996;20:56-67 [DOI] [PubMed] [Google Scholar]
- 7.Diederichs CG, Keating DP, Glatting G, Oestmann JW. Blurring of vessels in spiral CT angiography: Effects of collimation width, pitch, viewing plane, and windowing in maximum intensity projection. J Comput Assist Tomogr 1996;20:965-974 [DOI] [PubMed] [Google Scholar]
- 8.Fürst G, Hofer M, Steinmetz H,, et al. Intracranial stenoocclusive disease: MR angiography with magnetization transfer and variable flip angle. AJNR Am J Neuroradiol 1996;17:1749-1757 [PMC free article] [PubMed] [Google Scholar]
- 9.Korogi Y, Takahashi M, Nakagawa T,, et al. Intracranial vascular stenosis and occlusion: MR angiographic findings. AJNR Am J Neuroradiol 1997;18:135-143 [PMC free article] [PubMed] [Google Scholar]
- 10.Weg N, Scheer MR, Gabor MP, Liver lesions: improved detection with dual-detector-array CT and routine 2.5-mm thin collimation. Radiology 1998;209:417-426 [DOI] [PubMed] [Google Scholar]
- 11.Chimowitz MI, Kokkinos J, Strong J, et al. The warfarin-aspirin symptomatic intracranial disease study. Neurology 1995;45:1488-1493 [DOI] [PubMed] [Google Scholar]
- 12.Heiserman JE, Dean BL, Hodak JA,, et al. Neurologic complications of cerebral angiography. AJNR Am J Neuroradiol 1994;15:1401-1407 [PMC free article] [PubMed] [Google Scholar]
- 13.Argentino C, De Michele M, Fiorelli M, et al. Posterior circulation infarcts simulating anterior circulation stroke. Stroke 1996;27:1306-1309 [DOI] [PubMed] [Google Scholar]
- 14.Knauth M, von Kummer R, Jansen O, Hähnel S, Dörfler A, Sator K. Potential of CT angiography in acute ischemic stroke. AJNR Am J Neuroradiol 1997;18:1001-1010 [PMC free article] [PubMed] [Google Scholar]
- 15.Shrier DA, Tanaka H, Numaguchi Y, Konno S, Patel U, Shibata D. CT angiography in the evaluation of acute stroke. AJNR Am J Neuroradiol 1997;18:1011-1020 [PMC free article] [PubMed] [Google Scholar]
- 16.Kucinski T, Koch C, Grzyska U, Freitag HJ, Krömer H, Zeumer H. The predictive value of early CT and angiography for fatal hemispheric swelling in acute stroke. AJNR Am J Neuroradiol 1998;19:839-846 [PMC free article] [PubMed] [Google Scholar]
- 17.Davros WJ, Obuchowski NA, Berman PM, Zeman RK. A phantom study: evaluation of renal artery stenosis using helical CT and 3D reconstructions. J Comput Assist Tomogr 1997;21:156-161 [DOI] [PubMed] [Google Scholar]
- 18.Brink JA. Technical aspects of helical (spiral) CT. Radiol Clin North Am 1995;33:825-841 [PubMed] [Google Scholar]
- 19.Wentz KU, Röther J, Schwartz A, Mattle HP, Suchalla R, Edelman RR. Intracranial vertebrobasilar system: MR angiography. Radiology 1994;190:105-110 [DOI] [PubMed] [Google Scholar]
- 20.Fürst G, Hofer M, Sitzer M, et al. Factors influencing flow induced signal loss in MR angiography: an in vitro study. J Comput Assist Tomogr 1995;19:692-699 [DOI] [PubMed] [Google Scholar]
- 21.Fürst G, Steinmetz H, Fischer H, et al. Selective MR angiography in the evaluation of intracranial arterial collateral blood flow. J Comput Assist Tomogr 1993;17:178-183 [DOI] [PubMed] [Google Scholar]
- 22.Imakita S, Onishi Y, Hashimoto T,, et al. Subtraction CT angiography with controlled orbit helical scanning for detection of intracranial aneurysms. AJNR Am J Neuroradiol 1998;19:291-295 [PMC free article] [PubMed] [Google Scholar]
- 23.Brant-Zawadzki M. CT angiography in acute ischemic stroke: The right tool for the job? AJNR Am J Neuroradiol 1997;18:1021-1023 [PMC free article] [PubMed] [Google Scholar]


