

Abstract
BACKGROUND AND PURPOSE: Normal values for cerebral blood flow (CBF) and metabolism in adults are well established, but not for children. Our goal, therefore, was to clarify functional developmental changes of the brain in children in relation to CBF and oxygen metabolism.
METHODS: We measured regional CBF (rCBF), regional cerebral metabolic rate for oxygen (rCMRO2), and regional oxygen extraction fraction (rOEF), using positron emission tomography (PET). We performed 30 PET studies in 24 children ages 10 days to 16 years (nine boys, 15 girls), using a steady inhalation method with C15O2, 15O2, and 15CO in order to measure rCBF, rCMRO2, and rOEF, respectively. Regions of interest were set in the primary cerebral areas (sensorimotor, visual, temporal, and parietal cortex), cerebral association areas (frontal and visual association), basal ganglia (lenticular and thalamus), and posterior fossa (brain stem and cerebellar cortex). Subjects were grouped by age (<1, 1 to <3, 3 to <8, and ≥8 years), and the absolute values of the parameters were compared with those obtained from 10 healthy adults.
RESULTS: rCBF and rCMRO2 were lower in the neonatal period than in older children and adults, and increased significantly during early childhood. rCBF was higher as compared with adults, peaking around age 7, whereas rCMRO2 was relatively high, with the last area to increase being the frontal association cortex. Both rCBF and rCMRO2 reached adult values during adolescence. No difference in rCBF was observed between the basal ganglia and the primary cerebral cortex; however, it was prominent in the occipital lobe in every age bracket. No significant changes in rOEF were found during childhood.
CONCLUSION: The dynamic changes of rCBF and rCMRO2 observed in children probably reflect the physiologic developmental state within anatomic areas of the brain.
In adults, but not in children, normal values for cerebral blood flow (CBF) and metabolism are well established (1–3). Although CBF and metabolic rates have been measured in children (4–10), regional cerebral metabolic rates, which take into account developmental changes, have been determined only for glucose (8, 9).
In the present study, regional CBF (rCBF), regional cerebral metabolic rate for oxygen (rCMRO2), and regional oxygen extraction fraction (rOEF) were studied using positron emission tomography (PET) in children with only minor neurosurgical disorders and normal psychomotor development in an attempt to clarify changes of CBF and metabolism in the developing brain.
Methods
Thirty PET studies in nine boys and 15 girls, 10 days to 16 years old, were analyzed (see Table). All had normal psychomotor development at the time of the initial examination in our department. Those suffering intracranial hypertension, local cerebral symptoms, convulsion, or receiving medication were excluded from the study. Normal development was confirmed during a 3-year follow-up period after the PET study and was based on developmental and intelligence quotients.
Summary of 30 PET studies in children 10 days to 16 years old

All studies were performed after informed consent was obtained from the children's parents. The study protocol was approved by the Cyclotron Radioisotope Center and the Clinical Review Board of Tohoku University School of Medicine. PET was performed using a PT-931 system (CTI, Knoxville, TN) (10) with a spatial resolution of 8-mm full width at half-maximum intensity and a section thickness of 7 mm. PET was performed twice to measure the whole brain. The duration of the examination was over 2 hours. In children under the age of 10 years, 2 mg/kg of thiopental sodium was injected intravenously at a slow rate, while electrocardiographic changes, blood pressure, arterial oxygen saturation, and state of breathing were monitored. If body movements were observed as a result of insufficient sedation, 1 mg/kg thiopental sodium was added. An external germanium-68 ring was used for γ ray–measured attenuation correction during transmission scans for each projection.
Arterial blood radioactivity, arterial oxygen tension (PaO2), arterial carbon dioxide tension (PaCO2), and hemoglobin were measured, and rCBF, rCMRO2, and rOEF were measured using the [15O] state inhalation method with C15O2, 15O2, and 15CO, respectively. The brain-blood partition coefficient for H20 was set at 1.1 for infants less than 1 month old and at 1.0 for older children (11). To measure arterial blood radioactivity, 1 mL of blood was taken at 1, 3, and 6 minutes after the start of the emission scan. Arterial blood gases and hemoglobin were measured after termination of the emission scan with C15O2 and before the start of the emission scan with 15O2.
Using the MR images (12), regions of interest were set in the sensorimotor area, visual area, temporal lobe, and parietal lobe; the frontal association and visual association areas; the lenticular nuclei and thalamus of the basal ganglia; and in the brain stem and cerebellar cortex.
The children were grouped by age (<1 year, 1 to <3 years, 3 to <8 years, and ≥8 years), and the values obtained in each age group were compared with those obtained in 10 healthy control adults (four men and six women, 22 to 56 years old; mean age, 42 ± 11 years). Statistical analysis to compare the children with the adults was done with the Mann-Whitney U-test; comparisons among groups of children of different ages were made using Student's paired t-test. A P value of < .05 was regarded as significant.
Results
Physiologic data from the subjects were all within normal ranges, including pH, arterial blood pressure, PaO2, PaCO2, and hemoglobin.
rCBF (Figure 1)
fig 1.

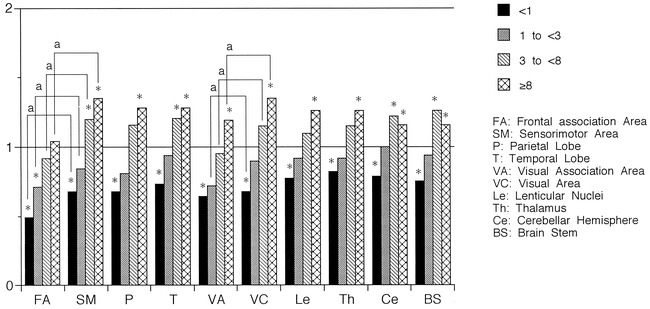
Ratio of rCBF values to those in adults distributed by age. rCBF values increased with development in all areas. The last increase was observed in the frontal association area. Compared with rCBF values in adults, low values were observed in the frontal and visual association areas and the sensorimotor area in the <1-year-old group, and in the frontal association area in the 1- to <3-year-old group, whereas rCBF values were significantly increased in all areas in the 3- to <8-year-old group, except for the frontal association area. rCBF values were always lower in the association areas than in the primary areas, except for those in the visual association area and the visual area in the ≥8-year-old group. Asterisk indicates Mann-Whitney U-test, P < .05; a, paired t-test, P < .05
The ratio of rCBF values to those in adults exceeded 1.0 in the visual area of children in the <1-year-old age bracket, in the other primary cerebral cortical areas and basal ganglia of children in the 1- to <3-year-old bracket, and in the visual and frontal association areas of children in the 3- to <8-year-old bracket. Although the ratio of rCBF values to those in adults exceeded 1.0 in the cerebellar cortex and brain stem of children in the 3- to <8-year-old bracket, it only approximated 1.0 in the 1- to <3-year-old bracket (0.98 in the cerebellar cortex and 0.96 in the brain stem).
rCBF values increased with development in all areas, reaching a peak value in the 3- to <8-year-old group and becoming comparable to those in adults in the ≥8-year-old group. rCBF values were always lower in the cerebral association areas than in the primary areas, except for those in the visual association and visual cortical areas of children in the ≥8-year-old group (P < .05).
Compared with rCBF values in adults, lower values were observed in the sensorimotor, frontal, and visual association areas in the <1-year-old group, and in the frontal association area in the 1- to <3-year-old group. rCBF values were significantly increased in all areas of children in the 3- to <8-year-old group and in the ≥8-year-old group, except for the frontal association area (P < .05).
rCMRO2 (Figure 2)
fig 2.
The ratio of rCMRO2 values to those in adults distributed by age. rCMRO2 values increased with development in all areas but the ratio of increase was smaller than that of rCBF. The last increase was observed in the frontal association area. The ratio increased to more than one at a later age compared with that of rCBF. Compared with rCMRO2 values in adults, low values were observed in all areas in the <1-year-old age group and in the frontal association area in the 1- to <3-year-old group, whereas rCMRO2 values were significantly increased in the sensorimotor area, visual area, temporal lobe, cerebellar cortex, and brain stem in the 3- to <8-year-old group and in all areas in the ≥8-year-old group, except for the frontal association area. rCMRO2 values were always lower in the association areas than in the primary areas, except for those in the visual association area and the visual area in the <1-year-old group. Asterisk indicates Mann-Whitney U-test, P < .05; a, paired t-test, P < .05
The ratio of rCMRO2 values to those in adults exceeded 1.0 in the visual and frontal association areas of children in the ≥8-year-old age bracket, and exceeded 1.0 in the other cerebral cortical areas, basal ganglia, cerebellar cortex, and brain stem of children in the 3- to <8-year-old bracket. That is, the ratio increased to >1.0 at a later age as compared with that of rCBF.
rCMRO2 values increased with development in all areas. The rate of increase decreased with age, and was smaller than that of rCBF, but showed no peaks with respect to changes such as those seen in rCBF.
rCMRO2 values were always lower in the association areas than in the primary areas, except for values in the visual association area and the visual cortical area of children in the <1-year-old age bracket (P < .05).
Compared with rCMRO2 in adults, low values were observed in all areas in the <1-year-old group, and in the frontal association area of children in the 1- to <3-year-old group. rCMRO2 values were significantly increased in the sensorimotor area, visual area, temporal lobe, cerebellar cortex, and brain stem of children in the 3- to <8-year-old group, and in all areas of children in the ≥8-year-old group, except for the frontal association area (P < .05).
rOEF (Figure 3)
fig 3.
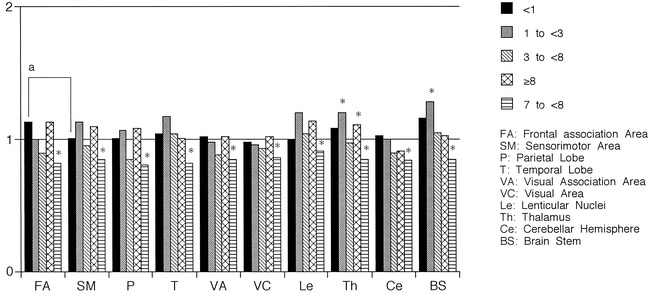
The ratio of rOEF values to those in adults distributed by age. Regardless of age, rOEF values were within or nearly in the range of adult values. Compared with rOEF values in adults, statistically significant differences were observed only in the thalamus and brain stem in the 1- to <3-year-old age group, in the parietal lobe in the 3- to <8-year-old group, and in the thalamus in the ≥8-year-old group. rOEF values of the primary cerebral areas did not differ from those of the association areas in any age group, except in the frontal association and sensorimotor areas in the <1-year-old group. Asterisk indicates Mann-Whitney U-test, P < .05; a, paired t-test, P < .05
Regardless of the age of children, rOEF values were within the range of adult values.
In contrast to rCBF and rCMRO2 values, rOEF values of the primary cerebral cortex did not differ from those of the association area, except for the frontal association and sensorimotor areas of children in the <1-year-old age bracket (P < .05).
As compared with rOEF values in adults, statistically significant differences were observed only in the thalamus and brain stem of children in the 1- to <3-year-old group, in the parietal lobe of children in the 3- to <8-year-old group, and in the thalamus in the ≥8-year-old group (P < .05).
Discussion
The effect of aging on cerebral circulation and metabolism has been widely investigated by measuring CBF with the N2O method, and results have shown that CBF decreases with age in healthy adults (13–15). Moreover, in the elderly, CMRO2 and CBF continue to decrease with age; however, this degree of decrease is slight, and, consequently, an apparent increase in OEF is observed (14, 16, 17). Recently, PET studies evaluating rCBF and rCMRO2 in the gray matter have shown similar findings in adults (16, 17). Except for regional cerebral metabolic rate for glucose, little has been reported concerning the changes of cerebral circulation and metabolism observed with PET in children (8, 9). Metabolic rates determined by 18F-fluorodeoxyglucose (FDG)-PET are expressed as the sum of both aerobic and anaerobic glycolytic metabolism (18, 19). A glucose metabolic rate, however, may appear unchanged despite a decrease in aerobic glycolysis if anaerobic glycolysis increases. Thus, a measured glucose metabolic rate may not reflect the actual state of brain metabolism under abnormal conditions. In this study, PET was used to measure rCBF and rCMRO2 together with rOEF in children in an attempt to clarify developmental changes in CBF and metabolism.
Our data indicate that rCBF in the <1-year-old age bracket is lower than in older children. Subsequently, a notable increase is observed in infants, followed by a gradual decrease in rCBF to adult levels during adolescence. On the other hand, CMRO2 barely reaches the adult level during the same period, in which the subsequent increase is not as striking as that seen with rCBF values. In the 3- to <8-year-old group (peaking at the age of 7), the rCBF values ranged from 140% to 175% relative to adult values, whereas the rCMRO2 values ranged from 100% to 120% of adult values. From published data, nerve cell density is known to be much higher in the neonatal period than in adults (20–22), but explanations for the lower cerebral circulation and metabolism in the neonate are still forthcoming. A few reports have suggested that the “excess” nerve cells produced during fetal development will start to denature and disappear around the time of birth, particularly in the neonatal period (20–24), while myelination of the remaining axons proceeds and synapses are rapidly generated (21, 25, 26). The amount of DNA in the brain peaks twice (27), once in the fetal period and again in the neonatal period. The former is related to the division of nerve cells and the latter to the division of glial cells. Myelination begins in the fetal period and proceeds rapidly in the neonatal period, during which synapses increase explosively after the decrease in nerve cell density (20, 28). These physiologic correlations may explain the changes seen in rCBF and rCMRO2. The increase in rCBF and rCMRO2 between the neonatal period and early childhood would be necessary to maintain synaptic development and to allow myelination. Once brain function develops and transmission of information is activated, the rCMRO2 increases to satisfy the greater requirement of energy.
It has been reported that, at birth, rCBF is higher in the thalamus than in other brain regions (6). Other investigators (29) found that at approximately 1 year of age, rCBF in the thalamus was similar to that in the cerebral cortex; at 1 to 4 years of age, rCBF in the occipital lobe was prominent; and over 5 years of age, rCBF was most prominent in the frontal lobe and was similar to that of an adult pattern. In our study, however, no difference was observed between the basal ganglia and the primary cerebral cortex; the most prominent rCBF was in the occipital lobe at any age, and the difference between the occipital and frontal lobes became smaller during adolescence.
Conclusion
Developmental changes in rCBF, rCMRO2, and rOEF were investigated using PET. Although both rCBF and rCMRO2 varied over time during development, these parameters did not change simultaneously and exhibited local differences between the primary cerebral cortex and the association areas. The rCBF in the neonatal period was lower than that in adults, and, subsequently, a notable increase was observed in infants, with values gradually reaching the adult level during adolescence. On the other hand, rCMRO2 levels barely reached the adult level during the same period, and the subsequent increase was not as evident as that of the rCBF values. These results are thought to reflect the physiologic and developmental state of the brain in children. PET studies of cerebral circulation and metabolism have been reported for seizures (8, 9), hydrocephalus (7), and moyamoya disease (5). The present data indicate that variations in cerebral circulation and metabolism during normal development must be taken into consideration in the evaluation of any disease state.
Acknowledgments
We thank Cyclotron Radioisotope Center, Tohoku University, for use of the PET machine.
Footnotes
Supported in part by a research grant for intractable disease from the Japanese Ministry of Health and Welfare.
Address reprint requests to Toshie Takahashi, MD.
References
- 1.Ketty SS, Schmidt CF. The determination of cerebral blood flow in man by the use of nitrous oxide in low concentration. Am J Physiol 1945;143:53-66 [Google Scholar]
- 2.Frackowiak RSJ, Lenzi GL, Jones T,, et al. Quantitative measurement of regional cerebral blood flow and oxygen metabolism in man using 15O2 and positron emission tomography: theory, procedure and normal values. J Comput Assist Tomogr 1980;4:727-736 [DOI] [PubMed] [Google Scholar]
- 3.Phelps ME, Huang SC, Hoffmann EJ,, et al. Tomographic measurement of regional cerebral blood flow and oxygen metabolism in man using 15O2 and positron emission tomography: theory, procedure and normal values. Ann Neurol 1979;5:371-388 [Google Scholar]
- 4.Altman DI, Volpe JJ, Powers WJ. Cerebral oxygen metabolism in new born infants with positron emission tomography. J Cereb Blood Flow Metab 1989;9(Suppl 1):S25 [Google Scholar]
- 5.Ikezaki K, Matsushima T, Kuwabara Y,, et al. Cerebral circulation and oxygen metabolism in childhood moyamoya disease: a perioperative positron emission tomography study. J Neurosurg 1994;81:843-850 [DOI] [PubMed] [Google Scholar]
- 6.Rubinstein M, Denay R, Ham HR,, et al. Functional imaging of brain maturation in humans using iodine-123 iodoamphetamine and SPECT. J Nucl Med 1989;30:1982-1985 [PubMed] [Google Scholar]
- 7.Shirane R, Sato S, Sato K,, et al. Cerebral blood flow and oxygen metabolism in infants with hydrocephalus. Childs Nerv Syst 1992;8:118-123 [DOI] [PubMed] [Google Scholar]
- 8.Chugani HT, Phelps ME. Maturational changes in cerebral function in infants determined by 18FDG positron emission tomography. Science 1986;231:840-843 [DOI] [PubMed] [Google Scholar]
- 9.Chugani HT, Phelps ME, Mazziotta JC. Positron emission tomography study of human brain functional development. Ann Neurol 1987;22:487-497 [DOI] [PubMed] [Google Scholar]
- 10.Spinks TJ, Guzzardi R, Bellina CR. Performance characteristics of a whole body positron tomography. J Nucl Med 1988;29:1833-1841 [PubMed] [Google Scholar]
- 11.Herscovitch P, Raiche ME. What is the correct value for the brain-blood partition coefficient for water? J Cereb Blood Flow Metab 1985;5:65-69 [DOI] [PubMed] [Google Scholar]
- 12.Salamon G, Raynaud C, Regis J, et al. Magnetic Resonance Imaging of the Pediatric Brain: Anatomical Atlas.. New York: Raven Press; 1900:35–343
- 13.Fazekas JF, Alman RW, Bessman AN. Cerebral physiology of the aged. Am J Med Sci 1952;223:245-257 [DOI] [PubMed] [Google Scholar]
- 14.Ketty SS. Human cerebral blood flow and oxygen consumption as related to aging. J Chronic Dis 1956;3:478-486 [DOI] [PubMed] [Google Scholar]
- 15.Melamed E, Lavy S, Bentin S,, et al. Reduction in regional cerebral blood flow during normal aging in man. Stroke 1980;11:31-35 [DOI] [PubMed] [Google Scholar]
- 16.Pantano P, Baron JC, Lebrun-Grandie P,, et al. Regional cerebral blood flow and oxygen consumption in human aging. Stroke 1984;15:635-641 [DOI] [PubMed] [Google Scholar]
- 17.Yamaguchi T, Kanno I, Uemura K,, et al. Reduction in regional cerebral metabolic rate for oxygen during human aging. Stroke 1986;17:1220-1228 [DOI] [PubMed] [Google Scholar]
- 18.Di Chiro G, DeLaPaz RL, Brooks RA,, et al. Glucose utilization of cerebral gliomas measured by [18F] fluorodeoxyglucose and positron emission tomography. Neurology 1982;32:1323-1329 [DOI] [PubMed] [Google Scholar]
- 19.Di Chiro G. Positron emission tomography using [18F] fluorodeoxyglucose in brain tumors: a powerful diagnostic and prognostic tool. Invest Radiol 1986;22:360-371 [DOI] [PubMed] [Google Scholar]
- 20.Cragg BG. The development of synapses in the visual system of the cat. J Comp Neurol 1975;160:147-166 [DOI] [PubMed] [Google Scholar]
- 21.Roger LA, Cowan WM. The development of the mesencephalic nucleus of the trigeminal nerve in the chick. J Comp Neurol 1973;147:291-319 [DOI] [PubMed] [Google Scholar]
- 22.Tsumoto T, Suda K, Sato H. Postnatal development of corticotectal neurons in the kitten striate cortex. J Comp Neurol 1983;219:88-99 [DOI] [PubMed] [Google Scholar]
- 23.Brody H. Organization of the cerebral cortex, III: a study of aging in the human cerebral cortex. J Comp Neurol 1955;102:511-556 [DOI] [PubMed] [Google Scholar]
- 24.Brody BA, Kinney HC, Kloman AC,, et al. Sequence of central nervous system myelination in human infancy, 1: an autopsy study of myelination. J Neuropathol Exp Neurol 1987;46:283-301 [DOI] [PubMed] [Google Scholar]
- 25.Huttenlocher PR. Synaptic density in human frontal cortex: developmental changes and effects of aging. Brain Res 1979;163:195-205 [DOI] [PubMed] [Google Scholar]
- 26.Molliver ME, Kostovic I, Van der Loss H. The development of synapses in cerebral cortex of the human fetus. Brain Res 1973;50:403-407 [DOI] [PubMed] [Google Scholar]
- 27.Dobbing J. Undernutrition and the developing brain. Am J Dis Child 1970;120:411-415 [DOI] [PubMed] [Google Scholar]
- 28.Poduslo SE, Jang Y. Myelin development in infant brain. Neurochem Res 1984;9:1615-1626 [DOI] [PubMed] [Google Scholar]
- 29.Ogawa A, Sakurai Y, Kayama T,, et al. Regional cerebral blood flow with age: changes in rCBF in childhood. Neurol Res 1989;11:173-176 [DOI] [PubMed] [Google Scholar]