Abstract
BACKGROUND AND PURPOSE: CNS tuberculosis may simulate other granulomas and meningitis on MR images. The purpose of this study was to improve the characterization of lesions in CNS tuberculosis and to assess the disease load using magnetization transfer (MT) imaging.
METHODS: A total of 107 tuberculomas in seven patients with or without meningitis and 15 patients with tuberculosis meningitis alone were studied. Fifteen patients with cysticercus granulomas with T2 hypointensity, five patients each with viral and pyogenic meningitis, and two patients with cryptococcal meningitis were also studied. The MT ratios were calculated from tuberculomas, cysticercus granulomas, and thickened meninges in tuberculous, viral, pyogenic, and cryptococcal meningitis and were compared within each pathologic group and with the MT ratio of different regions of normal brain parenchyma. Detectability of lesions on T1-weighted MT spin-echo (SE) images was compared with that on conventional SE and postcontrast MT-SE images.
RESULTS: Thickened meninges appeared hyperintense relative to surrounding brain parenchyma in the basal and supratentorial cisterns on precontrast MT-SE images in all 18 patients with tuberculosis meningitis. These meninges were not seen or were barely visible on conventional SE images, and enhanced on postcontrast MT-SE images. The MT ratio from the thickened meninges of tuberculous meningitis was significantly lower than that from the meninges in cryptococcal and pyogenic disease and significantly higher than the meninges in viral meningoencephalitis. The MT ratio from T2 visible and invisible tuberculomas appeared to be significantly lower than that of normal white matter. The MT ratio of T2 hypointense cysticercus granuloma was significantly higher than that of T2 hypointense tuberculoma.
CONCLUSION: Precontrast MT-SE imaging helps to better assess the disease load in CNS tuberculosis by improving the detectability of the lesions. With the use of MT ratios, it may be possible to differentiate tuberculosis from similar-appearing infective lesions on MR images.
CNS tuberculosis is endemic in certain regions of the world, and, recently, the prevalence of tuberculosis has been on the rise worldwide as a result of the increased number of AIDS cases (1). Because prompt diagnosis may result in earlier treatment, recognition of this disorder on radiologic images may play a critical role in patient management. CT and MR imaging are the main imaging techniques used in its localization and characterization (2–4). The imaging features overlap with other intracranial diseases, such as cysticercosis, metastases, and primary brain neoplasm. Recently, in vivo proton MR spectroscopy has been found to be helpful in better characterizing such lesions (5, 6); however, it may not always be possible to evaluate lesions smaller than 10 mm with in vivo spectroscopy owing to its sensitivity constraints.
The magnetization transfer (MT) technique has recently received attention as an additional sequence by which to improve image contrast and tissue specificity on MR studies (7–18). Abnormal MT properties of white matter have been described in patients with inflammatory CNS diseases that appeared normal on conventional spin-echo (SE) MR images (8, 14, 16, 17). We performed MT-SE imaging in patients with CNS tuberculosis to ascertain the relationship between location, signal intensity, and visibility of lesions seen on T2-weighted and MT-SE images; to better define the disease load; and to differentiate CNS tuberculosis from other, similar-appearing infective lesions.
Methods
The study population consisted of 22 patients with CNS tuberculosis. Twelve patients were women and 10 were men; ages ranged from 14 to 22 years. Tuberculous meningitis was present in 15 patients, three had associated tuberculomas with meningitis, and four had multiple tuberculomas only. Fifteen patients with neurocysticercosis in different stages had a total of 50 lesions showing T2 hypointensity; five patients with viral and pyogenic meningitis and two with cryptococcal meningitis also were included in the study to compare the MT ratios of the meninges of these lesions with those of tuberculosis. The final diagnosis of tuberculosis was based on typical CSF features (cellularity and biochemistry): positive enzyme-linked immunosorbent assay (ELISA) for tubercular antigen; response to specific therapy in 18 patients (19); typical radiologic features of miliary pulmonary tuberculosis; Mycobacterium tuberculosis findings on bronchial lavage culture (n = 2); and response to antituberculosis drugs in the remaining four patients (1, 3). In addition, CSF cultures revealed M. tuberculosis in three of 18 patients with tuberculosis meningitis. The diagnosis of cysticercosis was based on the presence of scolex in a cyst on MR images and the presence of cysticercus antigen in CSF demonstrated by an ELISA. Cryptococcal meningitis was confirmed by demonstration of the yeast on India ink in CSF and a culture of the organism; pyogenic meningitis was confirmed by CSF culture of the organisms; and viral meningitis was confirmed by demonstration of antigen in the CSF for the specific virus. Five patients had viral meningoencephalitis (Japanese meningoencephalitis in four, herpes simplex meningoencephalitis in one). Of the five patients with pyogenic meningitis, three had pneumococcal meningitis and two had meningococcal meningitis.
All MR examinations were performed with 1.5-T system. Each patient's head was fixed to prevent movement during and in between acquisition of images. Conventional SE T1-weighted (1000/14/3 [TR/TE/excitations]) and T2-weighted (2200/20, 80/1) MR images were obtained. All images were acquired in the axial plane with 5-mm-thick sections, a 0.5-mm intersection gap, and a 192 × 256 matrix. The pulse sequence used for MT contrast consisted of an off-resonance saturation pulse immediately before the 90° excitation pulse to saturate the magnetization of protons with restricted motion. The bandwidth of the saturation pulse was 250 Hz, and a frequency offset of 1.5 kHz. For T1-weighted MT images, only a saturation pulse was added, the other parameters were identical to the conventional SE T1-weighted images. The TR/TE parameters were chosen to minimize T1 and T2 effects (12). Written consent allowing performance of an additional MT sequence was obtained from every patient or nearest relative. A postcontrast MT-SE sequence was also performed in all cases after intravenous injection of 0.1 mmol/kg gadopentetate dimeglumine per body weight. Postcontrast SE non-MT T1-weighted imaging was not done, as it has been shown that postcontrast T1-weighted MT-SE images are better for visualizing enhancing lesions (9–12).
The tuberculous lesions were grouped on T2-weighted images as those with a T2 hypo- or isointense core and a hyperintense peripheral rim and those that were hyperintense, when these were visible on the images. When the lesions were not visible or barely visible on T2-weighted images and became visible on MT-SE T1-weighted images, they were called conventional SE–invisible or isointense with parenchyma (3, 4). Lesions visible only on postcontrast MT-SE studies were labeled as postcontrast MT-SE–visible granulomas. The granulomas seen after contrast administration were considered nodular or rim-enhancing when the signal of the lesions increased on postcontrast MT-SE images as compared with precontrast MT-SE images (20).
MR images were evaluated and MT ratios were independently calculated by two radiologists. Signal intensity from the same region of interest (ROI) was measured from the conventional T1-weighted image without (S0) and with (Smt) an off-resonance pulse. The MT ratio was calculated using the formula (S0−Smt/S0) × 100 (8). There was no disagreement between the two radiologists with respect to classification of the lesion or the MT ratios. The ROIs were obtained with a single pixel in different regions of the lesion and included the core and the rim. The MT ratio from the patients with meningitis was calculated by placing multiple ROIs with single pixels and calculating the mean and standard deviations from all ROIs for the type of meningitis. The T2-invisible lesions and meningeal abnormalities were quantitated using the MT T1-weighted images for measuring the signal (Smt) and then going back to the T1-weighted SE images to measure the (S0) signal. Consistency and reliability of the measurements were confirmed by obtaining the values repeatedly.
The MT ratios from scalp fat, CSF, and cortical and deep gray matter and white matter of the brains of 25 healthy control subjects between the ages of 12 and 50 years as well as from the normal-appearing parenchyma of the 22 patients were also obtained. ROIs with a single pixel were obtained from 10 regions of the cortices of the frontal, parietal, occipital, and temporal lobes or from the normal cortices. Similarly, 10 ROIs were selected from the white matter. For deep gray matter, ROIs from the basal ganglia and thalami were included. Background noise was measured and was divided by the square root of π (13).
Statistics
The MT ratios from the lesions and the normal regions with topospecific locations were compared with one-way analysis of variance using a commercially available program.
Results
The location, type of lesion, and MT ratios of the different groups of tuberculomas and tuberculous meningitis are summarized Tables 1 and 2.
TABLE 1:
Summary of the tuberculous lesions, location and MT ratios

TABLE 2:
Summaries of MT ratios in meningitis with different origins

Tuberculous Meningitis (n = 18)
Routine SE T1- and T2-weighted imaging did not show any obvious meningeal thickening in any of the 18 patients. Precontrast MT-SE images in all these patients showed mild to moderate hyperintense signal around the brain stem in the basal cisterns and supratentorial subarachnoid space, consistent with thickened pia-arachnoid, and enhancement after contrast administration (Figs 1 and 2). The MT ratio of these hyperintense meninges was 19.49 ± 1.22 and was significantly lower than that of gray and white matter (P < .001).
fig 1.
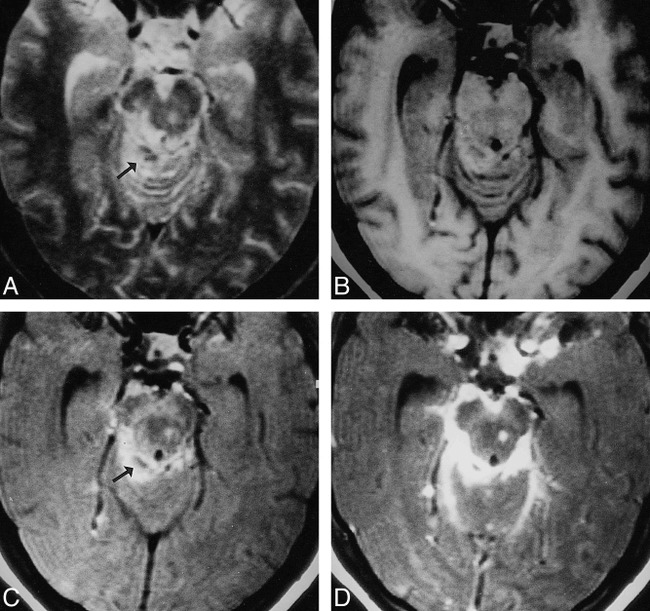
Tuberculous meningitis with tuberculoma.
A, T2-weighted image through the mesencephalon shows a hyperintense lesion on the left side, along with a hyperintense region with central hypointense specks (arrow) in the right perimesencephalic cistern, merging with the lateral margin of the midbrain.
B, On T1-weighted image, the cisternal lesion appears isointense relative to white matter, with central hypointensity; the left midbrain lesion also appears isointense.
C, MT-SE T1-weighted image shows the left midbrain lesion and the right cisternal lesion as hyperintense, with central hypointensity extending to the remaining margins of the midbrain (arrow).
D, Postcontrast MT-SE T1-weighted image shows these meningeal and parenchymal lesions with marked enhancement.
fig 2.
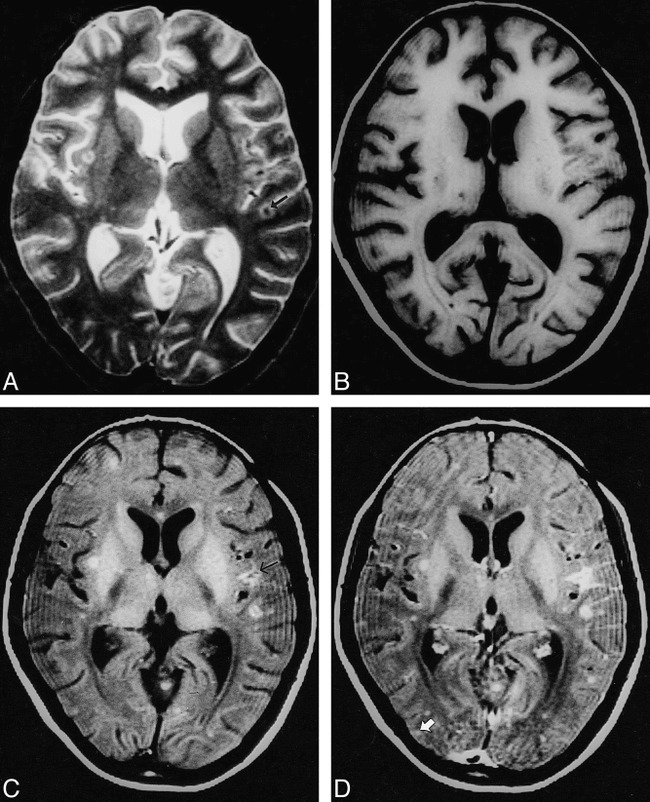
Multiple tuberculomas with meningitis.
A, T2-weighted image through the lateral ventricles show lesions with hypointense core and peripheral hyperintensity in left parietal region (arrow).
B, On T1-weighted image, these are not visible.
C, On MT-SE T1-weighted image, the lesions have a hyperintense rim with subtle central hypointensity. A focal area of meningeal hyperintensity is apparent in the left parietal region (arrow).
D, Both lesions show enhancement on postcontrast MT-SE T1-weighted image. A cortical enhancing lesion is only visible on this sequence (arrow).
Nontuberculous Meningitis (n = 12)
The MT ratio in viral meningitis (Fig 3) measured 8.2 ± 0.8; in pyogenic meningitis (Fig 4), 30 ± 0.17; and in cryptococcal meningitis (Fig 5), 27.2 ± 1.7. The MT ratio of the inflamed meninges in viral meningitis was significantly lower than that in tuberculous meningitis (P < .001), whereas it was significantly higher in pyogenic and fungal meningitis than in tuberculosis meningitis (P < .001). Viral meningitis had a significantly lower MT ratio than did fungal and pyogenic meningitis (P < .001); however, there was no significant difference in the MT ratio between fungal and pyogenic meningitis (P > .05).
fig 3.
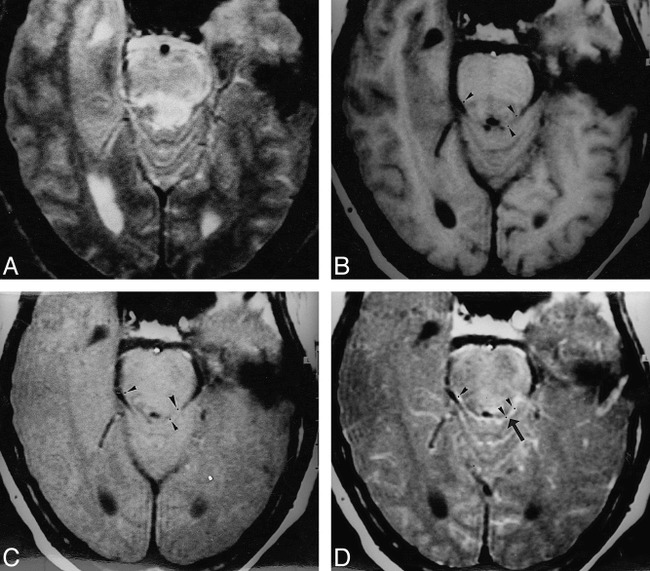
Viral meningoencephalitis.
A–D, T2-weighted (A), T1-weighted (B), MT-SE T1-weighted (C), and postcontrast MT-SE T1-weighted (D) images. In A, an image through the region of the pons shows a poorly defined T2 hyperintense parenchymal lesion in the dorsal aspect of the pons. In D, there is meningeal enhancement (arrow) in the basal cisterns. In A and B, there is no suggestion of meningeal thickening/involvement. ROIs placed for calculation of the MT ratio at same positions in B, C, and D are shown as black dots (arrowheads).
fig 4.
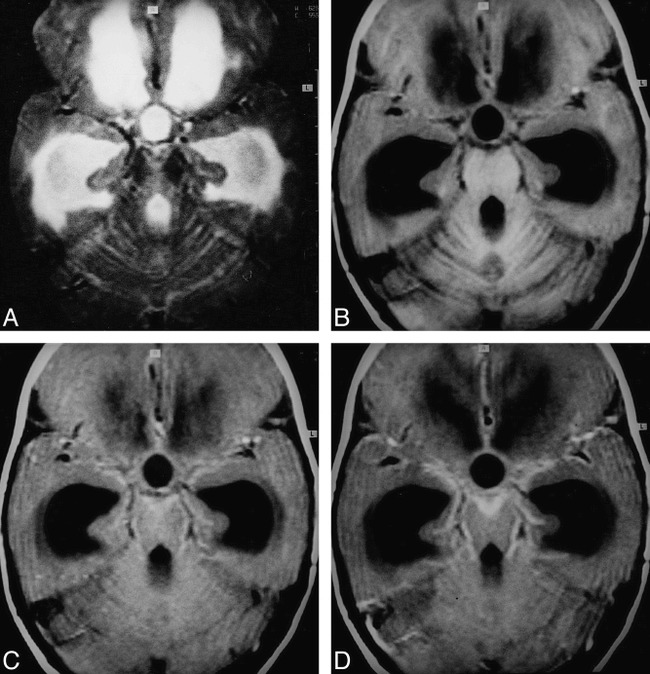
Pyogenic meningitis.
A–D, T2-weighted (A), T1-weighted (B), MT-SE T1-weighted (C), and postcontrast MT-SE T1-weighted (D) images. In D, image through the basal cisterns shows enhancing meningeal thickening. In C, there is hyperintensity in the region that is enhancing in D. This hyperintensity is not visible in A and B.
fig 5.
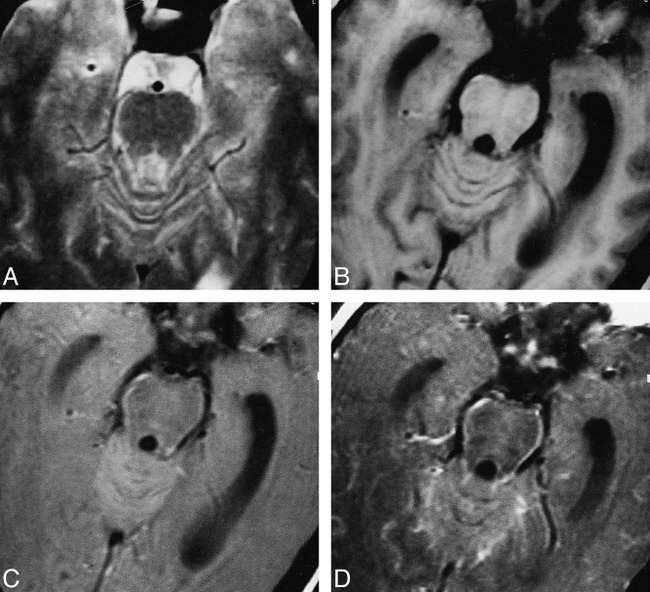
Cryptococcal meningitis.
A–D, T2-weighted (A), T1-weighted (B), MT-SE T1-weighted (C), and postcontrast MT-SE T1-weighted (D) images. In C, image through the pons shows periparenchymal hyperintensity that enhances in D. These are not visible in A and B.
Tuberculomas
A total of 107 tuberculomas were seen in seven patients. All except five of these lesions were visible on MT-SE precontrast images. The size of the lesions varied from 2 to 10 mm. Postcontrast MT-SE images showed nodular or rim enhancement in 90 lesions. Five of the 90 lesions were visible only on postcontrast MT-SE images; these lesions were located in the cortex (Figs 2 and 6). Only 76 lesions were visible on routine SE images; 32 were hyperintense, 44 showed a central hypointense/isointense core with a hyperintense rim on T2-weighted images. All the lesions visible on T2-weighted images appeared isointense on T1-weighted images. Of the 32 T2 hyperintense lesions, 18 were located in the subcortical white matter and 14 were in the deep white matter. Of the 44 lesions with a T2 hypointense core, eight were located in the cortex, 13 were in the subcortical white matter, and 23 were in the deep white matter. T2 hyperintense lesions appeared hyperintense relative to white matter on MT-SE images (Figs 2 and 3). The lesions with a T2 hypointense core showed a slightly hypointense core with a thick hyperintense rim on MT-SE images (Figs 2 and 6). The 26 lesions that were not visible or barely visible were termed T2 isointense and appeared as hyperintense masses on T1-weighted MT-SE images (Figs 2 and 6). All the 26 SE-invisible lesions were located in the white matter. All the 76 lesions visible on SE images were discernible on MT-SE images. A total of 85 of the 102 lesions visible on precontrast MT-SE images showed dot or rim contrast enhancement.
fig 6.
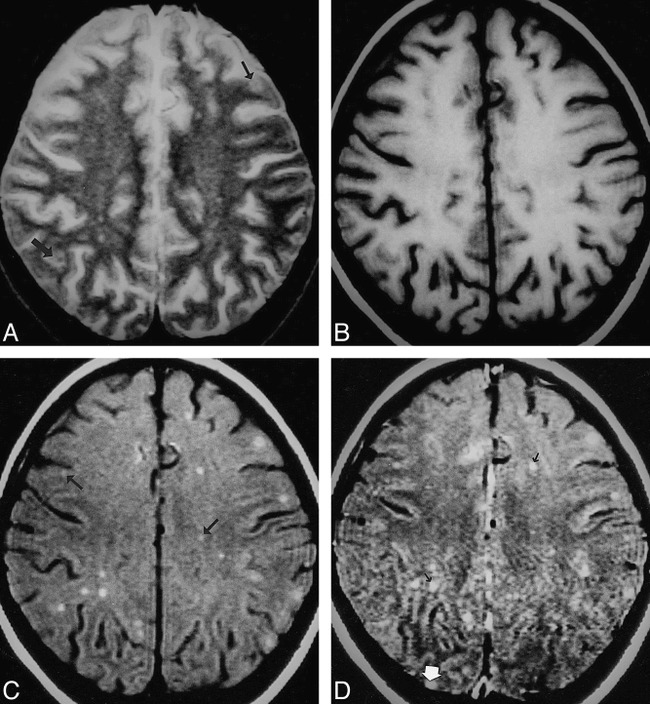
Multiple tuberculomas.
A–D, T2-weighted (A), T1-weighted (B), MT-SE T1-weighted (C), and postcontrast MT-SE T1-weighted (D) images. In A, image through the supraventricular region shows subtle areas of hypointensity with a hyperintense rim (arrow) in the cortex and subcortical white matter. In B, these lesions are isointense with the parenchyma. In C, the lesions seen in A have a hyperintense rim with subtle or no hypointense core. The other lesions seen as hyperintense dots in the subcortical and deep white matter (arrow) are not visible in A. In D, the hyperintensity is increased in some of the lesions (black arrow); however, one lesion in the right occipital cortex, which shows enhancement (white arrow), was not visible on A, B, or C.
The MT ratio from the cortical and deep gray matter, white matter, CSF, and fat of the healthy control subjects measured 27.8 ± 0.55 and 24.8 ± 1.03, 36.3 ± 1.27, −3.54 ± 1.27, and 8.7 ± 1.06, respectively. The MT ratios from the different regions in the control subjects were not significantly different from the images of normal parenchyma in the patient group (P > .5). The data from the control group was taken for comparison with tuberculomas, thickened meninges, and T2 hypointense cysticercus granulomas. The tuberculous lesions with a hypointense core on T2-weighted images had MT ratios of 23.8 ± 1.76 in the rim and 24.2 ± 3.1 in the core. There was no significant difference between the MT ratios in the core and the rim of these lesions (P > .5). In the lesions that were isointense or invisible on SE images, MT ratios from the granulomas measured 26.04 ± 1.9. T2 hyperintense lesions showed an MT ratio of 26.6 ± 1.94. The MT ratio was significantly lower than that of white matter (P < .001) for all tuberculomas located in the subcortical and deep white matter. The tuberculomas with a hypointense core on T2-weighted images also showed a significantly lower MT ratio as compared with even the cortical gray matter (P < .01). However, the MT ratios of T2 hyperintense and invisible lesions were not significantly different from that of cortical gray matter (P > .5).
Cysticercus Granuloma
The MT ratio from the 50 T2 hypointense cysticercus granulomas (Fig 7) in 15 patients measured 32.1 ± 1.2.
fig 7.
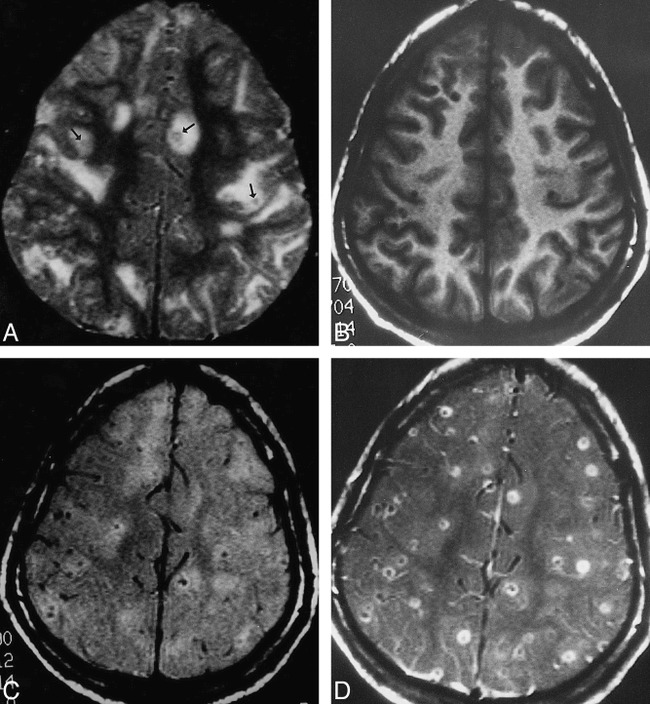
Cysticercus granulomas.
A–D, T2-weighted (A), T1-weighted (B), MT-SE T1-weighted (C), and postcontrast MT-SE T1-weighted (D) images. In A, image through the supraventricular part of the cerebrum shows multiple T2 hypointense granulomas (arrows) along with other lesions in different stages of evolution. In B, the T2 hypointense lesions are not visible; in C, they are barely visible; and in D, they show rim enhancement.
Discussion
SE postcontrast T1-weighted imaging is essential for the MR diagnosis of tuberculous meningitis (4). Recently, postcontrast MT-SE imaging has improved the sensitivity of detection of meningitis with injection of a single dose of contrast agent compared with what is achieved using a triple dose with conventional SE T1-weighted imaging (10, 15, 16). Runge et al (16) found that the inflamed meninges were not visible on precontrast T1-weighted MT images in experimental animals in whom pyogenic meningitis had been introduced, and early meningitis could be seen only on postcontrast studies. In our study, the periparenchymal hyperintensity was distinctly visible on precontrast MT-SE T1-weighted images in all the cases of tuberculosis meningitis and showed enhancement in those regions after contrast administration. The difference in the visibility of inflamed meninges on precontrast MT-SE images was probably due to the difference in the causative agent of meningitis in two studies. In tuberculous meningitis, tuberculomas along with exudates are found in the meninges, which are composed of cellular infiltrate, degenerated and partly caseated fibrin, tubercles, and, rarely, bacilli (21). These were probably responsible for the differential MT ratio between brain parenchyma and inflamed meninges, and hence its visibility on precontrast MT-SE images. The MT ratio of inflamed meninges with exudates in tuberculosis meningitis was significantly lower than that of pyogenic and fungal meningitis and was significantly higher than that of viral meningitis. Pyogenic and fungal meningitis exudates are very rich in protein and amino acids, whereas exudate in viral meningitis shows a mild elevation of proteins. Inflamed meninges and exudate from the viral meningitis showed significantly lower MT ratios than those of pyogenic and fungal meningitis. There was, however, no significant difference between the MT ratios of the inflamed meninges of fungal and pyogenic meningitis. Transfer of magnetization depends on the concentration of proteins. The higher the concentration of proteins, the greater the MT (22). The difference in the MT ratio of meningitis stemming from different causative agents is probably due to the amount of protein in the exudates.
Precontrast T1-weighted MT-SE images detected the maximum number of tuberculomas as compared with routine SE images and postcontrast T1-weighted MT-SE images. The lesions not well detected on SE images were those that were isointense relative to brain parenchyma. Visibility of the lesion on MT-SE images depends on the difference in contrast between brain parenchyma and the lesion due to differential transfer of magnetization (17). Detection of conventional SE–invisible tuberculomas on MT-SE images is the result of the lower transfer of magnetization in granulomas as compared with surrounding brain parenchyma. Disruption of the blood-brain barrier depends on the activity of the lesion and whether the lesion is inactive; it may not enhance after contrast administration (20). Precontrast MT-SE images help in judging the enhancement of the lesion on postcontrast MT-SE images by allowing a comparison between the increase in signal intensity. Postcontrast MT-SE images alone may give a false impression of contrast enhancement of all the lesions, even when there is no breach in the blood-brain barrier (20). Detectability of more lesions on precontrast MT-SE images that do not enhance after contrast injection suggests a lack of breach of the blood-brain barrier in some of the lesions. In a patient with multiple tuberculomas, the lesions may respond to medical therapy differently from one another (that is, resolve at different rates), and similar-appearing lesions in different patients may respond to medical treatment differently (4). The improved estimate of the disease load on precontrast MT-SE images may help to better assess the response to specific therapy.
The lesions with a T2 hypointense central core showed significantly lower MT ratios than those of white and gray matter. Lesions not visible or appearing hyperintense had higher MT ratios than the lesions with a T2 hypointense core. Although these lesions showed significantly lower MT ratios than white matter, these were insignificant compared with the MT ratios of the cortex, suggesting that such lesions may not be visible when located in the cortex. Five of the 90 lesions were seen only on postcontrast MT-SE images, and all were located in the cortex. It is probably because of the insignificant difference in the MT ratios between the cortex and T2-invisible lesions that these lesions were not visible on precontrast MT-SE images.
The T2 hypointense lesions had the lowest MT ratios relative to the other two groups. Pathologically, the hyperintense and isointense (invisible) lesions are the solid granulomas with minimal or no caseation (5). With increased caseation, lesions tend to appear hypointense on T2-weighted images (5). The caseation in a tuberculoma is composed predominantly of lipids and amino acids, as has been documented with proton MR spectroscopy (6). Lipids are not known to show MT (7). The presence of lipids as the major macromolecular constituent of the caseating granulomas as compared with noncaseating granulomas is probably responsible for the lower MT ratios in the former.
Cysticercus granulomas are the major cause of seizures in inhabitants of developing countries. The late degenerating and healing stages of cysticercus granuloma simulate tuberculoma on conventional pre- and postcontrast MR images (4). T2 hypointense cysticercus granulomas have a significantly higher MT ratio than do similar-appearing tuberculomas, and are of low visibility, especially when located in the white matter (23). T2 hypointense tuberculomas have shown much lower MT ratios as compared with gray and white matter, and are prominent on precontrast MT-SE images. We believe that quantitation of the MT ratios may help differentiate these similar-appearing infective granulomas and thus aid in the lesion-specific targeting of appropriate therapy.
Conclusion
Precontrast MT-SE imaging helps to better assess the disease load in CNS tuberculosis owing to improved lesion detection. Quantitative MT may differentiate T2 hypointense lesions of tuberculous origin from similar-appearing lesions of neurocysticercosis. Inflamed meninges in tuberculous meningitis show significantly different MT ratios than those of inflamed meninges in meningitis of nontuberculous origin. We believe that quantitative MT imaging may provide additional information in cases of suspected CNS infection.
Footnotes
Address reprint requests to Rakesh K. Gupta, MD, Additional Professor, MR Section, Department of Radiology, Sanjay Gandhi Post-Graduate Institute of Medical Sciences, Lucknow 226014, India.
References
- 1.Hopewell PC. Overview of clinical tuberculosis. In: Bloom BR, ed. Tuberculosis: Pathogenesis, Protection and Control. Washington, DC: American Society of Microbiology; 1994:25–46
- 2.Jinkins JR. Computed tomography of intracranial tuberculosis. Neuroradiology 1991;33:126-135 [DOI] [PubMed] [Google Scholar]
- 3.Gupta RK, Jena A, Sharma A, Guha DK, Khushu S, Gupta AK. MR imaging of intracranial tuberculomas. J Comput Assist Tomogr 1988;12:280-285 [DOI] [PubMed] [Google Scholar]
- 4.Jinkins JR, Gupta R, Chang KH, Carbajal JR. MR imaging of central nervous system tuberculosis. Radiol Clin North Am 1995;33:771-786 [PubMed] [Google Scholar]
- 5.Poptani H, Gupta RK, Roy R, Pandey R, Jain VK, Chhabra DK. Characterization of intracranial mass lesions with in vivo proton MR spectroscopy. AJNR Am J Neuroradiol 1995;16:1593-1603 [PMC free article] [PubMed] [Google Scholar]
- 6.Gupta RK, Roy R, Poptani H, et al. Finger printing of Mycobacterium tuberculosis in intracranial tuberculomas using in vivo, ex vivo and in vitro proton MR spectroscopy. Magn Reson Med 1996;36:829-833 [DOI] [PubMed] [Google Scholar]
- 7.Woff SD, Balaban RS. Magnetization transfer contrast (MTC) and tissue water proton relaxation in vivo. Magn Reson Med 1989;10:135-144 [DOI] [PubMed] [Google Scholar]
- 8.Dousset V, Grossman RI, Ramer KN, et al. Experimental allergic encephalomyelitis and multiple sclerosis: lesion characterization with magnetization transfer imaging. Radiology 1992;182:483-491 [DOI] [PubMed] [Google Scholar]
- 9.Kurki TJI, Niemi PT, Lundborn N. Gadolinium-enhanced magnetization transfer contrast imaging of intracranial tumors. J Magn Reson Imaging 1992;2:401-406 [DOI] [PubMed] [Google Scholar]
- 10.Finelli DA, Hurst GC, Gullapali RP, Bellon EM. Improved contrast of enhancing brain lesions on postgadolinium, T1-weighted spin echo images with use of magnetization transfer. Radiology 1994;190:553-559 [DOI] [PubMed] [Google Scholar]
- 11.Elster AD, King JC, Mathews VP, Hamilton CA. Cranial tissues: appearance at gadolinium-enhanced and nonenhanced MR imaging with magnetization transfer contrast. Radiology 1994;190:541-546 [DOI] [PubMed] [Google Scholar]
- 12.Mathews VP, King JC, Elster AD, Hamilton CA. Cerebral infarction: effects of dose and magnetization transfer saturation at gadolinium-enhanced MR imaging. Radiology 1994;190:547-552 [DOI] [PubMed] [Google Scholar]
- 13.Boorstein JM, Wong KT, Grossman RI, Bolinger L, McGowan JC. Metastatic lesions of the brain: imaging with magnetization transfer. Radiology 1994;194:799-803 [DOI] [PubMed] [Google Scholar]
- 14.Mehta RC, Bruce Pike G, Enzmann DR. Magnetization transfer MR of the normal adult brain. AJNR Am J Neuroradiol 1995;16:2085-2091 [PMC free article] [PubMed] [Google Scholar]
- 15.Mehta RC, Bruce Pike G, Patricia Haros S, Enzmann DR. Central nervous system tumor, infection and infarction: detection with the gadolinium enhanced magnetization transfer MR imaging. Radiology 1995;195:41-46 [DOI] [PubMed] [Google Scholar]
- 16.Runge VM, Welle JW, Williams NM, Lee C, Timoney JF, Young AB. Detectability of early brain meningitis with magnetic resonance imaging. Invest Radiol 1995;30:484-495 [DOI] [PubMed] [Google Scholar]
- 17.Mehta RC, Bruce Pike G, Enzmann DR. Measure of magnetization transfer in multiple sclerosis demyelinating plaques, white matter ischemic lesions, and edema. AJNR Am J Neuroradiol 1996;17:1051-1055 [PMC free article] [PubMed] [Google Scholar]
- 18.Niemi PT, Komu MES, Koskinen SK. Tissue specificity of low field strength magnetization transfer contrast imaging. J Magn Reson Imaging 1992;2:197-201 [DOI] [PubMed] [Google Scholar]
- 19.Zuger A, Lowy FD. Tuberculosis. In: Scheld WM, Whitley RJ, Durack DT, eds. Infections of the Central Nervous System. 2nd ed. New York: Lippincott-Raven; 1997:417–444
- 20.Meyer JR, Androux RW, Salamon N, et al. Contrast-enhanced magnetization transfer imaging of the brain: importance of precontrast images. AJNR Am J Neuroradiol 1997;18:1515-1521 [PMC free article] [PubMed] [Google Scholar]
- 21.Reid H, Fallon RJ. Bacterial infections. In: Adams JH, Duchen LW, eds. Neuropathology. 5th ed. London: Edward Arnold; 1992:302–334
- 22.Okumura A, Kuwata K, Takenaka K, et al. Pulsed off-resonance magnetization transfer for brain tumor in patients. Neurol Res 1998;20:313-319 [DOI] [PubMed] [Google Scholar]
- 23.Kathuria MK, Gupta RK, Roy R, Gaur V, Husain N, Pradhan S. Measurement of magnetization transfer in different stages of neurocysticercosis. J Magn Reson Imaging 1998;8:473-479 [DOI] [PubMed] [Google Scholar]


