Abstract
BACKGROUND AND PURPOSE: MR imaging has been proved to be effective in depicting wide variety of pathologic changes of the salivary gland. Therefore, we evaluated clinical usefulness of MR imaging for sialolithiasis.
METHODS: Sixteen patients with sialolithiasis of the submandibular gland underwent MR imaging. MR images of the glands were obtained with a conventional (T1-weighted), fast spin-echo (fat-suppressed T2-weighted) and short inversion time–inversion recovery sequences. Contrast enhancement was not used. MR imaging features then were compared with clinical symptoms, histopathologic features of excised glands, and CT imaging features.
RESULTS: Submandibular glands with sialolithiasis could be classified into three types on the basis of clinical symptoms and MR imaging features of the glands. Type I glands were positive for clinical symptoms and MR imaging abnormalities, and were characterised histopathologically by active inflammation (9 [56%] of 16). Type II glands were negative for clinical symptoms and positive for MR imaging abnormalities (4 [25%] of 16), and the glands were replaced by fat. Type III glands were negative for clinical symptoms and MR imaging abnormalities (3 [19%] of 16). CT features of these glands correlated well with those of MR imaging.
CONCLUSION: These results suggest that MR imaging features may reflect chronic and acute obstruction, and a combination of CT and MR imaging may complement each other in examining glands with sialolithiasis.
Bacterial and viral infections are among the most common causes of sialoadenitis. Bacterial infections commonly ascend from the oral cavity because of decreased salivary flow (1). A wide variety of entities can decrease salivary flow. These include trauma, surgery, radiation, and Sjögren's syndrome. Diseases that obstruct the salivary duct, such as tumors and sialolithiasis, may cause sialoadenitis. An incomplete obstruction by a sialolith may be associated with secondary infection of the gland, and when a complete obstruction continues, glandular atrophy eventually occurs.
Sialolithiasis most commonly occurs in the submandibular glands at a rate reportedly fluctuating between 80% and 95% (1, 2). Imaging diagnoses are performed primarily by plain radiography in order to assess the number, location, and size of sialoliths. Conventional sialography may be performed to examine the state of the duct, which may be dilated or of normal appearance. In cases of large sialoliths, the proximal portion is not visible owing to complete obstruction. It is not uncommon for sialography to reveal a non- or partially calcified sialolith in the duct. None of the above methods, however, can enable reliable assessment of the state of gland parenchyma affected by sialolithiasis; they can suggest merely the state.
MR imaging has been proved useful in the diagnosis of several diseases of the salivary glands, including benign and malignant tumors, Sjögren's syndrome, and infections (3–6). In this study, we evaluated the MR features of the submandibular gland affected by sialolithiasis and correlated these changes with clinical symptoms and histopathologic features of excised glands.
Methods
Patient Selection
Sixteen patients with sialolithiasis of the submandibular gland (eight women and eight men; average age, 51 years; age range, 15–71 years) were studied prospectively by MR imaging. The patients were selected by plain radiographic examination, which demonstrated a solitary or multiple calcified sialolith-like structure in the submandibular region. At the initial examinations, nine of the 16 patients complained of clinical symptoms such as pain and swelling very suggestive of sialolithiasis, but the remaining patients did not. The presence of sialoliths in the asymptomatic patients was found incidentally by radiographic examinations for other reasons such as mandibular diseases and dental caries. These patients had no history of disease or receiving drugs such as corticosteroids that could affect the salivary gland function. The presence, location, and size of the sialoliths were confirmed by CT examinations. We did not perform conventional sialography. Diagnosis of sialolithiasis was made eventually at surgery, confirming the presence of sialolith(s) in the duct of the submandibular gland. All patients were classified tentatively into three groups on the basis of clinical symptoms such as pain and swelling. Then, affected glands were characterised further by MR imaging features. The characterisation of MR imaging features of each affected gland was performed by comparing it with the healthy gland on the opposite side of the same patient.
MR Imaging
All 16 patients with sialolithiasis of the submandibular gland were imaged with a 1.0-T MR imaging system (Expert, Siemens Medical Systems, Erlangen, Germany) or a 1.5-T MR imaging system (Horizon, General Electric Medical Systems, Milwaukee, WI). A neck coil was used for imaging of the submandibular and sublingual glands. Axial T1-weighted (530/17/2 [TR/TE/excitations] or 500/14/2) and fat-suppressed T2-weighted (3200/96/2 [TR/TE/excitations] or 3000/96/2) images were obtained by use of a conventional and fast spin-echo sequence, respectively. The section thickness was 4 mm for all sequences. The short inversion time–inversion recovery (STIR) sequence also was used to suppress fat components (2000/14/160/2 [TR/TE/inversion time/excitations]). MR imaging was performed using a 256 × 256 matrix without interslice gap. We did not use contrast enhancement.
CT Imaging
Using a CT system (HighSpeed Advantage, General Electric Medical Systems, Milwaukee, WI) with or without contrast enhancement, imaging was performed on the submandibular glands of all 16 patients with sialolithiasis. After intravenous injection of 100 mL of contrast medium (iopamidol, Iopamiron 300, Schering, Germany), axial images of 4-mm thickness were obtained and used for assessment of the number, location, and size of sialoliths. The size of each sialolith was expressed as a maximal diameter determined on sequential 2–4 images (window level = 500 HU, window width = 3000 HU) obtained from each of the patients. All sialoliths were measured directly after surgical removal. In general, sialolith size was found to be underestimated on CT images, probably because of thin soft tissues covering the calcified core. The location of each sialolith was classified into one of the following categories: distal one third, middle one third, or proximal one third of the duct.
Evaluation of Imaging Findings
MR and CT images obtained from the 16 patients were interpreted by two radiologists who were blinded to clinical information of the patients. In most cases, similar results were obtained from these readers. In cases where the interpretation of images was different between the two readers, the final decision was made by consensus between them.
Treatment and Prognosis
Surgery was performed on all 16 patients. Of these, four patients underwent radical excision of the submandibular gland and Wharton's duct together with the sialolith(s). In the remaining patients, sialoliths were removed via incisions on Wharton's duct. All of the patients' symptoms had improved after surgery, and no further surgery was needed at the time of preparing this report. Additional MR examinations were performed on two patients who had undergone surgical removal of sialolith(s) to assess interval changes after surgery.
Results
Correlation of Symptoms and MR Imaging Findings
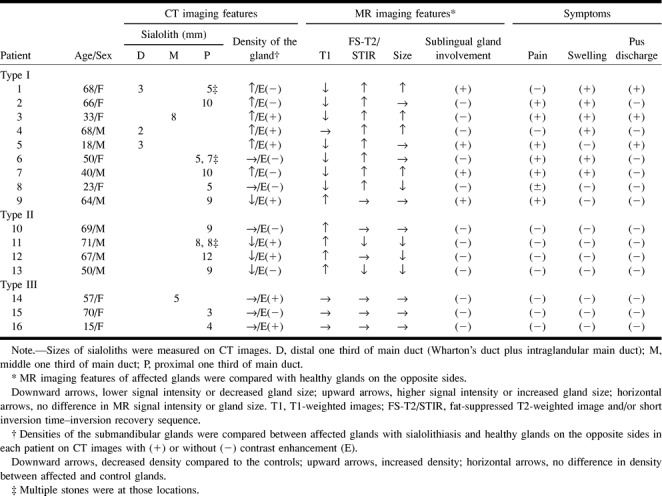
On the basis of clinical symptoms and MR imaging features, sialolithiasis of the submandibular gland could be categorised into three types (Table). Clinical symptoms related to sialolithiasis were noted only in the type I patients. Patients of the other two types had no symptoms and no history of symptoms. In the type I group, there was no correlation between acuity of symptoms and MR imaging findings. The interval between the onset of symptoms and the timing of MR imaging ranged from 1 week to 6 months (average interval = 7.9 weeks), and there was no difference in MR imaging findings among the patients with relatively short (less than 1 month) symptomatic intervals (patients 2, 4, and 7) and those with longer (over 1 month) intervals.
TABLE: Clinical and imaging features of 16 patients with sialolithiasis of submandibular gland
Type I Patients
The type 1 patient was characterised by lower signal intensities on T1-weighted images and higher signal intensities on fat-suppressed T2-weighted and STIR images of the affected gland, compared with the healthy gland on the opposite side in particular patients (Fig 1A–D). Nine (56%) of 16 patients were classified in this category. Other characteristic MR features were increases in the size of the glands, which were observed in four patients (44%). All nine patients complained of clinical symptoms such as pain and swelling. Histopathologic examinations of the excised submandibular glands from three of the type I patients showed inflammatory cells infiltrating into the gland parenchyma associated with destruction and resultant fibrosis of the gland structures (Fig 1E).
fig 1.
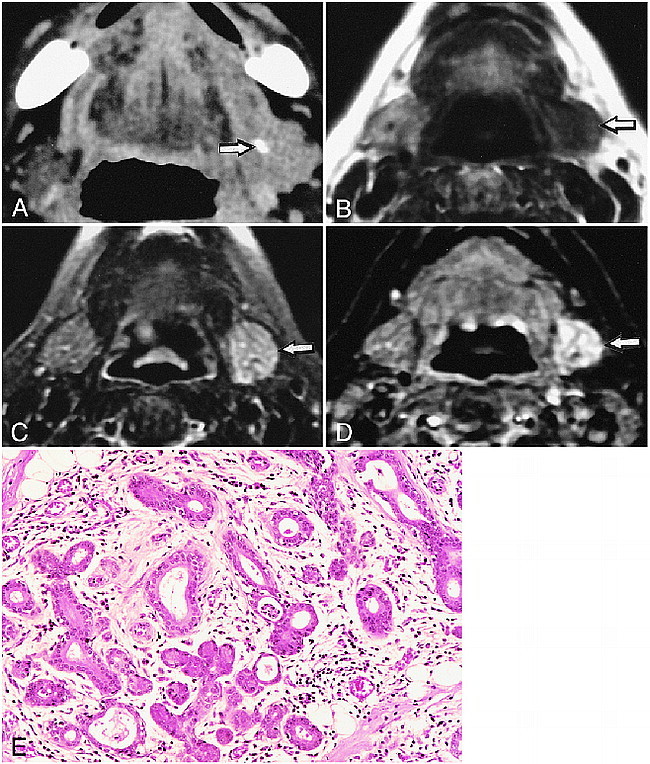
68-year-old woman with left submandibular sialolith.
A, CT shows sialolith (arrow) in hilum of the gland.
B, T1-weighted MR image (530/17/2 [TR/TE/excitations]) of affected submandibular gland (arrow) shows lower signal intensity compared with normal gland on right side.
C, Fat-suppressed T2-weighted MR image (3200/96/2 [TR/TE/excitations]) of affected submandibular gland (arrow) shows higher signal intensity than control gland (right side).
D, STIR image (2000/14/160/2 [TR/TE/inversion time/excitations]) of affected gland (arrow) shows higher signal intensity compared with normal gland on right side.
E, Photomicrograph of excised gland shows extensive infiltration of inflammatory mononuclear cells associated with destruction of gland structures and mild fibrosis. (Hematoxylin & eosin stain, original magnification, ×200)
We performed enhanced CT in four patients of this group (Table). Three of them showed contrast enhancement, but one patient did not. Of these three glands demonstrating CT enhancement, two were enlarged and one was of equivalent size compared with the corresponding glands on the opposite sides. The affected glands in three of the remaining five patients exhibited increased densities on plain CT images relative to those of the normal side. The average diameter of sialoliths was 5.8 ± 2.9 mm. Sialoliths in the distal one third of the main duct were smaller than those in the more proximal parts of the main duct (middle and proximal one third). Sialoliths localized in the distal one third of the main duct (Wharton's duct and intraglandular main duct) were also characteristic features observed in this patient group (Fig 2A, Table).
fig 2.

18-year-old man shows concomitant involvement of sublingual and submandibular glands.
A, CT shows sialolith (arrow) near orifice of main duct.
B and C, Fat-suppressed T2-weighted (3200/96/2 [TR/TE/excitations]) and STIR MR (2000/14/160/2 [TR/TE/inversion time/excitations]) images show increased signal intensity of left sublingual gland (arrows).
It was noteworthy that in two patients (patients 1 and 5), where a small sialolith was present near the orifice of the main duct, the sublingual glands demonstrated decreased signal intensities on T1-weighted images and increased fat-suppressed T2-weighted and STIR images as shown in the submandibular glands (Fig 2).
We performed follow-up studies on two patients with symptomatic submandibular glands who had undergone surgical removal of sialolith(s). Four and 5 months after surgical removal of sialoliths, MR examinations in both patients demonstrated that the sizes and signal intensity levels had returned to parity with those of the glands on the opposite sides (Fig 3).
fig 3.
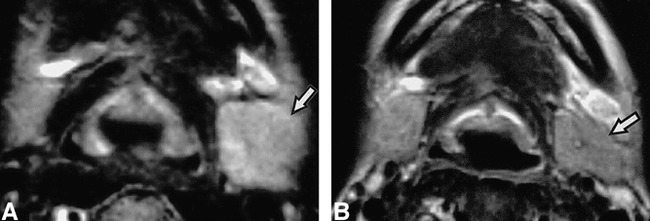
Recovery of affected submandibular gland after surgical removal of sialolith.
A and B, Fat-suppressed T2-weighted images (3000/96/2 [TR/TE/exciations]) of 33-year-old woman show that the signal intensity level of the left submandibular gland (arrow) has returned to that of the normal gland (right side) 4 months after surgical removal of sialolith. A, before surgery; B, after surgery.
Type II Patients
Four patients had submandibular glands that were characterised by fatty infiltration and atrophy compared with the healthy gland on the opposite side. The affected glands showed higher signal intensities on T1-weighted images than those of the healthy gland on the opposite side (Fig 4B, Table). The contour of the affected gland was not evident on CT images (Fig 4A). On fat-suppressed images, these glands showed signal intensities equivalent to or lower than those of the healthy glands on the opposite sides (Fig 4C).
fig 4.
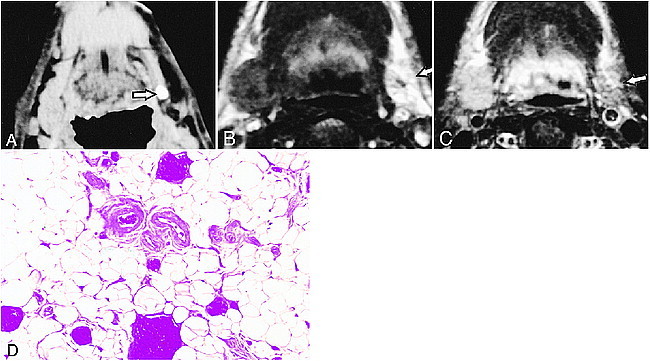
50-year-old man with left submandibular sialolith.
A, CT shows sialolith (arrow) in proximal one third of main duct. Affected gland is atrophic.
B, T1-weighted MR image (500/14/2 [TR/TE/excitations]) of affected gland (arrow) shows higher signal intensity compared with gland on right side.
C, Fat-suppressed T2-weighted MR image (3000/96/2 [TR/TE/excitations]) shows lower signal intensity compared with normal right side.
D, Photomicrograph of excised gland shows extensive fat replacement of gland tissues. Original magnification, ×200.
Enhanced and nonenhanced CT in this patient group demonstrated that three of the glands were low in density compared with normal glands (Table). The sialoliths were the largest of the three patient groups, with a mean size of 9.2 ± 1.6 mm, and were all located in the proximal one third of the main duct. All patients were free from any clinical symptoms or any history of pain or swelling in the submandibular region. Excised submandibular glands from a single patient in this group showed extensive replacement of the gland tissues by fat (Fig 4D).
Type III Patients
Type III patients were asymptomatic, had no history of symptoms, and had MR features indistinguishable from the healthy glands on the opposite side (Fig 5, Table). CT with or without contrast enhancement showed that the affected glands were isodense relative to the normal glands. The size of sialoliths was relatively small, with a mean diameter of 4.0 ± 1.0 mm.
fig 5.
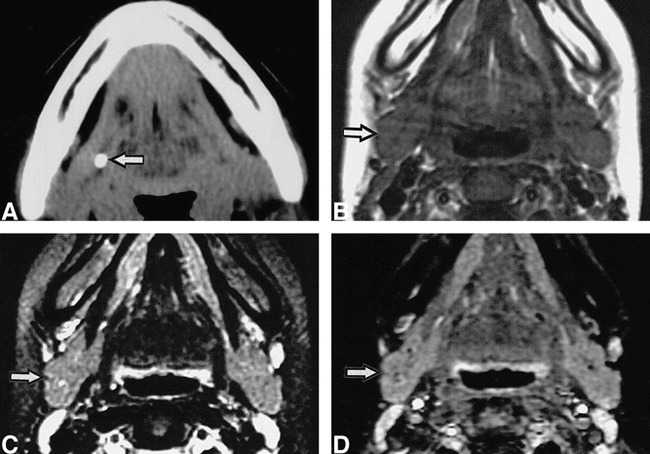
15-year-old girl with right submandibular sialolith.
A, CT shows sialolith (arrow) in proximal one third of main duct.
B, C, and D, T1-weighted (530/17/2 [TR/TE/excitations])(B), fat-suppressed T2-weighted (3200/96/2 [TR/TE/excitations]) (C), and STIR (2000/14/160/2 [TR/TE/inversion time/exciations])(D) MR images show no apparent difference between affected (arrow) and normal glands (left side).
Extraglandular Involvement by Sialolithiasis
The present study population included two patients (patients 7 and 9) who presented extensive involvement of the disease, where infection had extended beyond the submandibular glands into the surrounding anatomic structures and spaces (Fig 6, Table 1 [patient 9]). Contrast-enhanced CT demonstrated a large abscess surrounding a sialolith (Fig 6A). At surgery, this CT feature was confirmed to represent an abscess formation in the extraglandular space. Although the size was not different from that of the normal glands, a greater part of the affected gland was replaced by fatty tissue. A broad-rim enhancement around the abscess was evident on enhanced CT images. MR examination indicated that the area of cellulitis had extended further than that depicted with CT, showing extension through the floor of the mouth into the sublingual gland and the parapharyngeal space (Fig 6B).
fig 6.
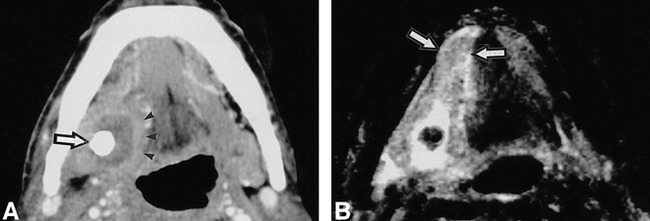
64-year-old man shows abscess formation in the extraglandular space.
A, Enhanced CT shows abscess formation around a large sialolith (arrow) in right floor of the mouth, demarcated by a slightly enhanced, broad rim (arrow heads). It was confirmed at surgery thas this sialolith was penetrating the duct wall.
B, T2-weighted MR image (3000/96/2 [TR/TE/excitations]) shows extension of inflammation in the floor of the mouth, beyond affected gland involving right sublingual gland (arrow).
Discussion
We have described the MR imaging spectrum of sialoadenitis associated with sialolithiasis of the submandibular gland, and classified the affected glands into three types based on the MR imaging features and clinical symptoms. The type I pattern indicates the presence of active inflammation of the glands and is associated with decreased signal intensities on T1-weighted images, with concomitant increased signal intensities on fat-suppressed T2-weighted and STIR images. Increased gland size, which was present in half of the patients in the type I group, and symptomatic glands, which were present in all patients of this group, indicate that these glands were in active states of inflammation (1). We performed histopathologic analysis of the affected glands from three patients (patients 1, 7, and 9) categorised as type I. Of these patients, two glands (patients 1 and 7) demonstrated active inflammation and supported the view that the type I glands were associated with active inflammation. A single exception was noted in patient 9, who had symptoms, but showed type II imaging features, suggestive of fat infiltration. Histopathologic analysis of the gland from this patient demonstrated active inflammation and fat infiltration. The inflammation had extended into the surrounding oral floor.
In two of the type I patients, the reversible nature of inflammation in the glands was evidenced by the observations that abnormal MR imaging features of the affected glands had returned to parity with those of the normal sides within several months after removal of the sialolith(s). These results suggest that the disease minimally affected the glands in these two patients and that simply removing sialolith(s) could preserve the gland function.
The type II pattern exhibited MR and clinical features totally different from those found in the type I category. These glands were asymptomatic, demonstrated fat infiltration of the gland, and the gland size was smaller in 75% of these patients. We counselled these patients to consider surgical removal of the sialoliths and atrophic glands because of the risk of secondary infection owing to impaired salivary flows. Thus, we excised the affected gland from one of these type II patients after obtaining informed consent. Histopathologic studies confirmed the fat in the excised gland obtained from this patient. In the other three type II patients, only ductal stones were removed.
Type III patients had no apparent abnormalities on MR images, no symptom or history of pain or swelling, and relatively small sialoliths suggestive of incomplete obstruction of the gland. To prevent symptoms caused by secondary infection, we removed these stones.
It is reasonable to consider that the MR imaging pattern may reflect the chronic and acute nature of the obstruction. In this context, type I patients are those with relatively acute and incomplete obstruction associated with secondary infection. Type II patients are those with chronic and complete obstruction, but this obstruction is not associated with secondary infection. Type III patients are those with a nonobstructing or partially obstructing sialolith without secondary infection. On the other hand, involvement of the sublingual gland, as evidenced by MR imaging (patients 1 and 5), was associated with pus discharge from the orifice of the gland. A sialolith located near the orifice was not always associated with sublingual gland involvement and pus discharge from the orifice, or vice versa. Furthermore, a patient with pus discharge (patient 3) had a stone in the middle part of the main duct yet he did not have any abnormal MR imaging features of the sublingual gland on MR.
CT was also able to depict some active inflammatory changes in the glands affected by sialolithiasis. In six of the nine patients with glands classified as type I, CT showed that, compared with the healthy glands on the opposite sides, the affected glands had increased density or enhanced after contrast medium injections, suggesting active inflammation or increased vascularity of the affected gland (1). On the other hand, the glands classified as the type II atrophic group associated with fat deposition showed decreased densities in comparison with the healthy glands on the opposite sides even after contrast enhancement, reflecting, at least in part, fat deposition in atrophic glands. On the other hand, in the type III patient group, MR imaging demonstrated no evident pathologic change of the affected gland, and CT images of the glands were indistinguishable from those on the opposite sides. Taken together, findings from MR imaging were well correlated with those from CT imaging.
The benefits of MR imaging are twofold. First, MR imaging can depict the status of the gland parenchyma affected by sialolithiasis. Sialography and CT are useful in obtaining the information about a sialolith, but the information about the gland itself is limited compared with MR imaging. For example, sialography cannot demonstrate the gland change when a sialolith completely obstructs the duct. CT cannot demonstrate sublingual gland sialoadenitis caused by stones located near the orifice, and fat infiltration in the gland is more visible with MR imaging than with CT (7). Second, MR does not require the cannulation of the duct, which cannot be achieved every time. Furthermore, retrograde injection of contrast material may exacerbate the inflammation of the gland. In addition, MR sialography could replace the conventional sialography in depicting the dilated duct and also the sialolith in it. MR sialography was postulated as an alternative for the conventional sialography in diagnosing Sjögren's syndrome (8). Taken together, an overall view may be that although in a proper clinical setting of a suspected calculus, CT should be performed in order to identify the calculus. Parenchymal changes of the submandibular and sublingual glands are more visible with MR imaging than with CT.
In conclusion, MR imaging features of the submandibular glands affected by sialolithiasis were well correlated with the clinical features of the patients and with CT features of the gland. In this context, MR imaging, using T1-weighted and fat-suppressed T2-weighted and STIR sequences, can provide effective information about the pathologic status of the gland parenchyma affected by sialolithiasis. Furthermore, the extent and chronic nature of this obstruction may reflect the MR imaging findings of the gland parenchyma. A combination of MR and CT studies may complement each other, and may offer a promising diagnostic strategy for treatment and follow-up studies in sialolithiasis.
Footnotes
Address reprint requests to Dr. Takashi Nakamura, Department of Radiology and Cancer Biology, Nagasaki University School of Dentistry, 1–7–1 Sakamoto, Nagasaki 852-8588, Japan
References
- 1.Som PM, Brandwein M. Salivary glands. In Som PM, Curtin HD, eds. Head and neck imaging, 3rd ed. St. Louis: Mosby, 1996: 823–914
- 2.Lustmann J, Regev E, Melamed Y. Sialolithiasis: a survey on 245 patients and a review of the literature. . Int J Oral Maxillofac Surg 1990;19:135-138 [DOI] [PubMed] [Google Scholar]
- 3.Teresi LM, Lufkin RB, Wortham DG, Abemayor E, Hanafee WN. Parotid masses: MR imaging. Radiology 1987;163:405-409 [DOI] [PubMed] [Google Scholar]
- 4.Mandelblatt SM, Braun IF, Davis PC, Fry SM, Jacobs LH, Hoffman Jr JC. Parotid masses: MR imaging. Radiology 1987;153:411-414 [DOI] [PubMed] [Google Scholar]
- 5.Izumi M, Eguchi K, Ohki M, et al. MR imaging of the parotid gland in Sjögren's syndrome: a proposal for a new diagnostic criteria. AJR Am J Roentgenol 1996;166:1483-1487 [DOI] [PubMed] [Google Scholar]
- 6.Izumi M, Eguchi K, Nakamura H, Nagataki S, Nakamura T. Premature fat deposition in the salivary glands associated with Sjögren's syndrome: MR and CT evidence. AJNR Am J Neuroradiol 1997;18:951-958 [PMC free article] [PubMed] [Google Scholar]
- 7.Sumi M, Izumi M, Yonetsu K, Nakamura T. Sublingual gland: MR features of normal and diseased states. AJR Am J Roentgenol 1999;172:717-722 [DOI] [PubMed] [Google Scholar]
- 8.Tonami H, Ogawa Y, Matoba M, et al. MR sialography in patients with Sjögren syndrome. AJNR Am J Neuroradiol 1998;19:1199-1203 [PMC free article] [PubMed] [Google Scholar]


