Abstract
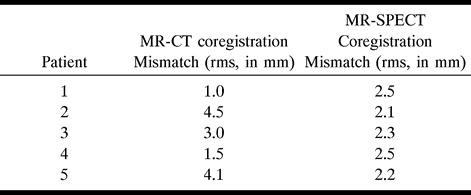
Summary: Ictal and interictal single-photon emission CT (SPECT) play an increasingly important role in the surgical evaluation of patients with epilepsy. We present a method of coregistration of MR, SPECT, and CT images to correlate structural data (MR imaging), blood flow changes (SPECT), and location of subdural electrodes (CT) for patients undergoing image-guided surgical treatment of epilepsy. MR-SPECT root mean square (rms) mismatch distances were 2.1 to 2.5 mm, and MR-CT rms mismatch distances were 1.0 to 4.5 mm. Coregistration assisted in image-guided placement of subdural electrodes and in surgical resection of the suspected epileptogenic focus.
Ictal blood flow changes are related to the region of the brain involved in epileptic seizures (1). We integrated coregistered MR images and ictal single-photon emission CT (SPECT) scans into a neurosurgical navigational system to guide stereotactic placement of intracranial electrodes, then obtained and coregistered a CT scan obtained after intracranial electrode placement to correlate structural data (MR imaging), ictal blood flow (SPECT), and intracranial electrode placement (CT) for planning epilepsy surgery. We describe our technique for coregistration of these images and report preliminary results from five patients, correlating intracranial electrographic recordings and interictal and ictal SPECT studies.
Technique
Initial evaluation of five patients with refractory partial epileptic seizures included ictal and interictal SPECT and MR imaging studies. CT scans were obtained postoperatively, after placement of subdural electrodes. MR imaging was performed on a 1.5-T Signa (General Electric, Milwaukee, WI) system. Whole-brain acquisitions were obtained in the coronal plane with a fast spoiled gradient-recalled imaging technique with parameters of 14/3 (TR/TE) and a flip angle of 30°. Voxel dimensions were 0.859 × 0.859 × 1.5 mm. The field of view was 22 × 22 cm, and the matrix size was 256 × 256. SPECT was performed on a Siemens Orbitor gamma camera, which has an axial resolution of 4.4 mm at the center of the field of view. The camera head has a diameter of 44.5 cm.
For ictal SPECT studies, 99mTc-ethyl cyteinate dimer (Tc-ECD) (DuPont Merck, N. Billerica, MA) was injected at the time of seizure activity. Doses from 555 to 1110 MBq were administered. Tomography was performed within 2 hours after injection, when the patient had stabilized and/or had been sedated. Interictal studies were performed at least 12 hours after a seizure-free period, with injection of Tc-ECD as above.
Imaging was performed using 64 stops in a 360° rotation. Stop time was 30 seconds. No attenuation correction was performed. Images were reconstructed using filtered back-projection with a Butterworth filter of 0.55 cutoff. Image pixel size was 6.2 mm in a 64 × 64 array.
CT was performed on a General Electric CTi scanner. Whole brain acquisitions were obtained in the axial plane. Voxel dimensions were 0.488 × 0.488 × 3 mm. The field of view was 25 × 25 cm, and the matrix size was 512 × 512.
Data from MR imaging and SPECT (ictal and interictal) studies were incorporated into a dedicated workstation for coregistration using the ANALYZE version 7.5 software system (Biomedical Imaging Resource, Mayo Foundation, Rochester, MN). The MR studies were converted to 8-bit images and reformatted to cubic voxel dimensions. Binary images were produced to best emphasize the cortical surface of the brain by manually adjusting intensity thresholds. Interactive 3D segmentation of the brain was then performed as described previously (2). “Erosion” and “autoconnect” program functions were performed in one or two iterations, depending on the presence of signal from extraparenchymal structures after the first iteration. We then performed multiple “conditional dilate” operations, usually using one more iteration than the erosion and autoconnect iterations. Whole brain volumes were recorded from the binary reformatted MR images.
SPECT scans were converted to binary, again using thresholding to best approximate the cortical brain surface, followed by an “autoconnect” step. The SPECT brain volume was then measured. The steps were repeated, changing threshold values as needed, until the binary SPECT volume matched the MR volume to within 3%.
Binary MR and SPECT 3D-rendered studies were then surface matched using the binary MR as the base volume and the binary SPECT as the match volume. This coregistration uses a champher matching technique. Champher matching is accomplished by performing a distance transformation that converts a binary-level image into a gray-level image. This technique has been fully described previously (3). Pixel dimensions from both images were considered during the fit. Default parameters were used for surface matching, with the exception of increasing the number of points sampled to 250. The final voxel dimension of the processed SPECT scans matched the MR imaging voxel dimension, which was 0.859 mm. This method of surface matching coregistration has been described previously (4).
Coregistered ictal and interictal SPECT scans, as well as initial video scalp EEG telemetry results, were carefully reviewed for planning intracranial electrode placement. For intraoperative intracranial electrode placement, MR and coregistered ictal SPECT studies were integrated into a neurosurgical navigational system (StealthStation, Sofamor Danek Inc, Memphis, TN). This system provides intraoperative positional information using imaging data obtained preoperatively. The navigational system uses a registration probe and surgical instrumentation, which have light-emitting diodes (LEDs) that emit infrared light. The position of these LEDs on the various instruments is tracked by an array of three charge-coupled devices (CCDs) suspended from the ceiling of the surgical suite. The infrared light is focused onto the CCDs and the position of the LEDs is determined by triangulation. A reference arc, with five LEDs, is attached to the clamp holding the head and allows independent tracking of head position during surgery. Positional information from all components is transmitted to the workstation, which correlates the position of the instruments to that of the head (5).
The image data sets are registered to the surgical field by correlating the position of the fiducials in the operating room to their position on the image data sets. This is performed intraoperatively after inducing general endotracheal anesthesia or injecting a local anesthetic, applying a head clamp, and attaching the reference arc to the head clamp. The fiducials are then touched with a registration probe while indicating which fiducial is being registered using the workstation software. This process is repeated for each fiducial. Once registered, the position of either the probe or the surgical instrument can be continuously displayed by the workstation using images oriented in three orthogonal planes as well as a 3D view of the entire preoperative image data set. A surgical planning program permits the selection of entry and target points, with the resultant approach indicated on the 2D and 3D images.
The system can also display positions on two oblique views, which depict the current position of the instrument and what is ahead of the instrument. The triorthogonal views provide standard positional information while the navigational views enable the surgeon to travel a predetermined surgical path to the desired target.
After intracranial electrode placement, patients underwent CT. Voxel dimensions were 0.590 × 0.590 × 3 mm. CT data were transported to an independent computer workstation. Using ANALYZE version 7.5 software, scans were converted to 8-bit images and reformatted to cubic voxel dimensions. Cubic voxel, 8-bit MR, and CT data were then converted to binary images, using thresholding to best emphasize the skin surface. Binary MR and CT studies were then surface matched using the binary MR as the base volume and the binary CT as the match volume. The surface matching coregistration algorithm was as described for the MR-SPECT coregistrations. Final matched CT voxel dimensions were 0.859 mm. For 3D visualization of intracranial electrodes, CT scans were thresholded to incorporate approximately only the upper 15% of gray-scale intensities. Figure 1A shows a volumetric CT scan segmented to depict the external surface. Figure 1B is the same scan reformatted by thresholding to include only the upper 15% of gray-scale intensities, which shows the 3D representation of subdural grid and strip electrodes.
fig 1.

A, CT scan shows segmentation to illustrate the external surface.
B, Same scan as A reformatted by thresholding to include only the upper 15% of gray-scale intensities to depict a representation of the subdural grid and strip electrodes.
In ANALYZE 7.5 (for the final 3D reconstruction of coregistered MR, SPECT, and CT scans), MR images were reformatted by using program functions “image algebra, grayfile*binfile,” with the original MR images as “grayfile” and the previously segmented MR images (used to match the MR and SPECT scans) to best define the cortical surface as “binfile.” This produced a gray-scale image with a surface corresponding to the cortical surface. Coregistered SPECT scans were manually thresholded to best outline the areas of perfusion changes. MR images were loaded in “volume render,” with “multiple objects = on.” Within multiple objects, MR images were used as originals and coregistered SPECT and CT scans as objects. Display for both objects was on. Binary CT representations of the intracranial electrodes were set “opacity = 1.00” and “opacity thickness = all.” “Transparency” was changed to “on.” Other settings were default positions. After planning the neurosurgical resection using the 3D triple-technique coregistered images, which included correlating electrocorticographic studies with intracranial electrode placement, these images were again integrated into the neurosurgical navigational system for intraoperative guidance during resections for epilepsy surgery.
Case Material
During coregistration of the images, the root mean square (rms) distances of matched binary images were as in Table 1. Table 2 shows the regions of SPECT perfusion change, EEG seizure onset, region of epilepsy surgery resection, and results of seizure control after surgery.
TABLE 1:
Root mean square (rms) distances of matched binary images in five partients

TABLE 2:
Regions of SPECT perfusion change, EEG seizure onset, region of epilepsy surgery resection, and postoperative results of seizure control

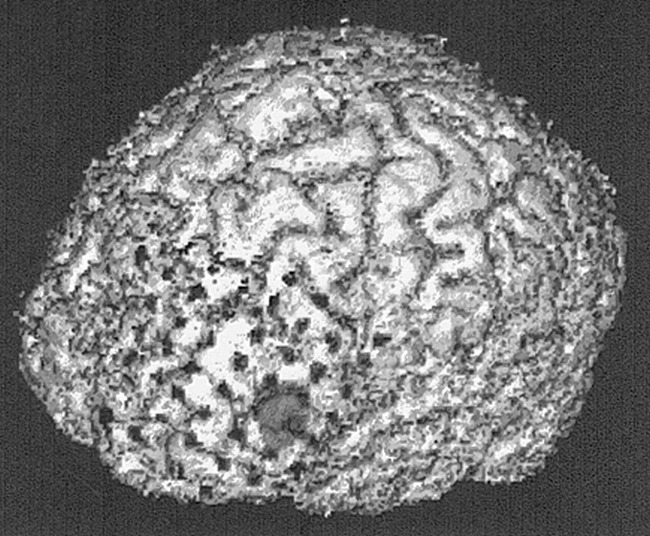
Figure 2 depicts a triple-technique coregistration from patient 1, showing the left frontal convexity from a lateral position. This 16-year-old patient had a 4-year history of epileptic seizures that had been refractory to antiepileptic drugs. Epileptic seizures involved both episodes of arrested activity and tonic posturing of the right upper extremity. Interictal EEG showed left frontal epileptiform discharges. Ictal scalp surface EEG recordings showed nonlateralizing desynchronization at seizure onset. The area of hyperperfusion on SPECT scans, acquired after Tc-ECD injection during an episode of arrested activity, was anatomically located in the triangular portion of the inferior frontal gyrus. There was correlation between the ictal subdural EEG recordings with the area of hyperperfusion in only 40% of recorded seizures. Postsurgical outcome, after left frontal topectomy of the inferior frontal gyrus anterior to the frontal operculum, resulted in a 50% decrease in seizure frequency during 24 months of postoperative follow up.
fig 2.

Triple-technique (MR imaging, ictal SPECT, and CT) coregistered image for patient 1. Subdural grid electrodes cover the area of ictal hyperperfusion in the triangular region of the left inferior frontal gyrus
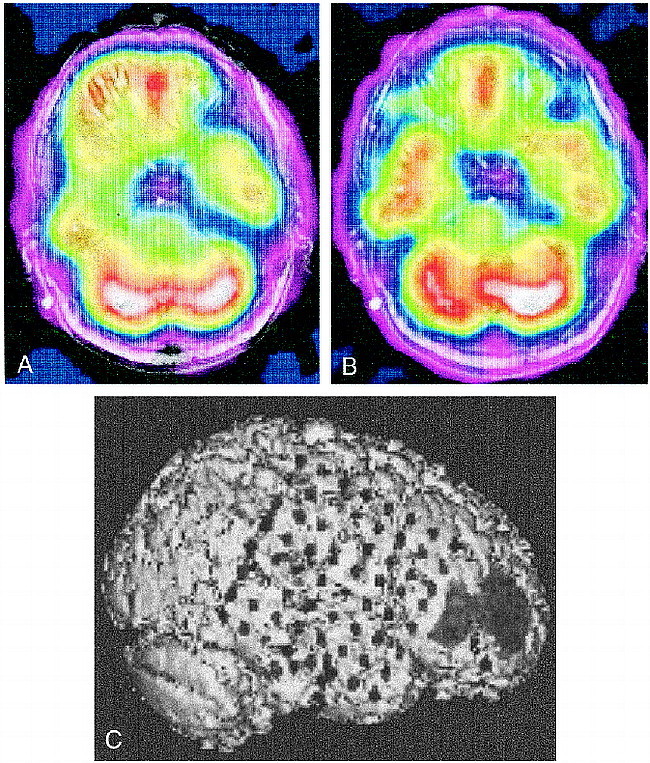
Figure 3 shows coregistered ictal and interictal SPECT scans in patient 2. Interictal scans show hypoperfusion in the right temporal region (Fig 3A), while ictal scans show symmetrical perfusion of the temporal lobes (Fig 3B). There was an area of ictal hyperperfusion in the right frontal region; therefore, the SPECT scans suggested perfusion changes in both the right temporal and right frontal regions. Triple-technique coregistration (Fig 3C), segmenting the ictal SPECT scan to highlight the area of hyperperfusion in the right frontal region, shows placement of subdural strip electrodes over the areas of perfusion change in the right temporal and frontal regions and a 64-electrode subdural grid over the right frontotemporal region. EEG results showed all seizures originated from the right subtemporal subdural strip electrodes with fast propagation to the right anterior frontal region. After partial temporal lobectomy, the patient has remained seizure-free during 20 months of postoperative follow-up.
fig 3.

A, Interictal coregistered MR-SPECT scan with right temporal hypoperfusion.
B, Ictal coregistered MR-SPECT scan shows symmetrical bitemporal perfusion. This represents a relative increase in cerebral blood flow to the right temporal region during the seizure. There was ictal hyperperfusion in the right frontal region as well.
C, Triple-technique coregistration shows subdural strip electrodes over the right temporal and frontal regions in relation to the area of ictal hyperperfusion in the right frontal region. EEG recordings localized all seizures to the right temporal region.
Discussion
Because correlation of anatomic and functional information is of critical importance in the localization of epileptogenic foci, coregistration of structural MR images with other imaging studies is especially valuable for patients with epilepsy. We describe a technique for coregistering MR, SPECT, and CT data to better correlate structural imaging findings, blood flow changes during epileptic seizures, and placement of intracranial electrodes for electrocorticographic recordings.
Others have described coregistration techniques for functional and structural imaging studies (6, 7). Use of coregistered MR and ictal SPECT studies within our neurosurgical navigational system has been helpful in stereotactic placement of intracranial electrodes and has allowed placement of electrodes near areas of ictal blood flow changes.
MR-CT coregistration mismatch showed relatively high rms distances in some cases, as compared with previous results (8, 9). However, visual inspection of the coregistrations showed close matching of anatomic structures. Because the skin surface was used for MR-CT coregistration, the high rms values were most likely due to variability of the amount of extracranial structures (ie, neck) in the field of view in each image. We made no attempt to segment extracranial structures, beyond best defining the skin surface, during the MR-CT coregistration.
We relied on visual interpretation of interictal and ictal SPECT scans to determine the area of hyperperfusion. We then manually segmented the region of involvement using intensity thresholding. Recent studies indicate that computer-aided subtraction of the interictal from the ictal SPECT scans significantly improves the usefulness of SPECT in localizing the surgical seizure focus (10, 11). This technique effectively shows differences in interictal and ictal perfusion patterns. Patient 2 (Fig 3) represents a case in which differences in interictal and ictal perfusion patterns localized the area of seizure onset. The interictal study showed a hypoperfused right temporal region, while the ictal study showed normal symmetrical perfusion. The right frontal region showed ictal hyperperfusion, which correlated with EEG propagation to that area. Use of computer-aided subtraction of the interictal from ictal SPECT scans with our technique, rather than using visual SPECT interpretation alone, may allow for more accurate placement of subdural electrodes to confirm the epileptogenic zone.
Conclusion
The preliminary results of our technique for coregistering MR, SPECT, and CT studies showed excellent correlation of ictal SPECT findings and EEG recordings in three of five patients (patients 2–4) with intractable epilepsy. The plan for EEG monitoring was altered after examining the SPECT studies in patient 2 to include coverage of the right temporal region, which eventually proved to be the epileptogenic focus. In patients 1 and 5, we did not obtain consistent localizing correlation between ictal SPECT and EEG findings, and their postoperative seizure control was poor. The results in patients 1 and 5 suggest that SPECT-measured perfusion changes may represent propagation patterns of seizures rather than the initial seizure focus in some patients. This reemphasizes the need for comprehensive evaluation of patients in planning epilepsy surgery. A larger series of patients will be necessary to better determine the relationship between EEG and SPECT changes using this coregistration technique.
Footnotes
Address reprint requests to R. Edward Hogan, MD, Department of Neurology, Saint Louis University, 3635 Vista Ave, St Louis, MO 63110.
References
- 1.Penfield W. Remarks on incomplete hypotheses for the control of cerebral circulation. J Neurosurg 1971;35:124-127 [DOI] [PubMed] [Google Scholar]
- 2.Hohne KH, Hanson WH. Interactive 3D segmentation of MR images of the head for 3D display. J Comput Assist Tomogr 1992;16:285-294 [DOI] [PubMed] [Google Scholar]
- 3.Robb RA. Three Dimensional Biomedical Imaging.. New York: VCH Publishers; 1995:165–206
- 4.Hogan RE, Cook MJ, Kilpatrick CJ, Binns DW, Desmond PM, Morris K. Accuracy of coregistration of single photon emission computed tomography with MR images using a brain surface matching technique. AJNR Am J Neuroradiol 1996;17:793-797 [PMC free article] [PubMed] [Google Scholar]
- 5.Bucholz RD, Smith KR, McDurmott L, Baumann CK, Frank K. Frameless image guided surgery utilizing an optical digitizer. SPIE Proc 1994;2132:78-89 [Google Scholar]
- 6.Erickson BJ, Jack CR Jr. Correlation of single photon emission CT with MR image data using fiduciary markers. AJNR Am J Neuroradiol 1993;14:713-720 [PMC free article] [PubMed] [Google Scholar]
- 7.Turkington TG, Jaszczak RJ, Pelizzari CA, et al. Accuracy of registration of PET, SPECT and MR images of a brain phantom. J Nucl Med 1993;34:1587-1594 [PubMed] [Google Scholar]
- 8.Levin DN, Pelizzari CA, Chen GT, Chen CT, Cooper MD. Retrospective geometric correlation of MR, CT, and PET images. Radiology 1988;169:817-823 [DOI] [PubMed] [Google Scholar]
- 9.Pelizzari CA, Chen GT, Spelbring DR, Weichselbaum RR, Chen CT. Accurate three-dimensional registration of CT, PET, and/or MR images of the brain. J Comput Assist Tomogr 1989;13:20-26 [DOI] [PubMed] [Google Scholar]
- 10.O'Brien TJ, So EL, Mullan BP, et al. Subtraction ictal SPECT co-registered to MRI improves clinical usefulness of SPECT in localizing the surgical seizure focus. Neurology 1998;50:445-454 [DOI] [PubMed] [Google Scholar]
- 11.Zubal IG, Spencer SS, Imam K, et al. Difference images calculated from ictal and interictal technetium-99m-HMPAO SPECT scans of epilepsy. J Nucl Med 1995;36:684-689 [PubMed] [Google Scholar]


