Abstract
BACKGROUND AND PURPOSE: Our goal was to characterize the geometry of simple-lobed cerebral aneurysms and to find the absolute size of these lesions from angiographic tracings.
METHODS: Measurements of angiographic neck width (N), dome height (H), dome diameter (D), and semi-axis height (S) were obtained from tracings of 87 simple-lobed lesions located at the basilar bifurcation (BB), middle cerebral (MCA), anterior communicating (AcomA), posterior communicating (PcomA), superior cerebellar (SCA), and posterior cerebral (PCA) arteries. The following ratios were analyzed as subgroups according to location and as a collective sample: dome diameter/dome height (D/H), dome height/neck width (H/N), dome diameter/neck width (D/N), and dome height/semi-axis height (H/S). Using the parent artery as a reference, aneurysm dimensions were normalized to absolute in vivo size. Estimations were validated using angiographic markers.
RESULTS: For the entire sample, mean ratios were D/H = 1.11, D/N = 1.91, and H/N = 1.86. For the H/S ratio, the value was 1.98 for BB, MCA, and PcomA lesions and significantly smaller for the AcomA subgroup, at 1.52. The average sizes (in mm) for these dimensions were N = 3.4 for MCA, 3.0 for AcomA, 3.1 for PcomA, and 6.5 for BB; D = 6.1 for MCA, 5.9 for AcomA, 5.3 for PcomA, and 11.7 for BB; H = 5.6 for MCA, 5.0 for AcomA, 5.3 for PcomA, and 11.3 for BB. On average, BB aneurysms were twice as large as aneurysms at other locations. Good correlations were found between the scaled values for D and N, H and N, and H and D.
CONCLUSION: These results have been used to characterize the typical simple-lobed aneurysm geometry and to provide a framework for the development of a method of assessment of treatment choice and outcome on the basis of lesion geometry.
Saccular intracranial aneurysms account for 90% of the aneurysms that occur at bifurcations of the circle of Willis and its proximal branches (1). Saccular (or berry) aneurysms display a variety of complex sizes and shapes. Although aneurysms have been the target of numerous studies, precise quantitative data on the aneurysm geometry, including neck size, dome diameter, and other shape factors, remain limited. This geometric knowledge is potentially important for patient management when decisions concerning therapy must be made (eg, surgical clipping or endovascular coiling). An understanding of the geometry of aneurysms is also important for studies that seek basic information about the pathophysiology of the disease, including approaches that use computer modeling (2), biomathematical models (3, 4), in vitro experimentation with vascular phantoms (5–8), and in vivo animal models (9, 10). The need for accuracy in modeling has been emphasized by many scientists (11, 12), who point out that the results obtained are only as valid as the models themselves. Furthermore, in vitro models based on accurate geometric information are essential in the refinement of imaging techniques (13), for use as training tools (14), or for testing new therapeutic procedures (15), all of which have the potential to improve diagnosis and treatment.
To date, quantitative information on aneurysm geometry has been limited. Studies that depend on angiography must take great care to account for the magnification inherent in the imaging process. Studies based on samples obtained at autopsy are difficult and time-consuming, and, again, care must be taken to account for the differences between in vivo vasculature (distended by the systemic blood pressure) and drained, fixed, or desiccated samples. In this article, we present the results of a retrospective study with the goal of obtaining quantitative data on simple-lobed berry aneurysms from angiographic tracings. We have developed scale-independent measures of geometry, such as ratios between measurements of neck width, dome diameter, and dome height, that may be used in clinical decision-making even without knowledge of the absolute in vivo aneurysm size. We have also verified, using an external marker system, a technique (16) that scales measurements made from the tracings to in vivo sizes by using the diameter of the parent artery as a reference. Measurements were made from 82 angiograms obtained over a 5-year period. We describe the measurement technique in detail and present results that may be used to generate a typical simple-lobed aneurysm for use in numerical or in vitro simulations.
Both measurement approaches—scale-independent ratios and scale-dependent absolute sizes—provide information that can be used in deciding the method of treatment and in predicting its outcome. For example, the ratio between dome diameter and neck width can be used as a guideline in deciding between surgical or endovascular treatment (17, 18). For lesions treated endovascularly, knowledge of the diameter of the aneurysm neck is critical in predicting the completeness of embolization (16) and is also helpful for selecting an appropriate aneurysm clip when surgical intervention is chosen (19). It has also been reported that prolate spheroidal aneurysms (an indication of a small dome diameter/dome height ratio) result in a worse outcome after surgery than do more spherical lesions (20). The measurement technique that we describe may be useful in future prospective clinical trials designed to investigate aneurysm treatment strategies in a larger population.
Methods
Clinical Material
Aneurysms located at the basilar bifurcation (BB), middle cerebral (MCA), posterior communicating (PcomA), anterior communicating (AcomA), superior cerebellar (SCA), and posterior cerebral (PCA) arteries were selected for analysis. The angiograms of 163 patients with saccular aneurysms at these locations treated at our institution between 1992 and 1997 were included in the study. The majority of angiograms were digital subtraction, although a few film-screen angiograms, acquired before 1993, were used as well. The angiograms were obtained before treatment, using a standard angiographic protocol, as follows: 225 mg I/mL contrast material, injected at a rate of 7 mL/s for 1.3 seconds for vertebral injections and 8 mL/s for 1.3 seconds for internal carotid injections; images were acquired at a rate of two frames per second. The angiographic projection that best depicted the neck of the aneurysm, the parent artery, and its branches was traced by one of us immediately after treatment (see Drake et al [21] for a sample “track sheet”). The angiographic films were placed on a light box, and the outline of the aneurysm was copied onto thin tracing paper with a lead pencil. Visual contrast was maximized by maintaining low ambient light levels. Information obtained at surgery (when available) was used to resolve any ambiguities regarding the relationship between the neck and the vessel branches.
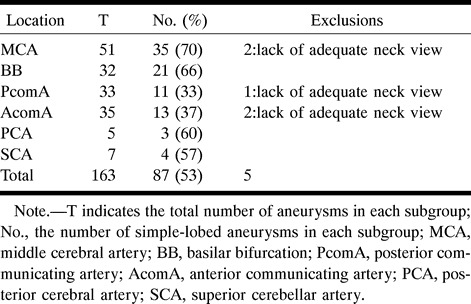
The sample of saccular aneurysms was classified into three groups on the basis of biplane angiography and preoperative findings: simple-lobed (pear-shaped, spherical, and beehive-shaped aneurysms with or without a bleb); lobulated (more than one lobule of a size comparable to that of the main aneurysm); and complex (partially thrombosed). The simple-lobed aneurysms were then selected for this study, because they were more likely to be symmetrical with respect to their central axis; hence, their 3D shape could be inferred from a single projection. The lobulated and partially thrombosed aneurysms were not analyzed, owing to their much more complicated shape and lack of circular symmetry. From the sample of 87 in the simple-lobed category, five were discarded because they lacked an explicit angiographic neck. A description of the population sample, indicating division into subgroups according to the location of the aneurysm on the circle of Willis, is presented in Table 1. The sample size of two of the subgroups (PCA and SCA) was small; we therefore refer to the remainder of the subgroups (MCA, BB, PcomA, and AcomA) as the “main” subgroups.
Table 1:
Summary of the simple-lobed aneurysms available for study, divided into subgroups according to location, and the exclusions made in order to arrive at a sample size of 82
Measurements
Aneurysm Shape Characterization: Scale-Independent Measurements
The following aneurysm dimensions, measured on the angiographic tracings displaying the best view of the neck, are illustrated in Figure 1A: the angiographic neck width (N); the dome height (H), constructed as the right bisector to the neck; the dome diameter (D), parallel to the neck and measured at the largest separation between the aneurysm walls; and the semi-axis height, measured as the distance between the neck and the dome diameter (S). These geometric characteristics were previously used in the creation of various types of aneurysm models to study flow through these lesions (22). Measurements of all dimensions were made from the innermost part of the left line to the outermost part of the right line (in order to account for the thickness of the tracing line), using a ×7 magnifying loupe (accuracy ±0.1 mm).
fig 1.
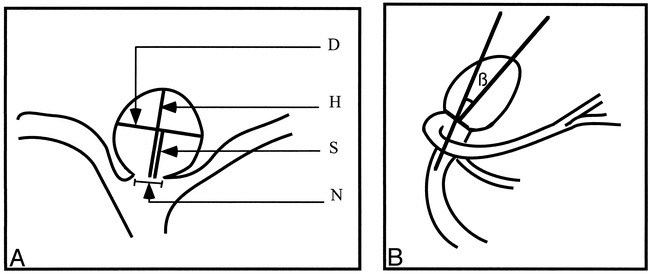
Schematic diagram of aneurysm measurements.
A, The dimensions measured on the angiographic tracings are the neck width (N), the dome diameter (D), the dome height (H), and the dome semi-axis height (S).
B, For BB aneurysms, the angle, β, at which the dome tilts with respect to the parent vessel is measured.
The relationship between the dimensions of interest can offer an indication of the aneurysm geometry if the lesion is assumed to be axially symmetrical (ie, the object can be created as a volume of revolution). The following ratios were calculated: dome diameter/neck width (D/N), dome height/neck width (H/N), dome diameter/dome height (D/H), and dome height/semi-axis height (H/S). The D/N and H/N ratios are important when trying to decide the size of the dome diameter and height for a given aneurysm neck in a model. The D/H and H/S ratios indicate the general aneurysm shape (Fig 2). In the case of D/H, the observed shape changes continuously from a vertical ellipse (D/H < 1) to a circle (D/H = 1), to a horizontal ellipse (D/H > 1) (Fig 2A). The H/S ratio describes where the maximum diameter of the aneurysm occurs with respect to the neck. The described shape varies from a pear (H/S < 2), to a circle (H/S = 2), to a beehive (H/S >2) (Fig 2B).
fig 2.
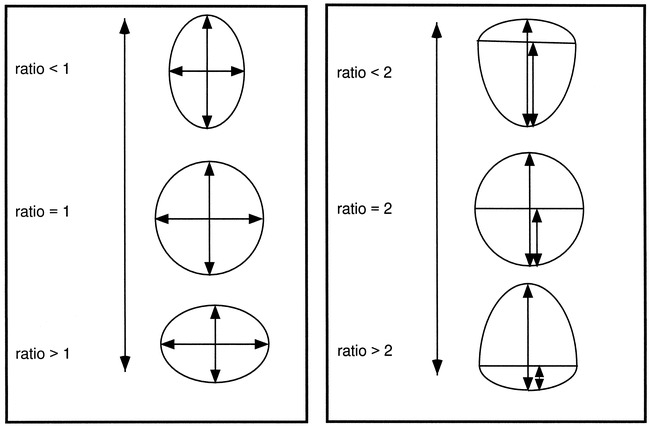
The effect of D/H and H/S ratios on general shape.
A, For a D/H ratio value less than 1, the observed shape is an ellipse, with the major axis in the vertical direction; for a value of 1, a circle; and for values greater than 1, an ellipse, with the major axis in the horizontal direction.
B, For an H/S value less than 2, the aneurysm has a pear shape; for a value of 2, a circle; and for a value greater than 2, a beehive shape.
The four main groups (defined above) were tested for significant differences between the mean geometric parameters using the test for analysis of variance (ANOVA) followed by the Neuman Keuls multiple comparison test (23) to determine which groups were significantly different. When no significant differences were found (P < .05), the subgroups were analyzed together in order to increase sample size and therefore statistical power. One of the underlying assumptions in an ANOVA test is that the data analyzed for the variance between means is normally distributed. In order to correctly apply this statistical procedure, the data were first tested to see if they assumed a gaussian distribution. This test was performed only on the four main subgroups because of sample size requirements; however, the SCA and PCA aneurysms were also included in the single sample characterization (when appropriate) in order to maximize the available sample size.
Angle of Attachment (BB Location Only)
For aneurysms arising at the BB, the angle, β, at which the aneurysm tilts with respect to the parent artery (anterior or posterior) was measured in 18 tracings, in which the lateral view was available and the neck was not hidden by superimposing vessels. The lateral view was used to construct and measure the angle between the longest median to the angiographic neck and a line parallel to the vessel walls proximal to the bifurcation (Fig 1B). The angle value, recorded with an accuracy to within half a degree, was classified as positive if the aneurysm tilted posteriorly and as negative if the opposite was true (anterior orientation).
Scaling to True In Vivo Sizes: Absolute Calibration
A: Scaling Using the Parent Artery as a Reference. The information provided by the angiographic tracings, while giving important insight into the relationships between various dimensions, reveals nothing with respect to absolute size. In order to answer questions pertaining to the average size of the simple-lobed aneurysm, the magnification of the image during acquisition and subsequent processing must be considered. The absolute sizes of the simple-lobed aneurysms were estimated using a technique described previously (16): the ratio between the dimension of interest and the reference vessel—basilar artery (BA) or internal carotid artery (ICA)—was multiplied by the average value of the vessel diameter, as found in the literature. The underlying assumption for this scaling approach is that the reference vessel shows limited biological variability across the general population.
The diameter of the BA was measured 2 to 3 cm proximal to the bifurcation, where the walls appeared to stop tapering; the diameter of the ICA was measured 0.5 to 1 cm proximal to the M1 segment of the MCA, on the angiographic tracings. Because the use of calibration markers was not part of the standard protocol at the time these angiograms were obtained, the only references available for estimating the absolute in vivo size were these parent vessel diameters present in the tracings. The BA was used as a reference for aneurysms located at the BB, SCA, and PCA; and the ICA for aneurysms located at the MCA, AcomA, and PcomA. It was impossible to estimate the absolute size in two MCA lesions, two PcomA lesions, and one AcomA lesion because we were unable to take a measurement of the corresponding ICA diameter. The analysis was thus performed in 31 MCA, 21 BB, eight PcomA, and 11 AcomA simple-lobed lesions. The average known vessel diameter was obtained by calculating a weighted average of values presented in the literature for the ICA (24–27) and BA (25, 28–31) diameters proximal to the circle of Willis, as summarized in Tables 2 and 3, respectively. Only studies using angiographic or postmortem measurements of pressurized arteries were considered in these calculations of the true diameter of parent vessels.
Table 2:
Summary of the literature values used in calculating the average internal carotid artery diameter
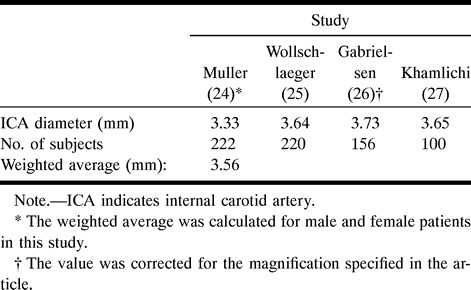
Table 3:
Summary of the literature values used in calculating the average basilar artery diameter
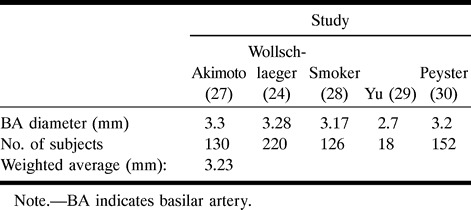
B: Analysis of Correlations. Because the angiographic tracings presented a magnified view of the aneurysm, and the magnification varied from image to image, the dimensions had to be scaled to absolute in vivo size before analyzing the relationships between them. The following relationships were of interest: the correlation between dome diameter and neck width (D vs N), dome height and neck width (H vs N), and dome height vs dome diameter (H vs D). A regression analysis was performed and the Pearson correlation coefficient (r) was calculated for these relationships. If correlation is found to exist between the parameters, then the information can be used to predict dome height and dome diameter given a particular neck diameter in models of simple-lobed aneurysms. In addition, correlation can be used to predict how dome diameter and height grow with enlargement of the neck.
C: Verification of Scaling Technique. In order to validate the parent-artery scaling technique (16), which assumes that the reference artery varies little across the population of interest, a second method can be employed that makes use of angiographic markers placed on the patient's head at the time angiography is performed. The use of barium-impregnated sponge markers of known diameter (Multi-modality Radiographic Markers, IZI Medical Products, Baltimore, MD; inner and outer diameters, 0.5 and 1.5 cm, respectively) became standard protocol in October 1997, after the majority of the tracings were collected. Therefore, this method could not be directly applied to estimates of aneurysm size for the sample under investigation. Nevertheless, additional measurements were performed in order to estimate the size of the ICA in a sample of 22 digital subtraction angiograms obtained with the same angiographic protocol as used for the aneurysm studies. These images presented lateral views of the ICA and also contained calibration markers. The diameter of the ICA was measured 0.5 to 1 cm proximal to the formation of the M1 branch of the MCA by placing a plastic ruler on the angiogram and measuring to within ±0.25 mm. Two markers found on opposite sides of the head then were identified, and their maximum diameter was recorded in a similar fashion (Fig 3). The magnification for each marker, M1 and M2, was obtained by taking the ratio between the observed value and the known value of 1.5 cm. Because the angiograms could contain either the right or the left ICA, we assumed that the vessel was located at the midpoint between the two markers. The magnification, M, for this position was obtained through the following formula: M = 2M1M2 / (M1+M2). Finally, the absolute size of the ICA diameter was estimated by dividing the observed value by the calculated magnification, M. The diameter obtained in this way was compared with the average value reported in the literature. The procedure was not performed for the BA, because—owing to the view used for imaging (usually anteroposterior) and the position of the markers on the patients' heads—it was seldom that two markers located on opposite sides of the head could be identified on the image and measured.
fig 3.
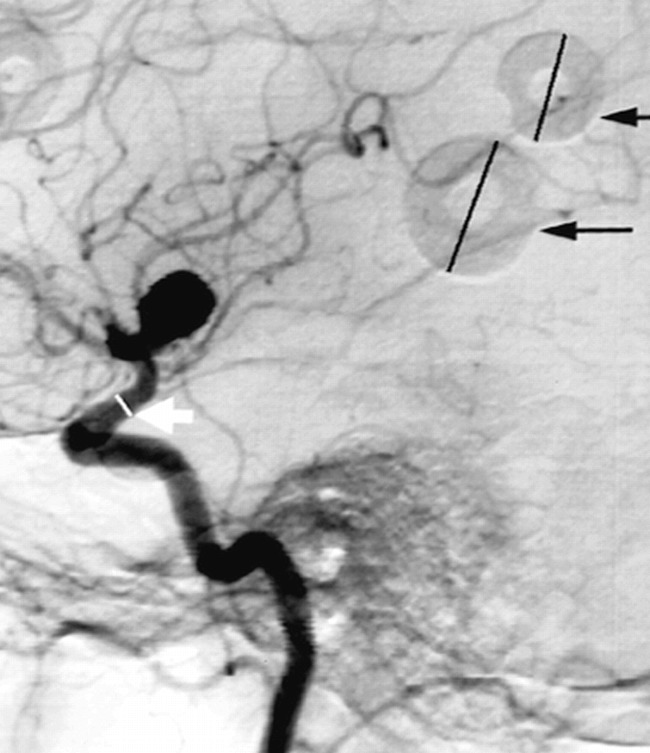
Sample angiogram with markers. For estimating true in vivo size, the marker diameters (black arrows) were measured to determine the magnification factor. The diameter of the internal carotid was then measured (white arrow) and divided by the magnification factor in order to obtain the absolute in vivo size
Ruptured versus Unruptured Lesions
The simple-lobed aneurysms were divided into intact and ruptured lesions according to the information presented in the patients' records. Unpaired t-tests were performed to identify any geometric differences between these two groups. Parameters compared between the groups included the four ratios D/H, D/N, H/N, and H/S, as well as the average absolute dimensions (obtained by scaling).
Results
Analysis of Scale-Independent Measurements
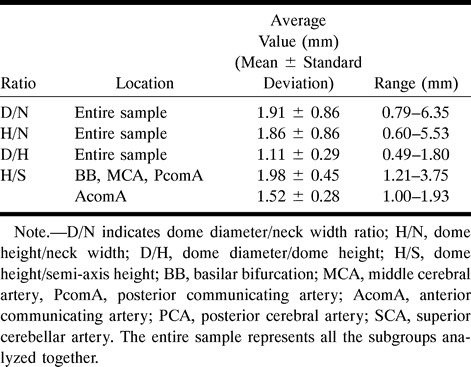
Because the images presented on tracings were a result of magnification during acquisition and processing, only the ratios between dimensions were preserved, and could thus be analyzed in the absence of a calibration factor. In our analysis of these scale-independent measurements, a normal distribution around the mean was observed for all four ratios of interest (D/N, H/N, D/H, and H/S), when analyzed separately for each main subgroup (BB, MCA, AcomA, and PcomA). The ratios for aneurysms located on the SCA and PCA were not included in this analysis owing to the small sample size (three and four aneurysms, respectively). Analysis of variance between the means of these ratios showed no significant differences between the main groups for all ratios except H/S. In this instance there was a significant difference in the ratio found in the AcomA aneurysms (Neuman Keuls multiple comparison test, P < .05) from the values present in the BB, MCA, and PcomA lesions, which displayed similar H/S mean values. The results for the entire sample were therefore analyzed together in an attempt to characterize the typical simple-lobed aneurysm for the D/N, H/N, and D/H ratios. For the H/S ratio, only the MCA, BB, and PcomA were analyzed together, because the mean of the ratio for the AcomA proved to be significantly smaller. The results are summarized in Table 4.
Table 4:
Summary of ratios: ranges and mean values
The D/H ratio gives an indication of the general aneurysm shape, describing the direction of the major axis if the aneurysm is described as an ellipse in projection (Fig 2A). Because the observed values for D/H seemed to be uniformly distributed above and below a value of 1 (Fig 4A), it can be concluded that the aneurysms vary between an ellipse with the major axis in the vertical direction to an ellipse with the major axis in the horizontal direction. The mean of 1.1 indicates that, on average, simple-lobed saccular aneurysms assume a nearly spherical shape. Although the D/H ratio is not independent of the D/N and H/N ratios, it was calculated separately for simplicity. Nevertheless, excellent agreement was observed between the average D/H of 1.11, obtained from direct calculation, and the D/H value of 1.03, calculated by dividing the average D/N value by the average H/N value.
fig 4.
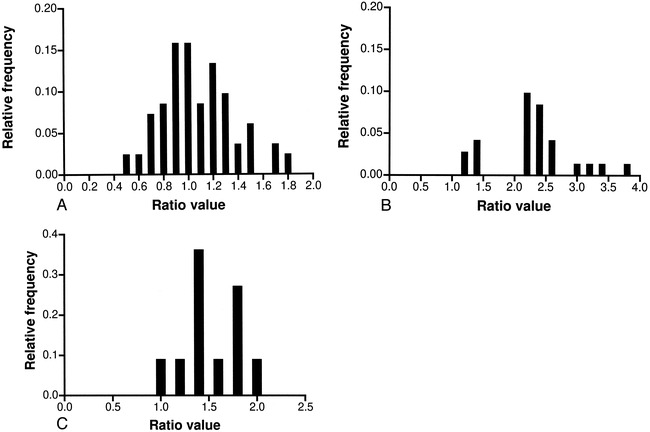
Distribution of ratios.
A, Distribution of dome diameter/dome height (D/H) for all locations considered.
B, Distribution of dome height/semi-axis height (H/S) for aneurysms located on the BB, MCA, and PcomA.
C, Distribution of dome height/semi-axis height (H/S) for aneurysms located on the AcomA.
The H/S ratio indicates where the dome diameter is located with respect to the angiographic neck, yielding a form that varies from a pear to a beehive shape (Fig 2B). This ratio was the only one in which statistically significant differences were observed between the subgroups. The aneurysms of the BB, MCA, and PcomA showed values uniformly distributed around 2 (Fig 4B), with a mean of 1.98, suggesting again that these lesions are close to a spherical shape. For AcomA aneurysms, the observed ratio was 1.52, with the majority of aneurysms showing a value of less than 2 (Fig 4C), indicating a tendency toward a pear shape.
The H/N and D/N yielded similar values, again supporting the idea of a general spherical shape. Although not shown here, the D/N values were normally distributed around the mean of 1.91, with a few outliers creating the upper portion of the range. The H/N values showed a positively skewed distribution, however, yielding an average of 1.86.
Angle of Attachment
Aneurysms arising from the BB did not continue in the direction set by the BA. The dome tilted forward or backward with respect to the parent vessel. An equal distribution of aneurysms pointing in either direction was observed. The measured angle, β, ranged from −46° to 33° (Fig 5), with a mean of 1.6° ± 23.2 (mean ± SD). Although no measurements were recorded close to the calculated mean angle, and no obvious trend seemed to exist in the obtained values, the data passed the test for gaussian distribution.
fig 5.
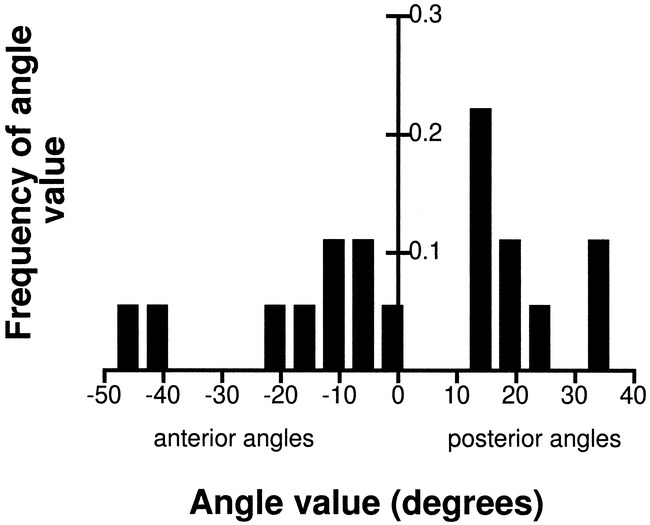
Distribution of the angle at the BB, β (mean value, 1.6, SD, 23)
Scaling to True In Vivo Values
Estimation of the Aneurysm Dimensions Using the Parent Artery as Reference
The estimation of sizes for the simple-lobed aneurysms of the BB, MCA, PcomA, and AcomA was performed using the Zubillaga technique (16), since the use of calibration markers was not part of standard angiographic protocol at the time the angiographic tracings used in the study were collected. The true in vivo sizes calculated for the four main locations are summarized in Table 5. The SCA and PCA aneurysm dimensions were not included in the statistical analysis owing to the very small sample size. The dimensions of aneurysms located at the BB seemed to be on average twice as large as the equivalent dimensions in the remainder of the population, which presented surprisingly similar mean values for the three dimensions considered.
Table 5:
Mean values and ranges of absolute sizes of N, D, and H for aneurysms of the MCA, AcomA, PcomA, and BB (mean ± SD)

The aneurysms were classified as small (dome height < 12 mm), large (12 mm ≤ dome height ≤ 25 mm), or giant (dome height > 25 mm) (32), and the angiographic neck was designated as small (neck diameter < 4 mm) or large (neck diameter ≥ 4 mm) (16). A summary of the type of aneurysms found at each main location is presented in Table 6.
Table 6:
Summary of aneurysm size classification based on neck width and dome height

Analysis of Correlations
Once the absolute in vivo dimensions of the aneurysms were calculated, it was possible to investigate correlations between D, N, and H over the entire sample. A strong positive correlation was observed between the dome diameter (D) and the neck width (N) (Fig 6A). A similar trend emerged for the dome height (H) with respect to the angiographic neck width (N) (Fig 6B). An even stronger relationship was found between the size of the dome height (H) and dome diameter (D) (Fig 6C). These correlations indicate that an increase in aneurysm dimensions is linked to an increase in aneurysm neck diameter. Note, however, that because of the classifications of neck and aneurysm size, it is possible to observe a small aneurysm with a large neck, although large and giant aneurysms with small necks are unlikely (Table 6).
fig 6.
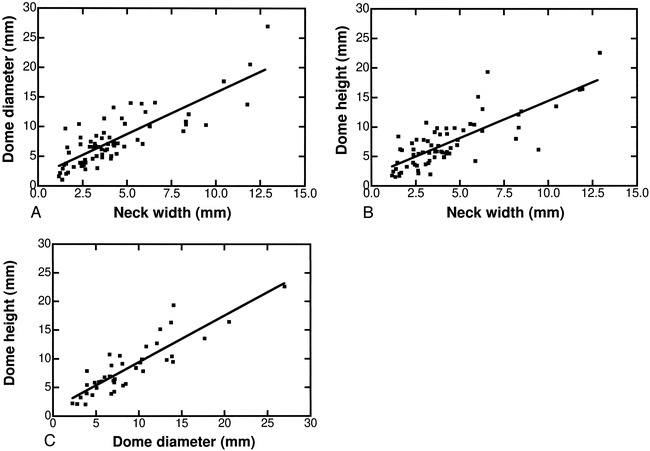
Correlations of absolute in vivo aneurysm dimensions.
A, Dome diameter vs neck width (D vs N); r = .82, D = 1.4 N + 1.7, P < .0001.
B, Dome height vs neck width (H vs N); r = .79, H = 1.3 N + 1.9, P < .0001.
C, Dome height vs dome diameter (H vs D), r = .88, H = 0.8 D + 1.3, P < .0001.
Verification of Scaling Technique
The estimated mean ICA lumen diameter obtained using markers was 3.61, with an SD of 0.70, representing 19% of the mean. This value was consistent with values reported in the literature (24–27) and was within 1.4% of the average obtained from the literature (Table 2). Thus, scaling to true size using the ICA diameter, or making use of standard markers present in the angiograms, should yield similar results. The validation was not performed for the BA, owing to the difficulty of observing calibration markers in many of the angiograms used.
Ruptured versus Unruptured Lesions
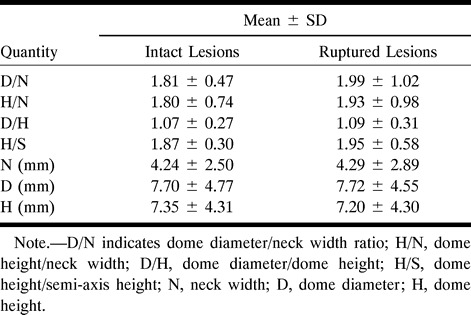
Of the simple-lobed aneurysms analyzed, 52% were intact at the time of discovery, while the rest had ruptured. There were no significant differences (P < .05) found in the D/N, H/N, D/H; in the H/S mean values; or in the in vivo size of D, H, and N between the ruptured and unruptured lesions (see Table 7).
Table 7:
Summary of results for intact and ruptured simple-lobed aneurysms
Discussion
Demographics
Failing to choose a representative sample from a population can seriously bias the results of an analysis. When trying to characterize a population from a selected subpopulation, special attention must be paid to choosing a representative group. The 163 saccular aneurysms available for this study occurred in patients aged 28 to 83 years, with a mean age of 52.5 years, which is consistent with the values reported in the literature (33, 34). Aneurysms were more common in women than in men, a fact previously observed (33). The distribution of the aneurysms at the six locations is summarized in Table 1. While previously reported values on the location of aneurysms vary (18, 32, 35, 36) our numbers fit within the observed ranges (Table 8). The sample selected for this study shows the same characteristics as observed in previous research involving larger sample sizes, and can, therefore, be considered as representative. From this available group of 163 saccular aneurysms, only the lesions that were pear-shaped, spherical, or beehive-shaped, with or without a bleb, were considered and analyzed to provide the geometry of the typical simple-lobed aneurysm.
Table 8:
Distribution of saccular aneurysms at the MCA, BB, AcomA, PcomA, PCA, and SCA as observed previously and in the present study

Aneurysm Geometry Characterization
All measurements were performed on tracings of angiograms, which are 2D representations of 3D objects. In such instances, one must assume that the object is axially symmetrical in order to be able to infer its 3D shape. The analysis had to be limited to simple-lobed aneurysms, since in their case it is more correct to assume circular symmetry than in the case of multilobar or complicated lesions. With this assumption in mind, our proposed model cannot account for any irregularities, such as the presence of blebs. To extend our analysis beyond simple-lobed, symmetrical saccular aneurysms would require quantitative 3D imaging techniques, such as MR imaging or CT.
Distribution of Ratios
Although the observed sizes of aneurysms on the angiographic tracings are a result of magnification during the acquisition and processing of the image, the relationships between these dimensions remain unchanged. This makes the use of ratios, which are magnification-independent, particularly attractive for the characterization of aneurysm shape from angiographic tracings, since there is no need for scaling to absolute in vivo size.
The premise has been suggested that the ratio between the dome diameter and neck should be used as a factor in deciding between surgical treatment and embolization (18). A ratio value of less than 1 would suggest surgery as the best method, whereas a ratio value of more than 1 (indicating a small neck relative to the aneurysm dome), would favor embolization. Particularly for wide-necked aneurysms, this ratio is important in predicting whether coils can be placed in a stable position within the aneurysm dome (18). The simple-lobed aneurysms we analyzed had a D/N average value of 1.91 (Table 4), and only in four (5%) of 82 cases was this value below 1, indicating that most simple-lobed aneurysms would be reasonable candidates for endovascular coil treatment if one accepts this premise. Other investigators have found that an absolute neck size less than 4 mm is predictive of satisfactory aneurysm occlusion with coils (16).
The D/H and H/N ratios could also be used to determine the outcome of surgical or endovascular treatment. It has been previously shown that for MCA aneurysms a more spherical shape resulted in a good outcome (as designated by an activity of daily living score between 1 and 3) after surgical treatment, whereas a prolate spheroidal shape was associated with a poor outcome (score of 4 to 6 on the activity of daily living scale) (20). The same study found that a lower major axis/neck ratio also corresponded to good outcome after treatment, but the method of finding the major axis was undefined.
From the perspective of in vitro modeling, the D/H and H/S ratios give an indication of the general aneurysm geometry, as previously discussed: the D/H ratio indicates whether the maximum dimension lies parallel or perpendicular to the neck, and the H/S ratio refers to the position of the dome diameter with respect to the neck (Fig 2). Geometry seems to play an important role in the distribution of stress within the aneurysm wall (37). Since the tendency for growth and thrombosis may be influenced by various geometric parameters, studies that are concerned with this aspect of aneurysms would benefit from geometrically accurate models. The same ratios (D/H and H/S) have been previously used for the creation of different types of simple-lobed aneurysm models (6). In addition to these ratios, the D/N and H/N values are useful in building a model. They indicate the appropriate dome height and dome diameter to be used for a specified neck size. In theory, then, for a neck width of x, the typical aneurysm of the BB, MCA, and PcomA would show a dome height of 1.86x and a dome diameter of 1.91x, located at a distance of 0.94x from the neck. If the aneurysm were placed on the AcomA, a more accurate representation of the typical simple-lobe aneurysm would show a dome height of 1.86x and a dome diameter of 1.91x, located at a distance of 1.22x from the neck of width x. We have used these characteristic dimensions to generate 3D wire-mesh figures of both aneurysm types, as illustrated in Figure 7. These mesh structures are suitable for computational fluid dynamic modeling, finite element models, or computer-aided manufacture.
fig 7.
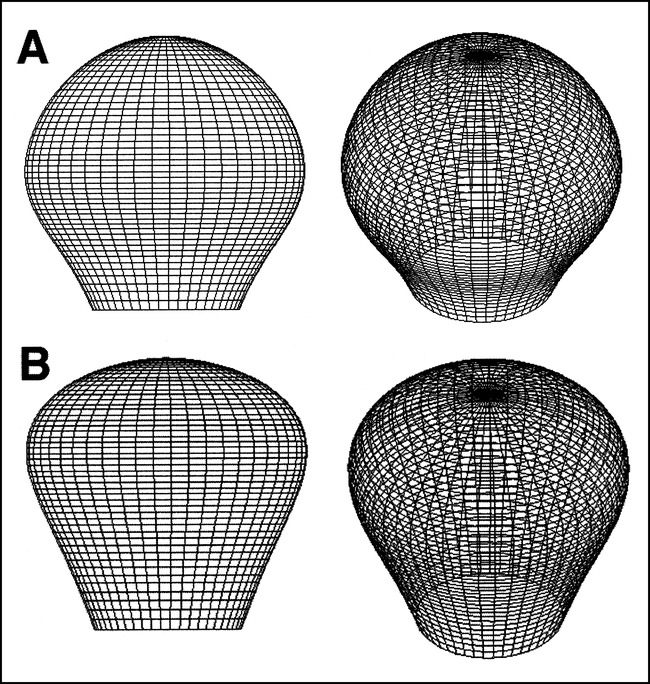
3D representations of the typical simple-lobed aneurysm.
A, Two views of the aneurysm arising at the BB, MCA, and PcomA.
B, Two views of the aneurysm arising from the AcomA.
Generally, the measurements indicate that a spherical model is appropriate for all aneurysms except for those located at the AcomA, which tended to be pear-shaped rather than spherical. This assumption of a spherical shape is consistent with many earlier numerical and in vitro studies (38–40), although it has not been validated previously.
Analysis of Angles
The angle at which the basilar aneurysms tilt with respect to the BA has an important implication for the outcome of surgical treatment. The prognosis is poorer for aneurysms that project more posteriorly, because vital perforators tend to be more involved (41). Our results indicate an equal distribution of aneurysms with an anterior or posterior orientation. A previous study by Drake et al (21) found that the majority of small BB aneurysms “project upward in line with the curve of the basilar artery” (73% upward, 14% posterior, and 11% anterior); however, this study defined anterior- and posterior-pointing aneurysms as those that pointed close to 90° relative to the BA. If we consider those aneurysms in our study that point between ±30° to be pointing upward, then our results are in good agreement with the previous study.
Absolute Sizes
While the tracings provide information on the general shape of the aneurysm, in order to find the absolute in vivo size of these lesions, one must account for the magnification present. Being able to calculate the absolute size of the aneurysm from an angiogram is of some importance in deciding the type of treatment and in estimating the risk of rupture. We made use of two such methods, using either the parent artery or the angiographic markers as a reference. The first method assumes that the parent vessel diameter is constant; thus, it is important to use as a reference a vessel that shows little biological variability. The BA is a vessel that is remarkably constant from its origin to the bifurcation, with the exception of a widening proximal to the bifurcation, which is present in 16% of the cases (42). The BA diameter was previously used as a reference value for estimating the size of aneurysm necks (16) and of the pituitary stalk (31). The ICA was also used as a reference point in estimating the neck width of aneurysms (16). Care was taken to select, within the vessel portion available, a segment with parallel walls, thus minimizing the measurement error.
The marker method is based on the assumption that the location of the reference vessels within the cranium is constant, and can thus be approximated. For this method to be of use, the utilization of angiographic markers must be part of a standard protocol. The results of this study show that good agreement exists between these two methods, indicating that using the BA or ICA as a reference is a valid technique for estimating the in vivo size from angiograms.
Controversy still exists in the literature over the critical size for the rupture of aneurysms and over the most appropriate therapeutic approach for incidental lesions. Inagawa et al (43) report rupture to be found mostly in aneurysms larger than 4 mm, and the risk of rupture and rerupture to increase with the size of the aneurysm. Jomin et al (44) place the critical size for rupture at the 10-mm-diameter mark. Other researchers recommend surgery only for lesions greater than 5 mm, since no rupture is demonstrated in lesions smaller than 4 mm in diameter (45), while still others qualify lesions smaller than 5 mm as susceptible to rupture (46). However, for locations such as the anterior cerebral artery, bleeding is reported to be independent of size (47). The present study found no differences in the size of the neck, dome diameter, or dome height of ruptured versus unruptured simple-lobed aneurysms.
The absolute dimensions of the aneurysm are also critical for accuracy in in vitro and numerical models of these lesions. The size of the aneurysms was not uniform at all locations (Table 5). In fact, BB aneurysms tended to show a larger neck, dome height, and dome diameter than the rest of the lesions (MCA, AcomA, and PcomA). Others have found MCA aneurysms to have the largest maximal diameter (35), but the difference probably relates to the fact that their analysis was not performed on simple-lobed lesions exclusively.
Our measured dimensions for the MCA aneurysms (N = 3.41 mm, D = 6.12 mm, H = 5.62) tended to be smaller than previously reported values (N = 5.10 mm, D = 8.55 mm, H = 6.43 mm) (20). The discrepancy could be due to the fact that the values reported by Ebina et al (20) may not have been corrected for magnification (no mention of such transformation is made in the article). At the same time, they do not define the way the dimensions were measured; hence, their correspondence to the dimensions described in the present article can only be inferred.
Excellent correlations between the aneurysm dome diameter and neck width (D vs N), dome height and neck width (H vs N), and dome diameter and dome height (D vs H) were observed, implying a concurrent increase in the aneurysm dome with an increase in neck size. A similar relationship was previously observed between height and neck in MCA aneurysms (20). These correlations between D, H, and N imply that, for simple-lobed saccular aneurysms, knowledge of aneurysm size or neck width may provide information equivalent to derived ratios such as D/N or H/N.
Conclusion
This study presents a relatively simple approach to characterizing the simple-lobed aneurysm shape and size using angiographic tracings. In the context of aneurysm treatment, the trend is toward the increased use of minimally invasive techniques, such as GDC coil embolization. The shape of the aneurysm is critical to the success of the occlusion and to the prevention of embolic material from extending into the parent artery. A relationship worth investigating is the possible correlation between the completeness of occlusion and the values of various aneurysm dimensions. Measurements such as described in this article could be prospectively incorporated into clinical trials that seek to compare surgical treatment and endovascular embolization. We found no significant differences in our measurement parameters between ruptured and unruptured simple-lobed saccular aneurysms. Note, however, that this finding may not apply to other types of saccular aneurysms (lobulated and/or complicated); further studies are required to determine if a relationship exists between our geometric parameters and the clinical prognosis for saccular aneurysms in general.
Although aneurysms have been the target of extensive research, precise quantitative data on their geometry is limited. Many previous models have assumed that aneurysms are spherical lesions, but this assumption was founded in the need to simplify an analysis, and was not based on empirical evidence. According to our results, the typical simple-lobed aneurysm is almost spherical in shape, as indicated by an average D/H ratio of 1.1, and an H/S of 1.98, with the exception of AcomA aneurysms, which seem to be more pear-shaped. Overall, these results validate the use of spheres as physical models of aneurysms. Furthermore, our measurements characterize the range of shapes and sizes assumed by these lesions, providing useful guidelines for the creation of models that deviate from the spherical shape.
Acknowledgments
We thank Allan Fox for very helpful discussions and Jacques Milner for the preparation of the wire-mesh diagrams.
Footnotes
Supported by the Medical Research Council of Canada under operating grant MT-13356; salary support provided by the Heart and Stroke Foundation of Canada in the form of a traineeship (R.F.) and a research scholarship (D.W.H.).
Address reprint requests to David Holdsworth, PhD, The J.P. Robarts Research Institute, Imaging Research Laboratories, P.O. Box 5015, 100 Perth Dr, London, Ontario, N6A 5K8, Canada.
References
- 1.Hademenos GJ. The physics of cerebral aneurysms. Physics Today 1995;48:25-30 [Google Scholar]
- 2.Gonzalez CF, Cho YI, Ortega HV, et al. Intracranial aneurysms: flow analysis of their origin and progression. AJNR Am J Neuroradiol 1992;83:181-188 [PMC free article] [PubMed] [Google Scholar]
- 3.Brown N. A mathematical model for the formation of cerebral aneurysms. Stroke 1991;22:619-625 [DOI] [PubMed] [Google Scholar]
- 4.Canham PB, Ferguson GG. A mathematical model for the mechanics of saccular aneurysms. Neurosurgery 1985;17:291-295 [DOI] [PubMed] [Google Scholar]
- 5.Steiger HJ, Poll A, Liepsch D, Reulen HJ. Basic flow structure in saccular aneurysms: a flow visualization study. Heart Vessels 1987;3:55-65 [DOI] [PubMed] [Google Scholar]
- 6.Hashimoto T. Dynamic measurement of pressure and flow velocities in glass and silastic model berry aneurysms. Neurol Res 1984;6:22-28 [DOI] [PubMed] [Google Scholar]
- 7.Roach MR, Scott S, Ferguson GG. The hemodynamic importance of the geometry of bifurcation in the circle of Willis (glass model studies). Stroke 1972;3:255-267 [DOI] [PubMed] [Google Scholar]
- 8.Austin GM, Schievink W, Williams R. Controlled pressure-volume factors in the enlargement of intracranial aneurysms. Neurosurgery 1989;24:722-730 [DOI] [PubMed] [Google Scholar]
- 9.Massoud TF, Ji C, Guglielmi G, Vinuela F, Robert J. Experimental models of bifurcation and terminal aneurysms: construction techniques in swine. AJNR Am J Neuroradiol 1994;67:903-905 [PMC free article] [PubMed] [Google Scholar]
- 10.Hashimoto N, Kim C, Kikuchi H, Kojima M, Kang Y, Hazama F. Experimental induction of cerebral aneurysms in monkeys. J Neurosurg 1987;67:903-905 [DOI] [PubMed] [Google Scholar]
- 11.Creasy JK, Crump DB, Knox K, Kerber CW, Price RR. Design and evaluation of a flow phantom. Acad Radiol 1995;2:902-904 [DOI] [PubMed] [Google Scholar]
- 12.Massoud TF, Hademenos GJ, Young WL, Gao E, Pile-Spellman J, Vinuela F. Principles and philosophy of modeling in biomedical research. FASEB J 1998;12:275-285 [DOI] [PubMed] [Google Scholar]
- 13.Chong GW, Kerber CW, Buxton RB, Frank LR, Hesselink JR. Blood flow dynamics in the vertebrobasilar system: correlation of a transparent elastic model and MR angiography. AJNR Am J Neuroradiol 1994;15:733-745 [PMC free article] [PubMed] [Google Scholar]
- 14.Kerber CW, Hecht ST, Knox K. Arteriovenous malformation model for training and research. AJNR Am J Neuroradiol 1997;18:1229-1232 [PMC free article] [PubMed] [Google Scholar]
- 15.Marks MP, Chee H, Liddell RP, Steinberg GK, Panahian N, Lane B. A mechanically detachable coil for the treatment of aneurysms and occlusion of blood vessels. AJNR Am J Neuroradiol 1994;15:821-827 [PMC free article] [PubMed] [Google Scholar]
- 16.Fernandez Zubillaga A, Guglielmi G, Viñuela F, Duckwiler GR. Endovascular occlusion of intracranial aneurysms with electrically detachable coils: correlation of aneurysm neck size and treatment results. AJNR Am J Neuroradiol 1994;15:815-820 [PMC free article] [PubMed] [Google Scholar]
- 17.Richling B, Bavinski G, Gross C, Gruber A, Killer M. Early clinical outcome of patients with ruptured cerebral aneurysms treated by endovascular (GDC) or microsurgical techniques. Intervent Neuroradiol 1995;1:19-27 [DOI] [PubMed] [Google Scholar]
- 18.Bavinski G, Richling B, Gruber A, Killer M, Levy D. Endosaccular occlusion of basilar artery bifurcation aneurysms using electrically detachable coils. Acta Neurochir 1995;134:184-189 [DOI] [PubMed] [Google Scholar]
- 19.Fink CL, Flandry RE, Pratt RA, Early CB. A comparative study of performance of cerebral aneurysm clips as a function of intravascular pressure and aneurysm neck diameter. Surg Neurol 1979;11:179-186 [PubMed] [Google Scholar]
- 20.Ebina K, Shimizu T, Sohma M, Iwabuchi T. Clinico-statistical study on morphological risk factors of middle cerebral artery aneurysms. Acta Neurochir 1990;106:153-159 [DOI] [PubMed] [Google Scholar]
- 21.Drake CG, Peerless SJ, Hernesniemi JA. Surgery of Vertebrobasilar Aneurysms: London, Ontario, Experience on 1767 Patients.. New York: Springer; 1996:7–17
- 22.Liou TM, Chang WC, Liao CC. Experimental study of steady and pulsatile flow in cerebral aneurysm model of various sizes at branching site. J Biomech Eng 1997;119:325-332 [DOI] [PubMed] [Google Scholar]
- 23.Rossner B. Fundamentals of Biostatistics.. 2nd ed. Boston: PWS Publishers; 1986:460–461
- 24.Müller HR, Brunhölzl C, Radü EW, Buser M. Sex and side differences of cerebral arterial caliber. Neuroradiology 1991;33:212-216 [DOI] [PubMed] [Google Scholar]
- 25.Wollschlager G, Wollschlager PB. The circle of Willis. In: Newton TH, Potts DJ, eds. Radiology of the Skull and Brain: Angiography. New York: CV Mosby; 1974:1171–1201
- 26.Gabrielsen TO, Greitz T. Normal size of the internal carotid, middle cerebral and anterior cerebral arteries. Acta Radiol 1970;10:1-11 [DOI] [PubMed] [Google Scholar]
- 27.Khamlichi AE, Azouzi M, Bellakhdar F, Ouhcein A, Lahlaidi A. Configuration anatomique du polygone de Willis de l'adulte, étudié par les techniques d'injection. Neurochirurgie 1985;31:287-293 [PubMed] [Google Scholar]
- 28.Akimoto H. Roentgenological aspect of the basilar artery and its significance in clinical diagnosis: angiographical study of the basilar artery. No Shinkei Geka 1979;7:1155-1162 [PubMed] [Google Scholar]
- 29.Smoker WR, Price MJ, Deyes WD, Corbett JJ, Gentry LR. High-resolution computed tomography of the basilar artery, 1: normal size and position. AJNR Am J Neuroradiol 1986;7:55-60 [PMC free article] [PubMed] [Google Scholar]
- 30.Yu Y, Moseley I, Pullicino P, McDonald W. The clinical picture of ectasia of the intracerebral arteries. J Neurol Neurosurg Psychiatry 1982;45:29-36 [DOI] [PMC free article] [PubMed] [Google Scholar]
- 31.Peyster RG, Hoover ED, Adler LP. CT of the normal pituitary stalk. AJNR Am J Neuroradiol 1984;5:45-47 [PMC free article] [PubMed] [Google Scholar]
- 32.Drake CG. The treatment of aneurysms of the posterior circulation. Clin Neurosurg 1979;26:96-144 [DOI] [PubMed] [Google Scholar]
- 33.Wiebers DO, Whisnant JP, Sundt TM, O'Fallon WM. The significance of unruptured intracranial saccular aneurysms. J Neurosurg 1987;66:23-29 [DOI] [PubMed] [Google Scholar]
- 34.Sekhar LN, Heros RC. Origin, growth, and rupture of saccular aneurysms: a review. Neurosurgery 1981;8:248-260 [DOI] [PubMed] [Google Scholar]
- 35.Kassell NF, Torner JC. Size of intracranial aneurysms. Neurosurgery 1983;3:291-297 [DOI] [PubMed] [Google Scholar]
- 36.Akimoto Y. A pathological study of intracranial aneurysms particularly of aneurysms other than saccular ones. Acta Pathol Jpn 1980;30:229-239 [DOI] [PubMed] [Google Scholar]
- 37.Burleson AC, Strother CM, Turitto VT. Computer modeling of intracranial saccular and lateral aneurysms for the study of their hemodynamics. Neurosurgery 1995;37:774-783 [DOI] [PubMed] [Google Scholar]
- 38.Chitanvis SM, Hademenos G, Powers WJ. Hemodynamic assessment of the development and rupture of intracranial aneurysms using computational simulations. Neurol Res 1995;17:426-434 [PubMed] [Google Scholar]
- 39.Kyriacou SK, Humphrey JD. Influence of size, shape and properties on the mechanics of axisymmetric saccular aneurysms. J Biomechanics 1996;29:1015-1022 [DOI] [PubMed] [Google Scholar]
- 40.Ferguson GG. Turbulence in human intracranial saccular aneurysms. J Neurosurg 1970;33:485-497 [DOI] [PubMed] [Google Scholar]
- 41.Drake CG. Further experience with surgical treatment of aneurysms of the basilar artery. J Neurosurg 1961;18:230-238 [DOI] [PubMed] [Google Scholar]
- 42.Saeki N, Rhoton AL. Microsurgical anatomy of the upper basilar artery and the posterior circle of Willis. J Neurosurg 1977;46:563-578 [DOI] [PubMed] [Google Scholar]
- 43.Inagawa T, Hirano A. Ruptured intracranial aneurysms: an autopsy study of 133 patients. Surg Neurol 1990;33:117-123 [DOI] [PubMed] [Google Scholar]
- 44.Jomin M, Lesoin F, Lozes G, Fawaz A, Villete L. Surgical prognosis of unruptured intracranial aneurysms: report of 50 cases. Acta Neurochir 1987;84:85-88 [DOI] [PubMed] [Google Scholar]
- 45.Mizoi K, Yoshimoto T, Nagamine Y, Kayama T, Koshu K. How to treat incidental cerebral aneurysms: a review of 139 consecutive cases. Surg Neurol 1995;44:114-120 [DOI] [PubMed] [Google Scholar]
- 46.Yasui N, Magarisawa S, Suzuki A, Nishimura H, Okudera T, Abe T. Subarachnoid hemorrhage caused by previously diagnosed, previously unruptured intracranial aneurysms: a retrospective study of 25 cases. Neurosurgery 1996;39:1096-1100 [DOI] [PubMed] [Google Scholar]
- 47.Ohno K, Monma S, Suzuki R, Masaoka H, Matsushima Y, Hirakawa K. Saccular aneurysms of the distal anterior cerebral artery. Neurosurgery 1990;27:907-912 [DOI] [PubMed] [Google Scholar]


