. 2020 Mar 4;9:e51406. doi: 10.7554/eLife.51406

Figure 5. Molecular analysis of myelin in the Prx-/- mouse model of CMT4F.

(A) Myelin purified from sciatic nerves dissected from Prx-/- and control mice at P21 was separated by SDS-PAGE (0.5 µg protein load) and proteins were visualized by silver staining. Bands constituted by the most abundant myelin proteins (MPZ/P0, MBP, PRX) are annotated. Note that no band constituted by PRX was detected in Prx-/- myelin and that several other bands also display genotype-dependent differences in intensity. Gel shows n = 2 biological replicates representative of n = 3 biological replicates. (B) The relative abundance of proteins in myelin purified from Prx-/- sciatic nerves as quantified by MSE is given as percent with relative standard deviation (% +/- RSD). Note the increased relative abundance of MPZ/P0 and MBP compared to wild-type myelin (see Figure 2) when PRX is lacking. Mass spectrometric quantification based on 3 biological replicates with 4 technical replicates each (see Figure 5—source data 1). (C,D) Differential proteome analysis by DRE-UDMSE of myelin purified from Prx-/- and wild-type mice. Mass spectrometric quantification based on 3 biological replicates per genotype with 4 technical replicates each (see Figure 5—source data 2). (C) Top 40 proteins of which the abundance is reduced (blue) or increased (red) in peripheral myelin purified from Prx-/- compared to wild-type mice with the highest level of significance according to the -log10 transformed q-value (green). In the heatmaps, each horizontal line corresponds to the fold-change (FC) of a distinct protein compared to its average abundance in wild-type myelin plotted on a log2 color scale. Heatmaps display 12 replicates, that is 3 biological replicates per genotype with 4 technical replicates each. (D-D‘‘‘) Volcano plots representing genotype-dependent quantitative myelin proteome analysis. Data points represent quantified proteins in Prx-/- compared to wild-type myelin and are plotted as the log2-transformed fold-change (FC) on the x-axis against the -log10-transformed q-value on the y-axis. Stippled lines mark a -log10-transformed q-value of 1.301, reflecting a q-value of 0.05 as significance threshold. Highlighted are the datapoints representing the Top 10 proteins displaying highest zdist values (Euclidean distance between the two points (0,0) and (x,y) with x = log2(FC) and y = -log10(q-value) (red circles in D), immune-related proteins (purple circles in D‘), proteins of the extracellular matrix (ECM; yellow circles in D‘‘) and known myelin proteins (blue circles in D‘‘‘). n.d., not detected; n.q., no q-value computable due to protein identification in one genotype only. Also see Figure 5—figure supplement 1. (E) Immunoblot of myelin purified from Prx-/- and control sciatic nerves confirms the reduced abundance of DRP2, SLC16A1/MCT1, BSG and PMP2 in Prx-/- myelin, as found by differential DRE-UDMSE analysis (in C,D). PRX was detected as genotype control; PLP/DM20 and ATP1A1 serve as markers. Blot shows n = 2 biological replicates per genotype. (F) Teased fiber preparations of sciatic nerves dissected from Prx-/- and control mice immunolabelled for MAG (red) and SLC16A1 (green). Note that SLC16A1 co-distributes with MAG in Schmidt-Lanterman incisures (SLI) in control but not in Prx-/- nerves, in accordance with the reduced abundance of SLC16A1 in Prx-/- myelin (C–E). Also note that, in Prx-/- myelin, SLI were largely undetectable by MAG immunolabeling.

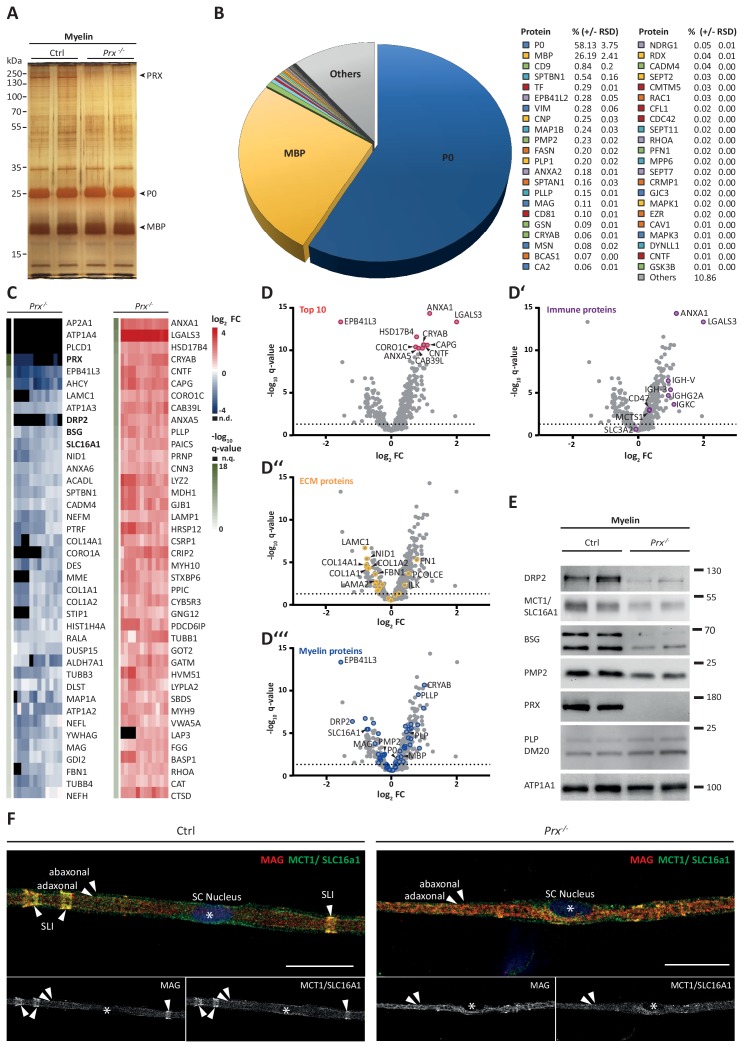
Figure 5—source data 1. Label-free quantification of proteins in PNS myelin fractions from Prx-/- mice by MSE Identification and quantification data of detected myelin-associated proteins.
Tryptic peptides derived from four technical replicates (replicate digestion and replicate injection) per three biological replicate (20 sciatic nerves pooled from 10 animals) were analyzed by LC-MS (12 runs in total). Proteins (FDR < 1%; 2 peptides/protein) and peptides (FDR < 1%;≥7 amino acids) were identified by database search against the UniprotKB/SwissProt mouse database using PLGS. Data were post-processed with the software package ISOQuant to calculate absolute in-sample amounts for each detected protein based on the TOP3 approach. Reported abundance values are defined as the relative amount of each protein in respect to the sum over all detected proteins (ppm: parts per million (w/w) of total protein). Typical contaminant proteins like keratins were filtered. → sheet 1: protein identification details → sheet 2: Prx-/- myelin proteome by MSE.
elife-51406-fig5-data1.xlsx (105.7KB, xlsx)
Figure 5—source data 2. Label-free quantification of proteins in PNS myelin fractions from WT and Prx-/- mice by DRE-UDMSE Identification and quantification data of detected myelin-associated proteins by DRE-UDMSE.
For each genotype, tryptic peptides derived from four technical replicates (replicate digestion and replicate injection) per three biological replicate (20 sciatic nerves pooled from 10 animals) were analyzed by LC-MS (24 runs in total). Proteins (FDR < 1%; 2 peptides/protein) and peptides (FDR < 1%;≥7 amino acids) were identified by database search against the UniprotKB/SwissProt mouse database using PLGS. Data were post-processed with the software package ISOQuant to calculate absolute in-sample amounts for each detected protein based on the TOP3 approach. Reported abundance values are defined as the relative amount of each protein in respect to the sum over all detected proteins (ppm: parts per million (w/w) of total protein). Typical contaminant proteins like keratins were filtered. The -log10-transformed q-value was plotted against the log2-transformed fold change to obtain the volcano plot shown in Figure 5D. As no imputation of missing values was performed, proteins exclusive for only one of the conditions do not appear in the volcano plot, but are appended at the end of the list. Criteria for statistically significant regulation were as follows: fold change of at least 1.5 and q-value below 0.05. → sheet 1: protein identification details → sheet 2: comparison of WT vs. Prx-/- myelin proteome by DRE-UDMSE.
elife-51406-fig5-data2.xlsx (309.3KB, xlsx)

Figure 5.

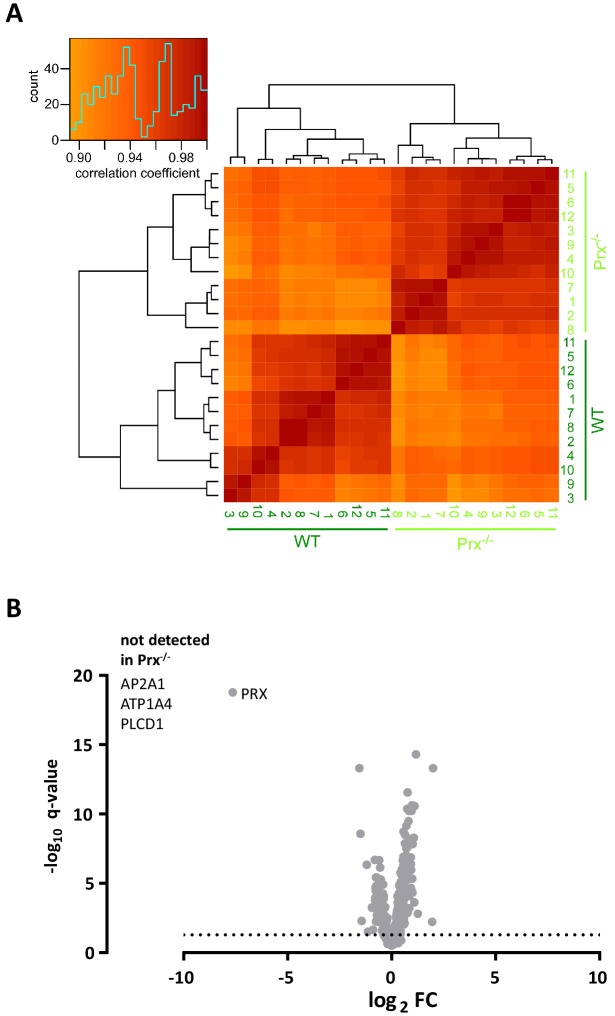
Figure 5—figure supplement 1. Clustered heatmap of Pearson’s correlation coefficients for protein abundance comparing genotypes.

Figure 5—figure supplement 1.

(A) The heatmap compares the log2 transformed ppm protein abundance values from the DRE-UDMSE runs to assess peripheral myelin purified from wild type and Prx-/- mice. The inset shows the color key and the histogram for the values of the correlation coefficients. Note that the runs cluster with a high overall correlation (>0.85) into two conditions defined by the genotype, in agreement with the experimental design. (B) Volcano plot representing genotype-dependent quantitative myelin proteome analysis. Data points represent quantified proteins in Prx-/- compared to wild-type myelin plotted as the log2-transformed fold-change (FC) on the x-axis against the -log10-transformed q-value on the y-axis. Note the different axis scale compared to Figure 5D. Stippled line marks a -log10-transformed q-value of 1.301, reflecting a q-value of 0.05 as significance threshold. Highlighted is the datapoint for PRX to illustrate that only trace amounts of PRX were detected when assessing Prx-/- myelin. ATP2A1, ATP1A4 and PLCD1 were not detected in Prx-/- myelin.