. 2020 Feb 19;9:e48705. doi: 10.7554/eLife.48705

Figure 2. Motor dysfunctions of Stxbp1 haploinsufficient mice.

(A) Representative tracking plots of the mouse positions in the open-field test. Note that Stxbp1tm1d/+ and Stxbp1tm1a/+ mice traveled less in the center (dashed box) than WT mice. (B–E) Summary data showing hyperactivity and anxiety-like behaviors of Stxbp1tm1d/+ and Stxbp1tm1a/+ mice in the open-field test. Stxbp1tm1d/+ and Stxbp1tm1a/+ mice showed an increase in the total moving distance (B) and speed (C), and a decrease in the ratio of center moving distances over total moving distance (D) and vertical activity (E). (F–H) Stxbp1tm1d/+ and Stxbp1tm1a/+ mice had weaker forelimb grip strength (F), made more foot slips per travel distance on a wire grid (G), and took more time to get down from a vertical pole (H). The numbers and ages of tested mice are indicated in the figures. Each filled (male) or open (female) circle represents one mouse. Bar graphs are mean ± s.e.m. *, p<0.05; **, p<0.01; ***, p<0.001; ****, p<0.0001.

Figure 2.

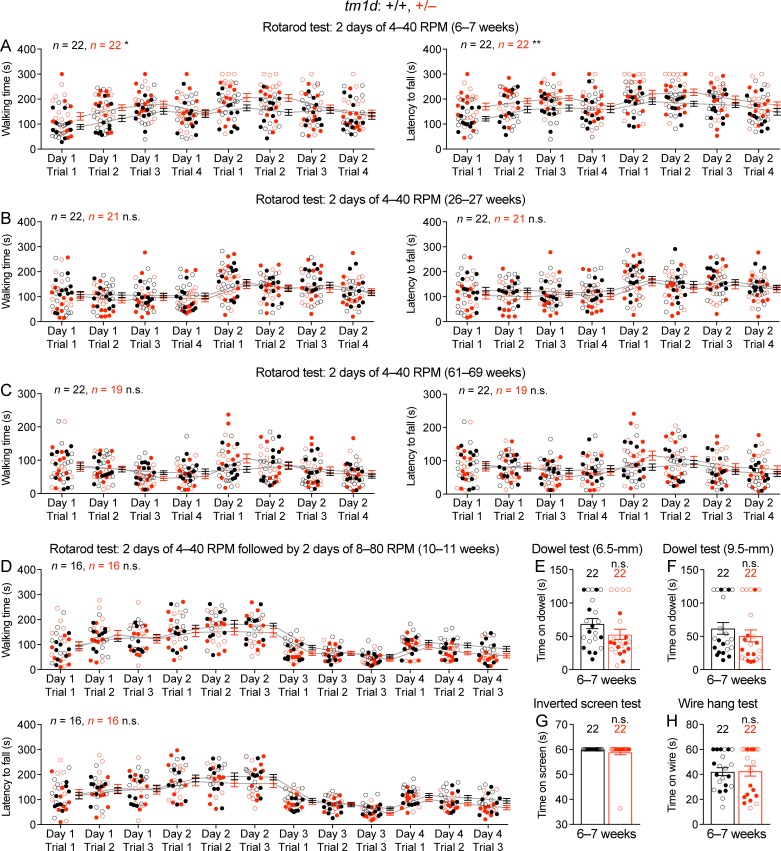
Figure 2—figure supplement 1. Normal performance of Stxbp1tm1d/+ mice in rotarod, dowel, inverted screen, and wire hang tests.

Figure 2—figure supplement 1.

(A) In the 2 day rotarod test, 6–7 week old Stxbp1tm1d/+ mice performed better than WT mice, as they were able to walk (left panel) and stay (right panel) on the rotating rod for longer time, probably due to their lower body weights or hyperactivity. (B,C) Similar to (A), but for the ages of 26–27 weeks (B) and 61–69 weeks (C). Stxbp1tm1d/+ mice performed similar to WT mice. (D) In the 4 day rotarod test, Stxbp1tm1d/+ mice performed similar to WT mice at the age of 10–11 weeks. (E,F) Stxbp1tm1d/+ mice could stay on the dowel (6.5- or 9.5 mm diameter) for similar amount of time as WT mice. (G,H) Stxbp1tm1d/+ mice could hang on the screen (G) or wire (H) for similar amount of time as WT mice. The numbers and ages of tested mice are indicated in the figures. Each filled (male) or open (female) circle represents one mouse. Bar graphs are mean ± s.e.m. n.s., p>0.05; *, p<0.05; **, p<0.01.
Figure 2—figure supplement 2. Stxbp1 haploinsufficient mice have normal sensory functions.

Figure 2—figure supplement 2.

(A) Stxbp1tm1d/+ and Stxbp1tm1a/+ mice showed similar acoustic startle responses as WT mice at different sound levels. (B) In the pre-pulse inhibition test, when a weak sound (74, 78, or 82 dB) preceded a loud sound (120 dB), Stxbp1tm1d/+ and Stxbp1tm1a/+ mice showed a similar reduction in the startle responses to the loud sound as WT mice. (C) In the hot plate test, Stxbp1tm1d/+ and Stxbp1tm1a/+ mice showed similar latencies in response to the high temperature as WT mice. The numbers and ages of tested mice are indicated in the figures. Each filled (male) or open (female) circle represents one mouse. Bar graphs are mean ± s.e.m. n.s., p>0.05.