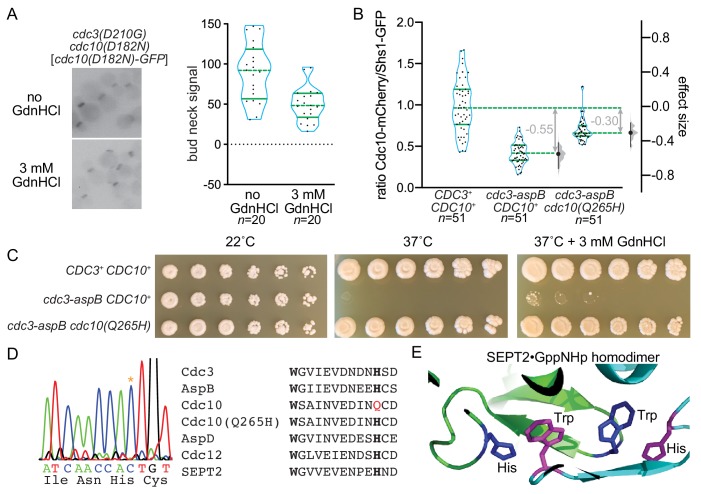
Figure 8. Reversing evolution to reactivate Cdc3 GTPase activity allows Cdc10 bypass during septin hetero-oligomerization.
(A) Strain MMY0130, which carries the mutations cdc3(D210G) cdc10(D182N), was transformed with plasmid YCpK-Cdc10-1-GFP and cultured in rich (YPD) medium containing G-418 for plasmid selection in the presence or absence of GdnHCl. Bud neck fluorescence was measured as in Figure 2B. (B) Haploid strains of the indicated genotypes expressing Cdc10-mCherry and Shs1-GFP were imaged as in (A) but in the absence of GdnHCl and for both mCherry and GFP fluorescence. For each cell, the ratio of mCherry to GFP signal was calculated; values are plotted on the left axis, with overlaid blue violin plots to show how the data are distributed, and median (dashed lines) and quartiles (solid lines) shown in green. The right axis shows the median difference (‘effect size’) for comparisons of the mutant strains against the shared wild-type control, plotted as bootstrap sampling distributions (gray violin plots). Each median difference is depicted as a block dot, with the value of that difference given in gray. Each 95% confidence interval is indicated by the ends of the vertical error bars. Strains were: MMY0342, MMY0343, and MMY0350. Protein sequence differences between the versions of Cdc3 present in these strains are detailed in Figure 8—figure supplement 1. Effects of specific individual substitutions on Cdc10-mCherry incorporation are shown in Figure 8—figure supplement 2. (C) Serial dilutions of the strains in (B) were spotted on rich (YPD) agar media with or without GdnHCl and incubated for 4 days at the indicated temperatures. (D) A portion of the CDC10 coding sequence was amplified by PCR and sequenced. Asterisk in the chromatograph at left shows the mutation resulting in the amino acid change Q265H. Right, alignment of septin sequences surrounding the conserved Trp (bold) of the Sep4 motif and the His (bold) with which this Trp interacts across the G interface in the SEPT2 homodimer, as illustrated in (E). Red, Gln265 in wild-type Cdc10. (E) The Trp and His residues of the Sep4 motif in the SEPT2•GppNHp homodimer crystal structure (PDB 3FTQ).
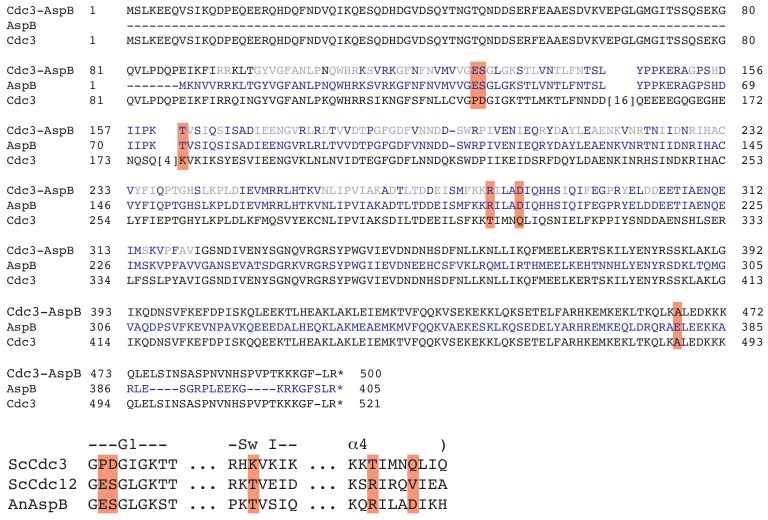
Figure 8—figure supplement 1. Sequence of the Cdc3-AspB chimeric protein and comparison of key residues between Cdc3, AspB, and Cdc12.
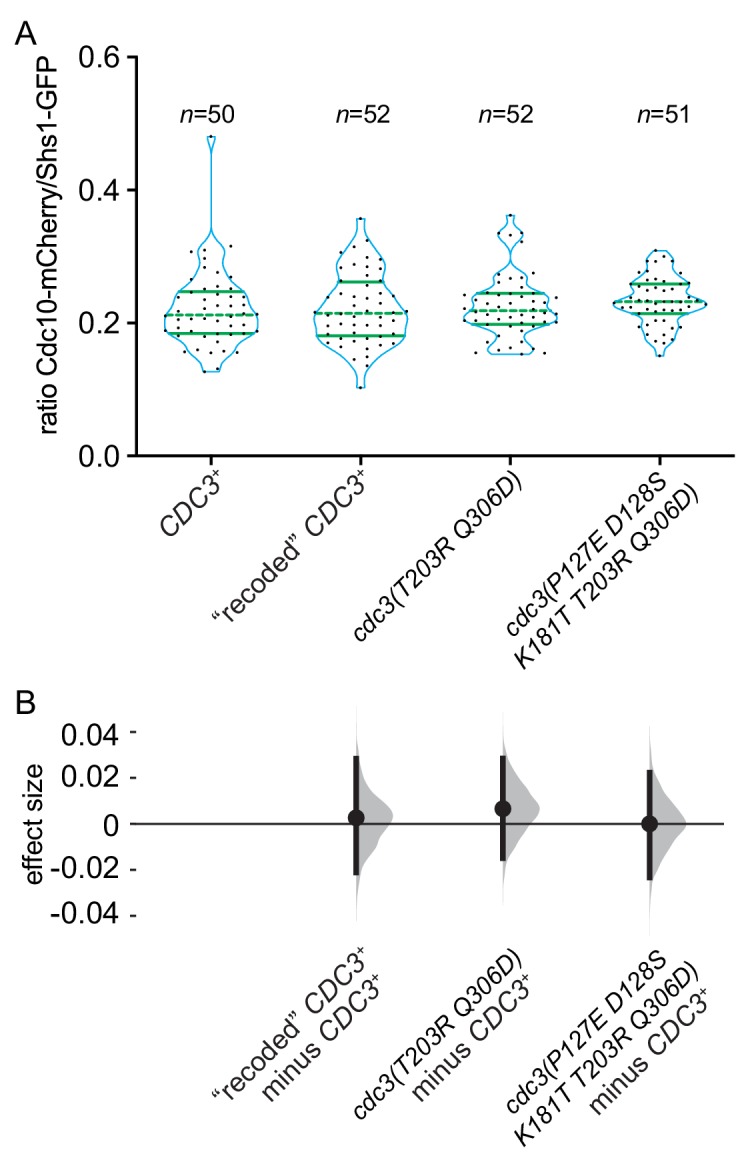
Figure 8—figure supplement 2. Five substitutions in the GTPase domain of Cdc3 are insufficient to promote bypass of Cdc10 during septin assembly.


