Abstract
Background
The visual pathway is commonly involved in multiple sclerosis (MS), even in its early stages, including clinical episodes of optic neuritis (ON). The long-term structural damage within the visual compartment in patients with ON, however, is yet to be elucidated.
Objective
Our aim was to characterize visual system structure abnormalities using MRI along with optical coherence tomography (OCT) and pattern-reversal visual evoked potentials (VEPs) depending on a single history of ON.
Methods
Twenty-eight patients with clinically definitive MS, either with a history of a single ON (HON) or without such history and normal VEP findings (NON), were included. OCT measures comprised OCT-derived peripapillary retinal nerve fiber layer (RNFL) and macular ganglion cell/inner plexiform layer (GCIPL) thickness. Cortical and global gray and white matter, thalamic, and T2 lesion volumes were assessed using structural MRI. Diffusion-weighted MRI-derived measures included fractional anisotropy (FA), mean (MD), radial (RD), and axial (AD) diffusivity within the optic radiation (OR).
Results
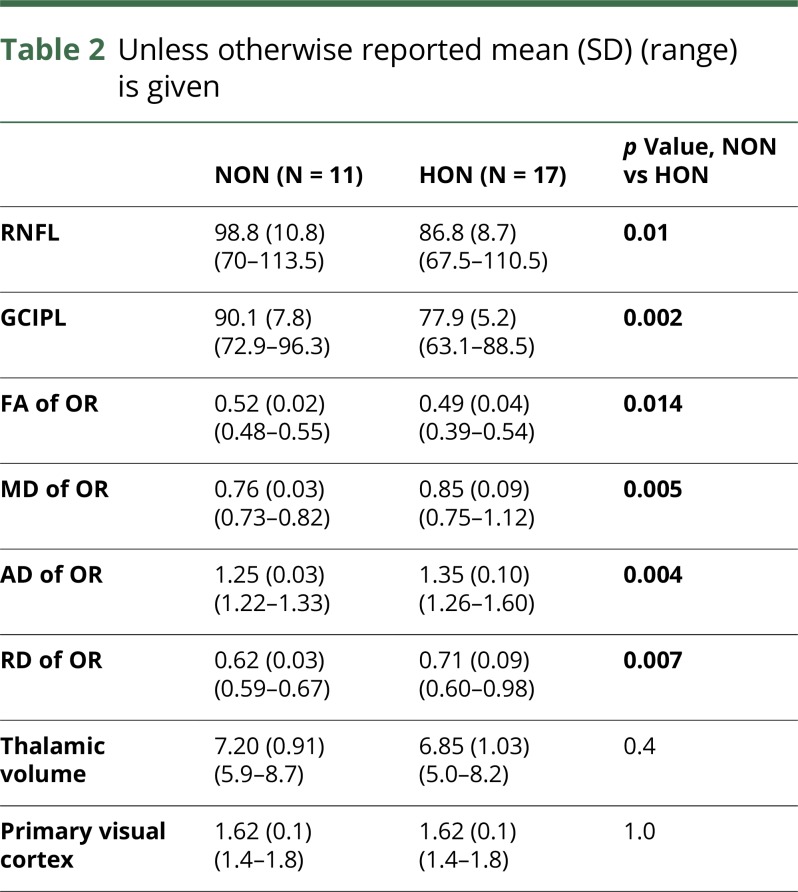
Mean (SD) duration after ON was 8.3 (3.7) years. Compared with the NON group, HON patients showed significant RNFL (p = 0.01) and GCIPL thinning (p = 0.002). OR FA (p = 0.014), MD (p = 0.005), RD (p = 0.007), and AD (p = 0.004) were altered compared with NON. Global gray and white as well as other regional gray matter structures did not differ between the 2 groups.
Conclusion
A single history of ON induces long-term structural damage within the retina and OR suggestive of both retrograde and anterograde neuroaxonal degeneration.
Diffuse inflammatory demyelination of CNS axons and neuroaxonal injury, both within the lesioned white matter (WM) and the so-called normal-appearing WM (NAWM) have been described histologically as pathologic hallmarks in patients with multiple sclerosis (MS), next to focal inflammatory lesions and axonal transection.1 Both focal and nonfocal pathology appear associated with neuronal loss2 and long-term disability.3 However, the long-term impact of any acute clinical episode with a focally demyelinating lesion on specific neuronal networks involving several synapses within a confined functional system is less well understood. In addition, the impact of any such acute event may well be confounded by the occurrence of subclinical demyelination located within such networks.
Diffusion-weighted MRI (dMRI) measures and volumetry studies derived from structural MRI T1 sequences have shown good sensitivity in MS for detecting and quantifying NAWM damage in vivo4 as well as (deep) gray matter (GM) volume loss.5 Combining structural and quantitative MRI with optical coherence tomography (OCT), which allows rapid in vivo quantification of both neuronal (ganglion cell layer [GCL]) and axonal (retinal nerve fiber layer [RNFL]) retinal tissues, nearly the entire visual pathway can be probed both in the presence and in the absence of an acute inflammatory event that manifests clinically as optic neuritis (ON). As a consequence, the visual pathway could represent an ideal model to assess trans-synaptic degeneration in MS6–8 as a model system for different functional CNS loops.
To date, combined OCT and MRI studies in MS have not considered the timespan after the clinical episode of ON9,10 or have focused on short-term structural changes within the WM, such as the optic radiation (OR)8,11 or global GM,12 as well as cortical abnormalities.13 In addition, the sensitivity and reliability of volumetric measures of deep GM were lower when MRIs had been acquired on 1.5 T scanners14 and OR results depended critically on the fiber tracking techniques applied.15–17 In a recent previous study, we have already documented significant changes in retinal structures and diffusion values within the OR by comparing patients with MS with healthy controls.18
The aim of our current study was to characterize and quantify long-term structural abnormalities spanning from the retina to the primary visual cortex using OCT and high-resolution conventional and quantitative MRI at 3 T in patients with and without a history of ON.
Methods
Participants
Twenty-eight patients with a confirmed diagnosis of clinically definite relapsing-remitting MS according to the 2010 McDonald criteria19 were enrolled in this study. Participants were prospectively recruited at the Department of Neurology, Otto von Guericke University Magdeburg, Germany. Disease duration was defined as the time between diagnosis of MS and the MRI performed for the purpose of this study.
Inclusion criteria for patients were defined as follows: patients with a single history of unilateral ON (HON) which occurred more than a year ago. Patients without a history of ON (NON) were defined by the absence of clinical or subclinical (normal visual evoked potential [VEP] latency) evidence of ON. Clinical disability was assessed using the Expanded Disability Status Scale (EDSS).20 Visual acuity measurements were taken by an ophthalmologist (M.W.). Participants with a history of ophthalmologic diseases other than HON or a refractive error ≥ ±5.0 dpt. were not included.
Standard protocol approvals, registrations, and patient consents
The study was approved by the local ethics committee of the Otto von Guericke University Magdeburg, Germany (No 74/14), and all participants provided written informed consent.
Pattern-reversal VEPs
VEPs were recorded in a dimly lit room with gold-cup electrodes at Oz referenced to Fz.21 The ground electrode was attached to Fpz. The EEG was amplified with a physiologic amplifier (Grass, 50.000 x), analog filtered in the range of 0.3–100 Hz and digitized at a rate of 1 kHz with 12-bit resolution. For visual stimulation, black-and-white checkerboard patterns (stimulus contrast: 98%; mean luminance: 110 cd/m2; visual field: 19° × 15°; check sizes: 0.22°, 0.39°, and 0.79°) were presented monocularly at a viewing distance of 114 cm in pattern reversal mode (2 reversals per second). Left and right eyes were stimulated in separate blocks while the respective fellow eye was patched. The blocks, comprising 40 repetitions per check size, were presented in a balanced interleaved sequence (“a-b-b-a”–scheme). Stimulation (frame rate 75 Hz) and recording used the “EP2000 Evoked Potentials System” (michaelbach.de/ep2000.html) running on a G4 Power Macintosh. This program presented the stimuli while stepping through the check size sequence, acquired the signals, displayed them online, checked for and discarded artifacts (using an amplitude window of generally ±50 μV and repeating sweeps where this was exceeded), displayed online averages, and saved the records for offline processing. To ensure subject alertness, random digits from 0 to 9 appeared in random intervals at the center of the screen and were reported by the subjects. The subjects were instructed to maintain fixation at a central target (1.5° radius) and wore optimal refractive correction. The offline analysis was performed using IGOR 5.0 (WaveMetrics, Inc., OR). The VEPs were digitally low-pass filtered (40 Hz cutoff) after averaging across repetitions of the same conditions (i.e., a total of 80 trials per condition). As an indicator of neuritis-related VEP changes, the VEPs for 0.79° check size entered further analysis, i.e., P100 amplitude and peak-time were determined according to the International Society for Clinical Electrophysiology of Vision-VEP standard.22 Pathologic VEPs were defined as P100 latency times of more than 120 ms.
Optical coherence tomography
OCTs were entirely performed by an experienced ophthalmologist (M.W.) on undilated eyes using a spectral domain OCT device (Heidelberg Spectralis®, Heidelberg Engineering, Heidelberg, Germany). All scans underwent rigid quality control according to the validated OSCAR-IB criteria23 at the OCT reading center at the University Hospital of Zurich (Neuro-OCT), Zurich, Switzerland (S.S.). All participants were examined using the peripapillary ring scan, which measures the RNFL thickness around the optic nerve head with an angle of 12°, resulting in a diameter of 3.4 mm. The macula scan consisted of a custom-made scan comprising 61 vertical B-scans (each with 768 A-Scans, automatic real-time = 13 frames) with a scanning angle of 30° × 25° focusing on the fovea. Based on the macular scan, ganglion cell/inner plexiform layer (GCIPL) thickness was computed using a beta software provided by Heidelberg Engineering that used a multilayer segmentation algorithm, previously described by Oberwahrenbrock et al.24 GCL and inner plexiform (IPL) layers were combined (GCIPL), given the minimal contrast between the 2 layers. Thicknesses of RNFL and GCIPL are given in µm.
MRI
Acquisition and data preprocessing
All imaging data were acquired on a Siemens MAGNETOM Prisma 3 Tesla MRI scanner with syngo MR D13D software and a 20-channel head coil. For further details of the MR protocol, see the method section of our previous work.18
The FMRIB software library (FSL; University of Oxford, fsl.fmrib.ox.ac.uk) version 5.0.9 was used for preprocessing. To correct for eddy current-induced distortions, the diffusion-weighted imaging (DWI) images were registered to a corresponding b = 0 image based on a 12-dof affine transformation using eddy_correct with spline interpolation.25 To account for head movement, we computed an affine transformation from each block's nondiffusion-weighted volume to the first b = 0 image using FLIRT.26 The DWI images as corresponding diffusion gradient vectors of each block were then realigned based on these transformations. Geometric distortions induced by magnetic field inhomogeneity were corrected based on the GRE field map, and the diffusion data were registered to the corresponding structural scan. These steps, EPI distortion correction and EPI-to-magnetization prepared rapid acquisition gradient echo (MPRAGE) registration, were performed simultaneously using epi_reg.
Diffusion tensors were fitted with dtifit to obtain the eigenvalues and eigenvectors for each voxel from which the fractional anisotropy (FA), mean diffusivity (MD), axial diffusivity (AD), and radial diffusivity (RD) were calculated. FA describes the strength of orientation in the regional random motion of the water molecules in the brain; it can be measured for each voxel indicating fiber density and thus the degree of myelination of WM tracts.27 In addition, MD describes the total diffusion within a voxel. It comprises the average of the 3 eigenvalues of the diffusion tensor and indicates both axonal integrity and the degree of myelination of WM bundles. By contrast, AD defines the mean diffusion coefficient of water molecules diffusing parallel to the WM tract within the voxel and RD describes the magnitude of water diffusion perpendicular to the tract. Lower compared with higher FA values represent a loss of WM integrity, whereas lower compared with higher MD and RD values indicate better preservation of myelination of WM tracts.28 For AD, increased values were observed in chronically damaged WM fibers and seem to mirror the degree of mainly lesional axonal loss.29
WM lesion segmentation and volume measurements
In addition, the WM lesions were segmented by the lesion prediction algorithm (LPA) implemented in the LST toolbox version 2.0.15 (statistical-modelling.de/lst.html) for SPM12 (University College London, fil.ion.ucl.ac.uk/spm), as first described by Schmidt et al.30 The DWI coregistered MPRAGE image was used as a reference image. LPA is based on a binary classifier in the form of a logistic regression model trained on the data of 53 patients with MS with lesions from the Department of Neurology, Technische Universität München (Munich, Germany). We used LPA to compute a voxel-wise estimate of lesion probability for each subject.30 The resulting subject-specific lesion probability maps were binarized using a probability threshold of 0.3 to obtain binary lesion maps. All automatically segmented lesions were manually corrected by 2 experienced investigators (M.H., M.P.). Moreover, MRI scans were examined for the detection of lesions within the anterior visual pathway (optic nerve, chiasm, and optic tract). Lesion volumes are given in ml.
Fiber tracking of OR
For the fiber tracking procedure, we applied the MRtrix3 software package,31 which we described in our previous work in detail.18 In short, using dwi2response (with the “dhollander” algorithm for multishell data),32 we estimated response functions from the preprocessed diffusion-weighted images. These were then used to estimate fiber orientation distributions (FODs) based on 8th order constrained spherical deconvolution (CSD) using dwi2fod.33 Specifically, we used the msmt_csd algorithm, which facilitates the computations of 3 separate FODs for WM, GM, and CSF based on multishell data. For fiber tracking, we then used tckgen with the iFOD2 (improved 2nd order integration over FODs) algorithm. The anatomically constrained tractography (MRtrix/ACT) option was applied, which facilitates biologically plausible fiber reconstruction of the OR in patients with MS than anatomically unconstrained tracking procedures (figure 1).18 MRtrix/ACT needs a 5tt (5-tissue-type) file to stay within anatomically meaningful borders. It was computed from the high resolution MPRAGE image with 5ttgen_fsl using the FSL segmentation tools FIRST and included partitions of CSF, WM, GM, and subcortical GM. Previously determined FLAIR-lesion maps were than integrated into this file. The MRtrix/ACT was run in a one-way direction with a maximum angle between successive steps of 90° and a fixed step size of 0.5 mm. A tract density image was computed from the generated tracks and then thresholded to the median to get binary masks. The last step was to read out the mean microstructural data (FA, MD, RD, and AD) from these masks over the computed OR regions of interest using fslstats.
Figure 1. Visualization of the OR using MRtrix3 with anatomically constrained tracking.
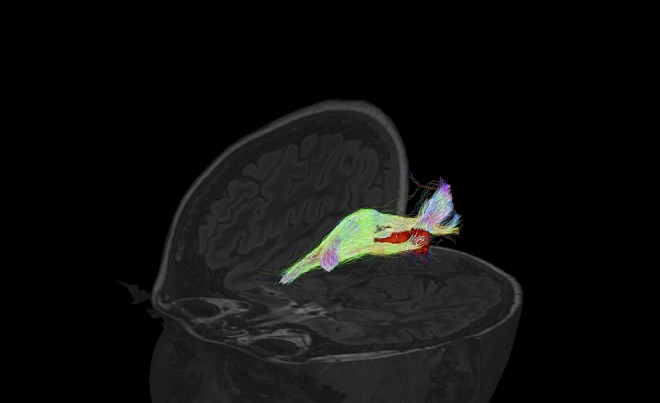
Example from an anatomically constrained tractography of the right OR of a patients with MS with lesion inside the optic radiation (directions are color scaled). OR = optic radiation
Brain and thalamic volume measurements
T1 MPRAGE images were segmented into probabilistic tissue class images of GM, WM, and CSF using a combined segmentation and registration approach (unified segmentation)34 as implemented in the Statistical Parametric Mapping 12 (SPM12, 2013) software package. GM and WM volumes (GMV and WMV) were determined by an integration of all voxels of the corresponding probabilistic tissue class images. Brain parenchymal volume (BPV) was defined as the sum of GMV and WMV. The total intracranial volume (TIV) was defined as the sum of GMV, WMV, and CSF.
GMV and WMV as well as BPV correlate with TIV and age.35 Therefore, the brain volumes were adjusted for TIV by computing the residuals with a linear regression function (we regressed out the confounder TIV). The linear regression function was estimated based on brain volumes obtained from the T1-weighted MR images of a cohort of 316 healthy control subjects provided by the Open Access Series of Imaging Studies (OASIS).36 Furthermore, a nonlinear regression technique was applied to the brain volumes of the 316 healthy control subjects from publicly available OASIS database to derive the age-volume trajectory of physiologic aging as described recently.37 Subsequently, individual TIV-adjusted brain volumes were adjusted for age by computing the residuals regarding the estimated age-volume trajectories.
Thalamic volume was obtained by a fully automated segmentation pipeline (FSL-FIRST, v. 5.0; The Analysis Group, Oxford, UK). All values are given in cm3.
Regional cortical thickness
Cortical reconstruction, volumetric segmentation, and thickness measures (mm) of the primary visual cortex (V1) were performed with established software of FreeSurfer.38
Statistics
In general, axons originating from GCL neurons partially cross to the contralateral hemisphere within the chiasm, and thus, the OR consists of axons from both eyes. Therefore, we calculated mean values for VEP (P100 latency, amplitude), OCT (RNFL and GCIPL) from both the eyes, and MRI values (FA, MD, RD, and AD of OR; thalamic volume V1 thickness) from both the brain hemispheres. Statistical analysis was performed using SPSS 21 (IBM). For differences between groups (HON vs NON), basic demographic and clinical (e.g., age, disease duration, and EDSS) as well as global visual (visual acuity, VEP latency, and amplitude) and MRI measures (e.g., BPV, GMV, and WMV) were compared with the respective categorical (using a χ2-test) and continuous variables (using a t test or Mann-Whitney U test).
Subsequently, an analysis of variance with the OR lesion volume as a covariate was conducted with RNFL, GCIPL, thalamic volume, V1 and FA, MD, RD, and AD of OR as respective dependent variable and group as independent binary variable.
The associations between EDSS, VEP, OCT, and MRI results were explored using Spearman correlations (rho). Because all MRI metrics and OCT values as well as VEP measurements are inter-related and because of the exploratory nature of the study, no correction for multiple comparisons was performed.
Data availability
Any data not published within the article are available, and the anonymized data will be shared by request from any qualified investigator.
Results
Baseline demographics of the cohort and clinical data are given in table 1. Twenty-three (82%) patients were on immunomodulatory treatment, comprising (n) glatiramer acetate (5), interferon beta-1a (7), fingolimod (4), dimethyl fumarate (3), teriflunomide (1), and natalizumab (3). Seventeen patients were grouped as HON, whereas 11 patients had no ON history including normal VEP measures.
Table 1.
Unless otherwise reported mean (SD) (range) is given
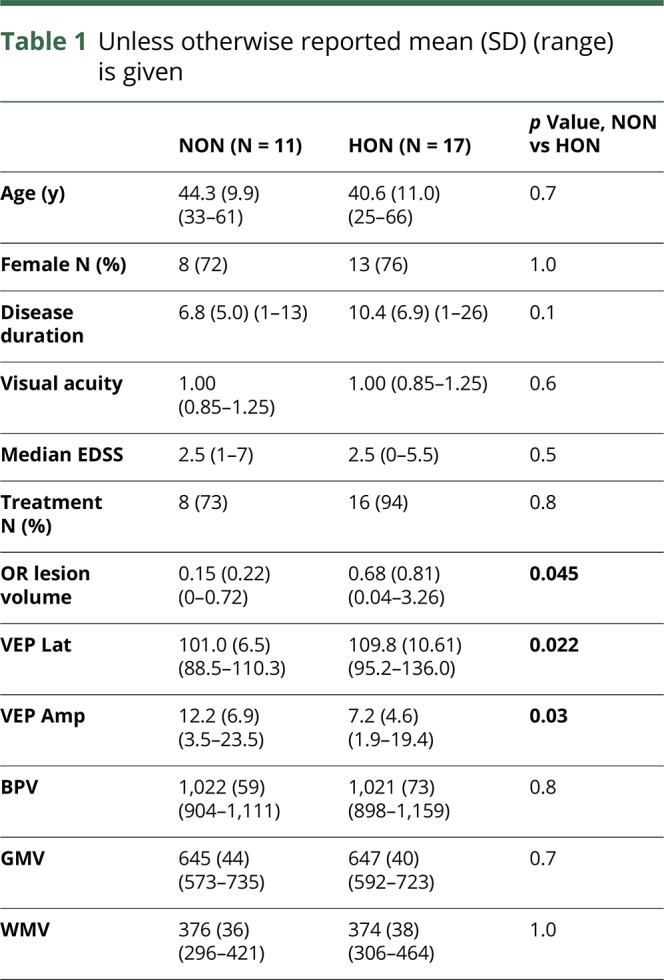
P100 latency and amplitude of VEP differed significantly between both groups (p = 0.022, p = 0.03). Mean (SD) time since ON was 8.3 (3.7) years. Age and sex were not different between HON and NON groups. In addition, HON and NON groups did not differ regarding median visual acuity, disease duration, and median EDSS (table 1). No patient presented MRI lesions along the anterior visual pathway (from chiasm to thalamus). The BPV, WMV, and GMV did not differ between the NON and HON groups.
Functional visual and MRI data related to visual pathway structures are detailed in table 2. Our analysis revealed significant mean (SD) reductions of GCIPL (p = 0.002) and RNFL thickness (p = 0.01) in HON compared with NON patients. Our MRI measures showed reduced OR FA (p = 0.014) and increased OR MD (p = 0.005), RD (p = 0.007), and AD (p = 0.004) in HON patients compared with NON (figure 2). Thalamic volume and V1 thickness did not differ between the groups.
Table 2.
Unless otherwise reported mean (SD) (range) is given
Figure 2. Diffusion-weighted MRI-derived measures within the OR.

MD, RD, and AD are given in mm2/s * 10−3. Boxes indicate the interquartile range, bars indicate median values, and whiskers present the 95% CI. The dots present the individual values. Group comparisons were conducted using analysis of variance with the OR lesion volume as a covariate. p values < 0.05 were deemed to be statistically significant. Corrections for type-I errors were performed using the Holm-Bonferroni method on the resulting p values. Diffusion tensor imaging derived FA, MD, RD, and AD within the OR of ON group were altered compared with NON. AD = axial diffusivity, FA = fractional anisotropy, HON = history of optic neuritis, MD = mean diffusivity, NON = no history of optic neuritis, RD = radial diffusivity; ON = optic neuritis; OR = optic radiation.
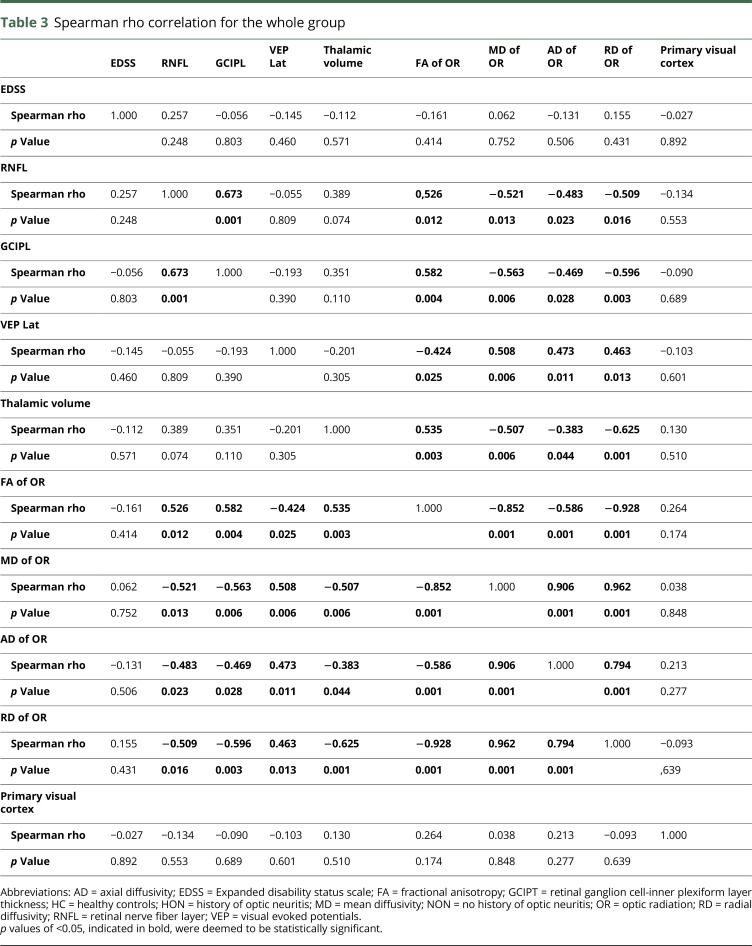
When considering the whole sample, we found significant correlations between the GCIPL and OR values as well as between the latter and thalamic volume. However, neither VEP nor OCT or MRI values correlated with clinical disability (EDSS) (table 3).
Table 3.
Spearman rho correlation for the whole group
Discussion
We aimed to investigate long-term structural visual pathway abnormalities among patients with MS with a single and without a history of clinical ON using a combined VEP, OCT, and quantitative MRI approach. We identified significant changes for retinal measures (peripapillary RNFL and macular GCIPL) and OR FA, MD, RD, and AD when comparing HON and NHON patients. Our results suggest that structural damage to the optic nerve following ON is associated with MRI abnormalities along the WM of the OR and significant thinning of the RNFL and macular GCIPL. These findings were unrelated to differences in clinical baseline data, OR lesion load, and global brain volumes between ON and NON groups. Moreover, thalamic structural damage correlated with diffusion changes within OR. Taken together, our findings are indicative of both retrograde (RNFL, GCIPL) and anterograde, trans-synaptic degeneration (OR FA, MD, RD and AD) following episodes of ON.
A number of combined OCT/MRI studies have already been conducted in patients with MS.9,11,12,39,40 However, most investigations have focused mainly on associations between neuronal and axonal loss within the retina and global brain atrophy, suggesting the favorable role as a potential biomarker for neurodegeneration in MS.6,7,9,12,39,40 Retinal thinning appears to correlate with global GM and WM volume loss, and in particular a relationship to directly connected deep and cortical GM compartments has also been demonstrated.10,41,42 In addition, regional subcortical volume loss with reduced thalamic volume was previously reported in patients with MS42 and was correlated with OR pathology and GCIPL thinning in our cohort. The missing thalamic volume difference between our groups might be explained by the central position not only within the visual pathway that renders it vulnerable to both retrograde and anterograde trans-synaptic neurodegeneration.43 However, a recent study confirmed relevant volume loss also in thalamic lateral geniculate nucleus in patients with MS.42
We did not document differences of cortical thickness within V1 between both groups. However, as we reported previously, there were no differences between our patients with MS compared with healthy subjects,18 either, in contrast to few previous investigations.13,44 Such conflicting findings regarding regional cortical changes may be explained by a larger WM lesion burden within the OR13 or larger sample sizes.45 In addition, studies using higher MRI field strengths6 or selective magnetization transfer ratio46 could identify occipital GM thinning after HON in contrast to healthy controls.
Alterations within the OR were also shown by several investigators and are associated with visual disability,15,45 however, often referred to as OR lesions burden.29,47 Owing to both the frequent affection of the OR by WM lesions and the wide spread of WM tracts29 and GM changes, the sensitivity to identify the OR in general and in particular the MS-related neuroinflammatory damage depends on the fiber tracking method applied.16,18 Because our tracking procedure specifically takes advantage of the available anatomical and lesion information during tracking, a reliable localization of the OR and a higher sensitivity to detect MS-related structure loss could be realized.18
In conclusion, the diffusion alterations identified within the OR of HON patients' lesions within the postchiasmatic visual pathway further strengthen the concept of anterograde trans-synaptic degeneration in inflammatory autoimmunity involving the visual pathway.45 In addition to previous results documenting trans-synaptic degeneration within 1 year after an ON,8,11 we have shown that a single clinical ON episode can also induce long-term (mean [SD] duration after ON was 8.3 [3.7]) WM alterations, which have also been related to neuronal damage in longstanding disease course.39
Retinal damage has also been shown in large cohorts comparing NON eyes with healthy controls but was less severe compared with HON eyes.48 However, changes within unaffected MS eyes, particularly the GCIPL, correlated with delayed cortically generated visual evoked responses,49 OR diffusion metrics,9,17 and brain volume reductions39,40 and revealed coexisting ongoing (silent) neurodegeneration. Nevertheless, retrochiasmatic pathology, e.g., the OR lesion load or subclinical inflammation within optic nerve, could be suggested as the main drivers of such progressive retinal injury.
Limitations of the present study include the cross-sectional nature and the relatively small sample size. Future studies should compare acute with chronic ON histories to better characterize the temporal dynamics of trans-synaptic degeneration. Another limitation is the absence of measures of other WM tracts (e.g., corticospinal tract), which also may affect thalamic integrity and could confound the association between optic nerve damage and thalamic volume. Moreover, alterations of diffusion values such as the AD are additionally caused by focal inflammation e.g., OR lesions.29 Thus, long-term changes within the OR after ON could be analyzed e.g., in neuromyelitis optica spectrum disorder, which is typically not characterized by high OR lesion load.50 Long-term follow-up of these patients is required to evaluate correlations between dMRI measures and clinical state.
Acknowledgment
The authors thank Juliane Muenzberg, Department of Ophthalmology, and Erhard Stadler, Department of Neurology, Otto von Guericke University, Magdeburg, Germany, for excellent technical assistance.
Glossary
- 5tt
5-tissue-type
- ACT
anatomically constrained tractography
- AD
axial diffusivity
- BPV
brain parenchymal volume
- dMRI
diffusion-weighted MRI
- EDSS
Expanded Disability Status Scale
- FA
fractional anisotropy
- FOD
fiber orientation distribution
- GCIPL
ganglion cell/inner plexiform layer
- GCL
ganglion cell layer
- GM
gray matter
- GMV
gray matter volume
- HON
history of optic neuritis
- IPL
inner plexiform
- LPA
lesion prediction algorithm
- MD
mean diffusivity
- NAWM
normal appearing WM
- NON
no history of optic neuritis
- OASIS
Open Access Series of Imaging Studies
- OCT
optical coherence tomography
- ON
optic neuritis
- OR
optic radiation
- RD
radial diffusivity
- RNFL
retinal nerve fiber layer
- TIV
total intracranial volume
- VEP
visual evoked potential
- WM
white matter
- WMV
white matter volume
Appendix. Authors
Footnotes
Editorial, page e667
Study funding
The study was financially supported by Novartis.
Disclosure
M. Pawlitzki received speaker honoraria from Roche, Genzyme, and Novartis and travel/accommodation/meeting expenses from Novartis, Biogen, Genzyme, and Merck Serono. M. Horbrügger received speaker honoraria from Roche. K. Loewe has no conflicts of interest. J. Kaufmann has no conflicts of interest. R. Opfer is employed by jung diagnostics GmbH, Germany and has nothing to disclose. M. Wagner has no conflicts of interest. K.O. Al-Nosairy has no conflicts of interest. S.G. Meuth receives honoraria for lecturing and travel expenses for attending meetings from Almirall, Amicus Therapeutics Germany, Bayer Health Care, Biogen, Celgene, Diamed, Genzyme, MedDay Pharmaceuticals, Merck Serono, Novartis, Novo, Nordisk, ONO Pharma, Roche, Sanofi-Aventis, Chugai Pharma, QuintilesIMS, and Teva. His research is funded by the German Ministry for Education and Research (BMBF), Deutsche Forschungsgemeinschaft (DFG), Else Kröner Fresenius Foundation, German Academic Exchange Service, Hertie Foundation, Interdisciplinary Center for Clinical Studies (IZKF) Muenster, German Foundation Neurology, Almirall, Amicus Therapeutics Germany, Biogen, Diamed, Fresenius Medical Care, Genzyme, Merck Serono, Novartis, ONO Pharma, Roche, and Teva. M.B. Hoffmann has no conflicts of interest. S. Schippling has received research grants from Novartis and Sanofi Genzyme and consultancy and speaking fees from Biogen, Merck Serono, Novartis, Roche, Sanofi Genzyme, and Teva, and is supported by the Clinical Research Priority Program (CRPP) of the University of Zurich and the Swiss National Science Foundation (SNSF) (SNF 320030_175770). Go to Neurology.org/NN for full disclosures.
References
- 1.Trapp BD, Peterson J, Ransohoff RM, Rudick R, Mörk S, Bö L. Axonal transection in the lesions of multiple sclerosis. N Engl J Med 1998;338:278–285. [DOI] [PubMed] [Google Scholar]
- 2.Steenwijk MD, Daams M, Pouwels PJW, et al. What explains gray matter atrophy in long-standing multiple sclerosis? Radiology 2014;272:832–842. [DOI] [PubMed] [Google Scholar]
- 3.Popescu V, Agosta F, Hulst HE, et al. Brain atrophy and lesion load predict long term disability in multiple sclerosis. J Neurol Neurosurg Psychiatry 2013;84:1082–1091. [DOI] [PubMed] [Google Scholar]
- 4.Seewann A, Vrenken H, van der Valk P, et al. Diffusely abnormal white matter in chronic multiple sclerosis: imaging and histopathologic analysis. Arch Neurol 2009;66:601–609. [DOI] [PubMed] [Google Scholar]
- 5.Tiberio M, Chard DT, Altmann DR, et al. Gray and white matter volume changes in early RRMS: a 2-year longitudinal study. Neurology 2005;64:1001–1007. [DOI] [PubMed] [Google Scholar]
- 6.Graham SL, Klistorner A. Afferent visual pathways in multiple sclerosis: a review. Clin Exp Ophthalmol 2017;45:62–72. [DOI] [PubMed] [Google Scholar]
- 7.Manogaran P, Hanson JVM, Olbert ED, et al. Optical coherence tomography and magnetic resonance imaging in multiple sclerosis and neuromyelitis optica spectrum disorder. Int J Mol Sci 2016;17:E1894. [DOI] [PMC free article] [PubMed] [Google Scholar]
- 8.Puthenparampil M, Federle L, Poggiali D, et al. Trans-synaptic degeneration in the optic pathway. A study in clinically isolated syndrome and early relapsing-remitting multiple sclerosis with or without optic neuritis. PLoS One 2017;12:e0183957. [DOI] [PMC free article] [PubMed] [Google Scholar]
- 9.Scheel M, Finke C, Oberwahrenbrock T, et al. Retinal nerve fibre layer thickness correlates with brain white matter damage in multiple sclerosis: a combined optical coherence tomography and diffusion tensor imaging study. Mult Scler 2014;20:1904–1907. [DOI] [PubMed] [Google Scholar]
- 10.Saidha S, Al-Louzi O, Ratchford JN, et al. Optical coherence tomography reflects brain atrophy in multiple sclerosis: a four-year study. Ann Neurol 2015;78:801–813. [DOI] [PMC free article] [PubMed] [Google Scholar]
- 11.Tur C, Goodkin O, Altmann DR, et al. Longitudinal evidence for anterograde trans-synaptic degeneration after optic neuritis. Brain 2016;139(pt 3):816–828. [DOI] [PMC free article] [PubMed] [Google Scholar]
- 12.Young KL, Brandt AU, Petzold A, et al. Loss of retinal nerve fibre layer axons indicates white but not grey matter damage in early multiple sclerosis. Eur J Neurol 2013;20:803–811. [DOI] [PubMed] [Google Scholar]
- 13.Jenkins TM, Ciccarelli O, Atzori M, et al. Early pericalcarine atrophy in acute optic neuritis is associated with conversion to multiple sclerosis. J Neurol Neurosurg Psychiatry 2011;82:1017–1021. [DOI] [PubMed] [Google Scholar]
- 14.Chu R, Hurwitz S, Tauhid S, Bakshi R. Automated segmentation of cerebral deep gray matter from MRI scans: effect of field strength on sensitivity and reliability. BMC Neurol 2017;17:172. [DOI] [PMC free article] [PubMed] [Google Scholar]
- 15.Reich DS, Smith SA, Gordon-Lipkin EM, et al. Damage to the optic radiation in multiple sclerosis is associated with retinal injury and visual disability. Arch Neurol 2009;66:998–1006. [DOI] [PMC free article] [PubMed] [Google Scholar]
- 16.Kuchling J, Brandt AU, Paul F, Scheel M. Diffusion tensor imaging for multilevel assessment of the visual pathway: possibilities for personalized outcome prediction in autoimmune disorders of the central nervous system. EPMA J 2017;8:279–294. [DOI] [PMC free article] [PubMed] [Google Scholar]
- 17.Alves C, Batista S, d'Almeida OC, et al. The retinal ganglion cell layer predicts normal-appearing white matter tract integrity in multiple sclerosis: a combined diffusion tensor imaging and optical coherence tomography approach. Hum Brain Mapp 2018;39:1712–1720. [DOI] [PMC free article] [PubMed] [Google Scholar]
- 18.Horbruegger M, Loewe K, Kaufmann J, et al. Anatomically constrained tractography facilitates biologically plausible fiber reconstruction of the optic radiation in multiple sclerosis. NeuroImage Clin 2019;22:101740. [DOI] [PMC free article] [PubMed] [Google Scholar]
- 19.Polman CH, Reingold SC, Banwell B, et al. Diagnostic criteria for multiple sclerosis: 2010 revisions to the McDonald criteria. Ann Neurol 2011;69:292–302. [DOI] [PMC free article] [PubMed] [Google Scholar]
- 20.Kurtzke JF. Rating neurologic impairment in multiple sclerosis: an expanded disability status scale (EDSS). Neurology 1983;33:1444–1452. [DOI] [PubMed] [Google Scholar]
- 21.American Clinical Neurophysiology Society. Guideline 5: guidelines for standard electrode position nomenclature. J Clin Neurophysiol 2006;23:107–110. [DOI] [PubMed] [Google Scholar]
- 22.Odom JV, Bach M, Brigell M, et al. ISCEV standard for clinical visual evoked potentials: (2016 update). Doc Ophthalmol 2016;133:1–9. [DOI] [PubMed] [Google Scholar]
- 23.Schippling S, Balk LJ, Costello F, et al. Quality control for retinal OCT in multiple sclerosis: validation of the OSCAR-IB criteria. Mult Scler 2015;21:163–170. [DOI] [PubMed] [Google Scholar]
- 24.Oberwahrenbrock T, Traber GL, Lukas S, et al. Multicenter reliability of semiautomatic retinal layer segmentation using OCT. Neurol Neuroimmunol Neuroinflamm 2018;5:e449 doi: 10.1212/NXI.0000000000000449. [DOI] [PMC free article] [PubMed] [Google Scholar]
- 25.Graham MS, Drobnjak I, Zhang H. Realistic simulation of artefacts in diffusion MRI for validating post-processing correction techniques. NeuroImage 2016;125:1079–1094. [DOI] [PubMed] [Google Scholar]
- 26.Smith SM, Jenkinson M, Woolrich MW, et al. Advances in functional and structural MR image analysis and implementation as FSL. NeuroImage 2004;23(suppl 1):S208–S219. [DOI] [PubMed] [Google Scholar]
- 27.Pierpaoli C, Basser PJ. Toward a quantitative assessment of diffusion anisotropy. Magn Reson Med 1996;36:893–906. [DOI] [PubMed] [Google Scholar]
- 28.Winklewski PJ, Sabisz A, Naumczyk P, Jodzio K, Szurowska E, Szarmach A. Understanding the physiopathology behind axial and radial diffusivity changes-what do we know? Front Neurol 2018;9:92. [DOI] [PMC free article] [PubMed] [Google Scholar]
- 29.Klistorner A, Vootakuru N, Wang C, et al. Decoding diffusivity in multiple sclerosis: analysis of optic radiation lesional and non-lesional white matter. PLoS One 2015;10:e0122114. [DOI] [PMC free article] [PubMed] [Google Scholar]
- 30.Schmidt P, Gaser C, Arsic M, et al. An automated tool for detection of FLAIR-hyperintense white-matter lesions in Multiple Sclerosis. NeuroImage 2012;59:3774–3783. [DOI] [PubMed] [Google Scholar]
- 31.Tournier JD, Calamante F, Connelly A. MRtrix: diffusion tractography in crossing fiber regions. Int J Imaging Syst Technol 2012;22:53–66. [Google Scholar]
- 32.Dhollander T, Raffelt D, Connelly A.. 2016. Unsupervised 3-tissue response function estimation from single-shell or multi-shell diffusion MR data without a co-registered T1 image: In ISSMRM Workshop on Breaking the Barriers of Diffusion MRI. 5 Available at: researchgate.net/publication/307863133_Unsupervised_3-tissue_response_function_estimation_from_single-shell_or_multi-shell_diffusion_MR_data_without_a_co-registered_T1_image. Accessed December 4, 2016. [Google Scholar]
- 33.Tournier JD, Calamante F, Gadian DG, Connelly A. Direct estimation of the fiber orientation density function from diffusion-weighted MRI data using spherical deconvolution. NeuroImage 2004;23:1176–1185. [DOI] [PubMed] [Google Scholar]
- 34.Ashburner J, Friston KJ. Unified segmentation. NeuroImage 2005;26:839–851. [DOI] [PubMed] [Google Scholar]
- 35.Pell GS, Briellmann RS, Chan CHP, Pardoe H, Abbott DF, Jackson GD. Selection of the control group for VBM analysis: influence of covariates, matching and sample size. NeuroImage 2008;41:1324–1335. [DOI] [PubMed] [Google Scholar]
- 36.Marcus DS, Wang TH, Parker J, Csernansky JG, Morris JC, Buckner RL. Open Access Series of Imaging Studies (OASIS): cross-sectional MRI data in young, middle aged, nondemented, and demented older adults. J Cogn Neurosci 2007;19:1498–1507. [DOI] [PubMed] [Google Scholar]
- 37.Schippling S, Ostwaldt AC, Suppa P, et al. Global and regional annual brain volume loss rates in physiological aging. J Neurol;2017;264:520–528. [DOI] [PubMed] [Google Scholar]
- 38.Fischl B, Dale AM. Measuring the thickness of the human cerebral cortex from magnetic resonance images. Proc Natl Acad Sci U S A 2000;97:11050–11055. [DOI] [PMC free article] [PubMed] [Google Scholar]
- 39.Zimmermann H, Freing A, Kaufhold F, et al. Optic neuritis interferes with optical coherence tomography and magnetic resonance imaging correlations. Mult Scler 2013;19:443–450. [DOI] [PubMed] [Google Scholar]
- 40.Saidha S, Sotirchos ES, Oh J, et al. Relationships between retinal axonal and neuronal measures and global central nervous system pathology in multiple sclerosis. JAMA Neurol 2013;70:34–43. [DOI] [PMC free article] [PubMed] [Google Scholar]
- 41.Petracca M, Cordano C, Cellerino M, et al. Retinal degeneration in primary-progressive multiple sclerosis: a role for cortical lesions? Mult Scler 2017;23:43–50. [DOI] [PubMed] [Google Scholar]
- 42.Papadopoulou A, Gaetano L, Pfister A, et al. Damage of the lateral geniculate nucleus in MS: assessing the missing node of the visual pathway. Neurology 2019;92:e2240–e2249. [DOI] [PMC free article] [PubMed] [Google Scholar]
- 43.Azevedo CJ, Cen SY, Khadka S, et al. Thalamic atrophy in multiple sclerosis: a magnetic resonance imaging marker of neurodegeneration throughout disease. Ann Neurol 2018;83:223–234. [DOI] [PMC free article] [PubMed] [Google Scholar]
- 44.Sepulcre J, Goñi J, Masdeu JC, et al. Contribution of white matter lesions to gray matter atrophy in multiple sclerosis: evidence from voxel-based analysis of T1 lesions in the visual pathway. Arch Neurol 2009;66:173–179. [DOI] [PubMed] [Google Scholar]
- 45.Balk LJ, Steenwijk MD, Tewarie P, et al. Bidirectional trans-synaptic axonal degeneration in the visual pathway in multiple sclerosis. J Neurol Neurosurg Psychiatry 2015;86:419–424. [DOI] [PubMed] [Google Scholar]
- 46.Audoin B, Fernando KTM, Swanton JK, Thompson AJ, Plant GT, Miller DH. Selective magnetization transfer ratio decrease in the visual cortex following optic neuritis. Brain 2006;129(pt 4):1031–1039. [DOI] [PubMed] [Google Scholar]
- 47.Sinnecker T, Oberwahrenbrock T, Metz I, et al. Optic radiation damage in multiple sclerosis is associated with visual dysfunction and retinal thinning--an ultrahigh-field MR pilot study. Eur Radiol 2015;25:122–131. [DOI] [PubMed] [Google Scholar]
- 48.Petzold A, de Boer JF, Schippling S, et al. Optical coherence tomography in multiple sclerosis: a systematic review and meta-analysis. Lancet Neurol 2010;9:921–932. [DOI] [PubMed] [Google Scholar]
- 49.Brusa A, Jones SJ, Plant GT. Long-term remyelination after optic neuritis: a 2-year visual evoked potential and psychophysical serial study. Brain 2001;124(pt 3):468–479. [DOI] [PubMed] [Google Scholar]
- 50.Manogaran P, Vavasour IM, Lange AP, et al. Quantifying visual pathway axonal and myelin loss in multiple sclerosis and neuromyelitis optica. Neuroimage Clin 2016;11:743–750. [DOI] [PMC free article] [PubMed] [Google Scholar]
Associated Data
This section collects any data citations, data availability statements, or supplementary materials included in this article.
Data Availability Statement
Any data not published within the article are available, and the anonymized data will be shared by request from any qualified investigator.


