Serial MRIs from 2 patients with relapsing-remitting MS displaying mild (video 1, baseline age: 42 years; disease duration: 1.2 years) and severe (video 2, baseline age: 43 years; disease duration: 1.6 years) brain atrophy with plots of brain parenchymal fraction (BPF),1 a measure of normalized brain volume, and Expanded Disability Status Scale (EDSS) are presented. Patients were scanned every 6–12 months over 14 years using standardized protocols on 3 scanners (Siemens Vision, Symphony, and Trio).2 BPF was calibrated across scanners using scan-rescan measurements. During the first year, the severe patient had 10 contrast-enhancing lesions, whereas the mild patient had none. BPF decreased by 2% (mild) compared with 10% (severe) over 14 years.
The videos show serial registered T2-FLAIR MRIs from 2 patients with MS scanned 19 times over 14 years, semiannually over the first 4 years, and annually thereafter. The videos illustrate development of mild (video 1) and severe (video 2) brain atrophy. The bottom figures show the Expanded Disability Status Scale (EDSS) score in blue (left vertical axis) and quantitative brain parenchymal fraction (BPF) in red (right vertical axis) with moving dots. In the severe case, new T2 lesions are visible early on while considerable brain atrophy continues around the expanding lateral ventricles and sulci throughout the time.Download Supplementary Video 1 (874.2KB, mp4) via Download Supplementary Video 2 (627KB, mp4)
The mild patient had 1 relapse and continued to ambulate independently. The patient was on IM interferon beta-1a from 1999 through 2011, azathioprine for a month in 2011 (Crohn disease), and methotrexate from 2011 through 2015 (Crohn disease). The severe case had 6 relapses between years 1 and 9; many new T2 lesions during years 1–7 including more than 40 contrast-enhancing lesions; moderate EDSS score until year 12, when motor function deteriorated. The patient was subsequently classified as secondary progressive. The severe patient was treated with interferon beta-1a, rituximab, and natalizumab. Thus, in the severe case, the clinical measures were relatively stable for many years while early MRI indications such as contrast-enhancing lesions, new T2 lesions, and brain volume loss predicted the eventual severe disease course.
These 2 cases demonstrate examples of mild and severe courses of MS, illustrating the relevance of MRI markers of tissue inflammation and destruction
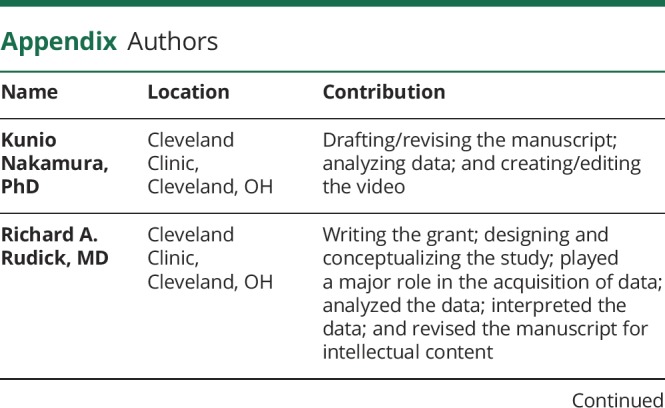
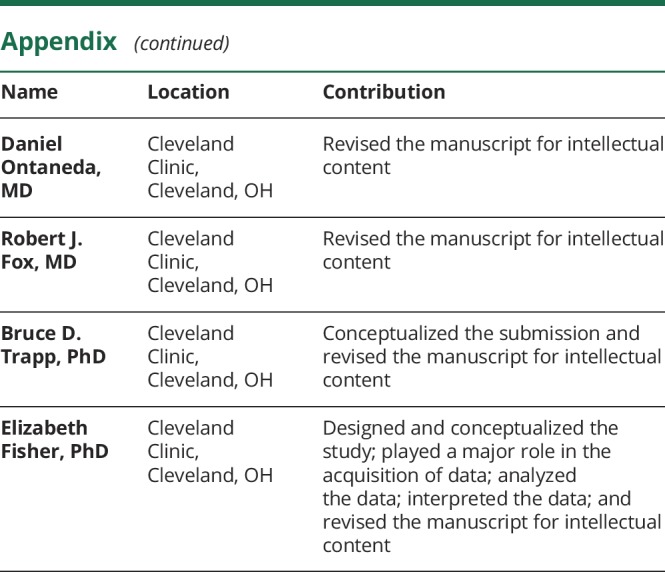
Appendix. Authors


Study funding
This study was funded by the NIH (P01NS38667 and R35NS09730) and the National Multiple Sclerosis Society (RG3099).
Disclosure
K. Nakamura has received personal fee from NeuroRx (consulting) and Sanofi Genzyme (speaking), license fees from Biogen on methods to measure gray matter volume and cortical thickness, and grant support from NIH, PCORI, DOD, NMSS, Biogen, Novartis, and Sanofi Genzyme. R.A. Rudick is an employee of Biogen, Inc. During the period of data collection related to this publication, Dr. Rudick was employed by the Cleveland Clinic Foundation and supported by NIH NINDS P01NS38667 and National Multiple Sclerosis Society RG3099. D. Ontaneda has received research support from the National Multiple Sclerosis Society, NIH, Patient-Centered Outcomes Research Institute, Race to Erase MS Foundation, Genentech, and Genzyme and has received consulting fees from Biogen Idec, Genentech/Roche, Genzyme, and Merck. R.J. Fox has received personal consulting fees from Actelion, Biogen, EMD Serono, Genentech, Novartis, and Teva; served on advisory committees for Actelion, Biogen, and Novartis; and received clinical trial contract and research grant funding from Biogen and Novartis. B.D. Trapp has received personal fees from Sanofi Genzyme, Genentech, Novartis, Renovo Neural Inc, Lundbeck Foundation, Biogen, and Disarm Therapeutics and grants from the National Multiple Sclerosis Society, NIH, State of Ohio, and ALS Association. E. Fisher is an employee of and owns stock in Biogen, Inc. During the period of data collection related to this publication, Dr. Fisher was employed by the Cleveland Clinic Foundation and supported by NIH P01NS38667 and National Multiple Sclerosis Society RG3099. Full disclosure form information provided by the authors is available with the full text of this article at Neurology.org/cp.
References
- 1.Rudick RA, Fisher E, Lee JC, Simon J, Jacobs L; Multiple Sclerosis Collaborative Research Group. Use of the brain parenchymal fraction to measure whole brain atrophy in relapsing-remitting MS. Neurology 1999;53:1698. [DOI] [PubMed] [Google Scholar]
- 2.Fisher E, Lee JC, Nakamura K, Rudick RA. Gray matter atrophy in multiple sclerosis: a longitudinal study. Ann Neurol 2008;64:255–265. [DOI] [PubMed] [Google Scholar]
Associated Data
This section collects any data citations, data availability statements, or supplementary materials included in this article.
Supplementary Materials
The videos show serial registered T2-FLAIR MRIs from 2 patients with MS scanned 19 times over 14 years, semiannually over the first 4 years, and annually thereafter. The videos illustrate development of mild (video 1) and severe (video 2) brain atrophy. The bottom figures show the Expanded Disability Status Scale (EDSS) score in blue (left vertical axis) and quantitative brain parenchymal fraction (BPF) in red (right vertical axis) with moving dots. In the severe case, new T2 lesions are visible early on while considerable brain atrophy continues around the expanding lateral ventricles and sulci throughout the time.Download Supplementary Video 1 (874.2KB, mp4) via Download Supplementary Video 2 (627KB, mp4)


