

Abstract
The cellular-level process of ion transport is known to generate a magnetic field. A noninvasive magnetoencephalography (MEG) technique was used to measure the magnetic field emanating from HeLa, HEK293, and H9c2(2-1) rat cardiac cells. The addition of a nonlethal dose of ionomycin to HeLa and capsaicin to TRPV1-expressing HEK293 cells resulted in a sudden change in the magnetic field signal consistent with Ca2+ influx, which was also observed by confocal fluorescence microscopy under the same conditions. In contrast, addition of capsaicin to TRPV1-expressing HEK293 cells containing an optimum amount of a TRPV1 antagonist (ruthenium red), resulted in no detectable magnetic or fluorescent signals. These signals confirmed that the measured MEG signals are due to cellular ion transport through the cell membrane. In general, there is evidence that ion channel/transporter activation and ionic flux are linked to cancer. Therefore, our work suggests that MEG could represent a noninvasive method for detecting cancer.
1. Introduction
At a global level, cancer therapeutics suffer from the lowest success rate compared to therapeutics for other major diseases. All indications suggest that cancer will soon be the leading cause of mortality in developed countries. The future of cancer research depends on the successful inter-dependencies between therapeutic, diagnostic, and prognostic technologies.1,2 The power of early detection in particular is key to successful therapeutic and prognostic outcomes, and noninvasive imaging techniques such as CT, MRI, and PET are proving to be extremely useful.1,3 A radically different approach to early-stage detection would focus on the development of noninvasive techniques to monitor the cellular-level process of ion transport through membranes and related membrane protein interactions as an indicator of cell health. The changes to membrane polarizations are measured by electrophysiology, fluorescent dyes, and proteins that respond to changes in voltage or specific charged analytes (e.g., Ca2+) in the cytoplasm. There is evidence that ion channel and transporter activation are linked to cancer.4−6 Dividing cells like HeLa cells have a lower membrane potential (−48 mV)7 than that of nondividing ones (e.g., neurons with −60 to −70 mV).8 Metastatic cancer cells are typically more depolarized than normal cells.9,10 Overexpression of potassium channels has been strongly associated with a number of cancer cell lines, and the phenomenon is generally accepted as fundamental to understanding cancer biology.4,11,12
From basic physics, it is known that an ion (i.e., a charge carrier) moving through an electric field will generate a current and a magnetic field. Naturally, it follows that ion flow through polarized cell membranes should result in a net magnetic field and magnetic sensors, in principle, have the potential to quantitatively measure them. Detectors of magnetic fields have been used to probe nerve impulses and ion transporters in cell and tissue culture.13−15 Wijesinghe described the results of their work with a specially designed neuromagnetic current probe to measure magnetic fields created by single axons and bundles.16 Precise high-resolution measurements of action potentials from individual neuronal activity have been made using a technique based on optically probed nitrogen vacancy (NV) quantum defects in diamond.17,18 This technique enabled long-term data collection without any bleaching effects at sub-millisecond resolution and is label-free. However, it did not have sufficient detection sensitivity for weak magnetic fields that are generated through cell membranes in broad classes of different cell types.
Magnetoencephalography (MEG) was one of the three early techniques that clearly established the existence of measurable magnetic fields due to ionic action currents in biological tissues.19−21 Due to significant advances in computational science, MEG has become a useful tool to study brain function, neuronal activities, and their associated magnetic fields. In the last several years, significant research activity in the MEG field has been able to firmly establish the quantitative causal relationship between magnetic signals and ionic currents in isolated nerve axons and muscle systems.13 A MEG instrument consists of an array of superconducting quantum interference device (SQUID) detectors.22,23 They can measure fields as small as a femtotesla in millisecond timeframes. Modern-day MEG systems consist of axial gradiometers that only measure a change in the magnetic field.
Taken together, these observations suggest that SQUID devices arrayed in a MEG instrument may have the potential to reveal fundamental information about cancer by noninvasively measuring the magnetic signature of the tissue.22,23 In this manuscript, we propose that the naturally emanating magnetic signals generated by ion flux in various cell types in culture can be quantitatively measured using the MEG system.
2. Results and Discussion
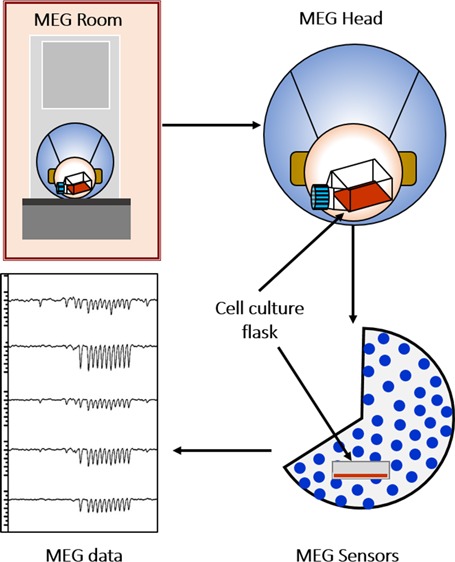
We adapted a MEG system originally designed for a human head and instead applied it to tissue culture. Data were collected on a 224-channel (sensors) MEG system (model PQ1128R, Figure 1a) with a headpiece designed to fit a human subject’s head (Figure 1b) containing an array of 208 SQUID sensors (Figure 1c) and three orthogonally oriented reference sensors located away from the headpiece. It is important to note that, at a given time, the MEG system consisting of axial gradiometers will only measure a change in a contiguous magnetic field that is perpendicular to the pickup coil. In other words, the MEG signals describe the temporal characteristic of ion transport through the channels due to opening and closing of the channels (i.e., the rise and fall rates) and could provide valuable information regarding channel-gating dynamics. A zero MEG signal might imply a constant, steady-state transmembrane ionic flux. Various parameters were examined, such as the cell type (HeLa, HEK 293, and H9c2(2-1)), number of cells (n = 1 × 10⁵, 5 × 10⁵, 1 × 10⁶, and 2 × 10⁶), flask sizes, shapes, and location and orientation within the MEG headpiece, to determine the best experimental protocol for our experiments. We decided to use T-25 flasks as a preferred choice and maintained all the geometrical parameters relative to the MEG headpiece constant. We also took a more constrained approach to only include signals equal to 750 fT or greater in magnitude.
Figure 1.

Concept diagram of the MEG system used in the study. (a) Sketch of the system with the MEG head where the sensor array is located. (b) Magnified sketch of the MEG head with the cavity where the cell culture flask is placed. (c) Actual schematic of the sensor array located within the MEG head.
2.1. Ionomycin-Induced Ca2+ Flux in HeLa Cells in Culture
2.1.1. Confocal Fluorescence Microscopy Studies
Ionomycin is a diacid polyether antibiotic that has a high affinity for Ca2+, which gives it ionophoric properties.24 Ionomycin stimulates the release of Ca2+ from internal stores and Ca2+ influx from the extracellular space through ion channels or both.25,26 The net effect is an increase in intracellular [Ca2+]. The smallest dose of ionomycin to give a Ca2+ signal from the Ca2+-sensitive fluorescence dye (Fluo-4) was determined by treating HeLa cells in culture with increasing ionomycin concentrations and observing the effects by confocal fluorescence microscopy (Figure 2a). Below 2 μM, ionomycin did not result in any noticeable fluorescence signal, but a maximal signal was observed at 2 μM, indicating Ca2+ influx into the cytosol. Exposure to high ionomycin concentrations caused extended cell death. We determined the optimum concentration of ionomycin and length of exposure to be 1, 2, and 5 μM and 5, 10, and 30 min, respectively. The extent of cell death was measured by trypan blue assay (Figure 2b). A 2 μM ionomycin concentration for an exposure of 5 min resulted in 10% cell death, and longer exposure times and higher concentrations led to greater cell death (Figure 2c,d).
Figure 2.

Effect of ionomycin addition on cytosolic Ca2+, cell death, and the MEG data. (a) Normalized fluorescent signal from Fluo-4 upon exposure to 0.5, 1.0, 1.5, and 2.0 μM ionomycin to establish the minimum ionomycin concentration to observe a response from the calcium indicator. (b) Percentage of cell death from 5, 10, and 30 min exposure to 1, 2, and 5 μM ionomycin observed in a trypan blue assay. Error bars represent the standard deviation of the measurement. (c, d) Confocal images of HeLa cells loaded with Fluo-4 (c) before and (d) after addition of ionomycin (2 μM). (e) MEG data for 1 × 10⁶ cells detected by channels 121, 127, 131, 137, and 142 when ionomycin (2 μM) is added to the flask as indicated by the dashed line.
2.1.2. MEG Studies
We repeated the same fluorescence microscopy experiment using a MEG instrument to measure the change in the magnetic field. The addition of 2 μM ionomycin to 1 × 10⁶ HeLa cells resulted in a change in the magnetic signal (Figure 2e and Figure S1). It took approximately 1–2 s to add all the ionomycin solution to the culture flask and record the time of completion. The red dotted line represents the end of ionomycin solution addition to the culture flask. Immediately afterward, a sudden, significant increase in the magnetic signal ( 50–75 pT) in several channels was observed over a period of 0.15 s, and the signal rapidly decayed thereafter. It is reasonable to assume that the processes related to the release of Ca2+ from internal stores and Ca2+ influx from the extracellular space through ion channels were triggered from the moment we started to add ionomycin to the culture flask. Since the MEG system only detects a change in the magnetic field and ionomycin-induced Ca2+ flux is irreversible, the rapid decay of the MEG signal after 0.15 s probably indicated the onset of a steady-state Ca2+ flux. During the signal oscillations, the intensities of the signals were attenuated, probably due to saturation of the sensors. Overlaid plots of the signals measured by channels 121,127, and 142 (Figure S2) show that the temporal response rates and curve shapes of the signals are identical; this confirms that the source of the signals is the same. The signal measured by channel 121 does not show any spikes, probably because the orientation of the spiked response is not perpendicular to the pickup coil of the sensor or perhaps because the sensor is located further away from the cells. For the control experiment, we repeated the above experiment but added the same volume of the culture media without any ionomycin to the flask. We found no detectable change in the magnetic signal (Figure S3).
2.2. Capsaicin-Induced Ca2+ Flux in TRPV1-Expressing HEK293 Cells in Culture
2.2.1. Confocal Fluorescence Microscopy Studies
A method to induce Ca2+ ion flux is to activate transient receptor potential cation channel subfamily V member 1 (TRPV1) on the surface of cells. The TRP family of ion channels is part of well-understood cellular sensors that regulate the response to temperature, touch, pain, and other stimuli.27,28 Activation of TRPV1 by either binding of a ligand such as capsaicin, a small molecule that is the active component in chili peppers and imparts a burning sensation by activating nociceptive sensory neurons; N-vanillyl-nonanoylamide (VNA), an equipotent capsaicin analog; or by exposure to noxious heat (>37 °C) results in nerve terminal depolarization and generation of action potentials.29 The responses observed by engineered and endogenously expressed TRPV1 channels to both applied capsaicin and exposure to heat are nearly identical,30 making activation of TRPV1 channels a versatile method for studying signal transduction activity of sensory neurons.
Using a confocal fluorescence microscope, we measured the influx of Ca2+ with the Ca2+ sensitive dye (Fluo-4) before and after the TRPV1-expressing HEK293 cells were exposed to the TRPV1 receptor agonist capsaicin (Figure 3a). Capsaicin dosage levels were optimized to achieve a maximum fluorescence signal with minimal toxicity (Figure S4-1). In these experiments, activation of TRPV1 channels depends on the diffusion of capsaicin to the cell receptors. Capsaicin (10 μM final concentration) was added to these cells, and the influx of Ca2+ was observed (Figure 3b and Figure S4-2). The cells responded with a significant increase in the fluorescence signal after the addition of capsaicin. The fluorescence signal in some cells decayed back to nearly starting levels, whereas in other cells, this signal decay was not observed. This is probably because there is ample capsaicin in the media to keep the ligand bound to the channels, which holds them open. In another series of experiments, we investigated the effect of the TRPV1 antagonist ruthenium red on capsaicin addition to TRPV1-expressing HEK293 cells. We added ruthenium red (10 μM final concentration) to the flask containing adherent HEK293 cells prior to the addition of capsaicin (Figure 3c). As expected, subsequent addition of capsaicin (10 μM final concentration) did not result in any detectable fluorescence signals (Figure 3d and Figure S4-3).
Figure 3.
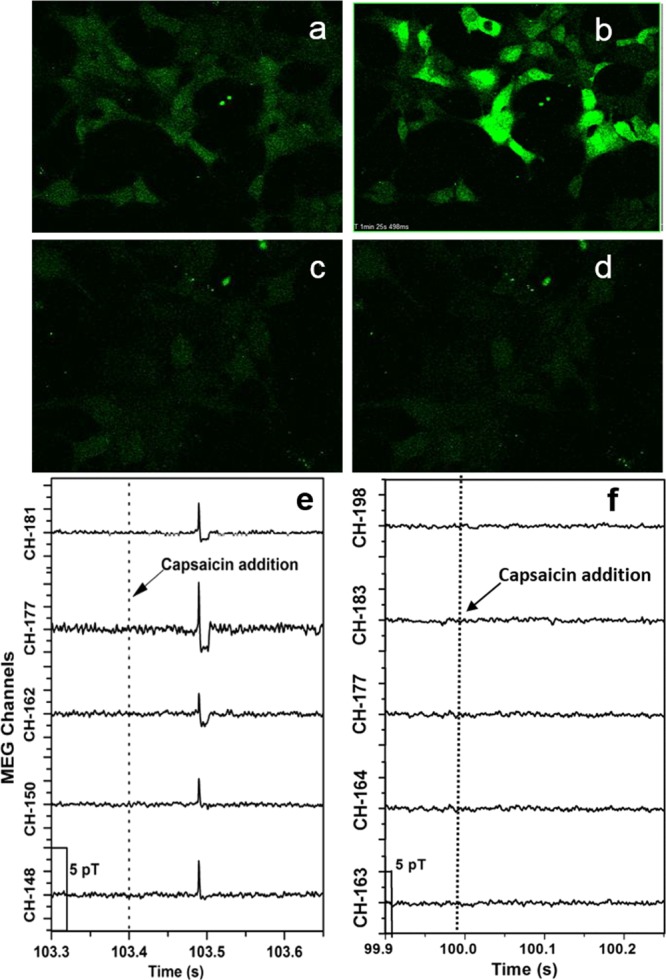
Effect of capsaicin addition on cytosolic Ca2+ on HEK293 cells stably transfected with TRPV1 with and without the TRPV1 antagonist ruthenium red using confocal florescence imaging and MEG: (a) images of HEK293 cells stably transfected with TRPV1 channels loaded with Fluo-4 before addition of capsaicin. (b) Images of HEK293 cells stably transfected with TRPV1 channels loaded with Fluo-4 after addition of capsaicin (10 μM). (c) Images of HEK293 cells stably transfected with TRPV1 channels containing the TRPV1 antagonist ruthenium red, (10 μM) loaded with Fluo-4 before addition of capsaicin (10 μM). (d) Images of HEK293 cells stably transfected with TRPV1 channels, containing ruthenium red (10 μM) loaded with Fluo-4 after addition of capsaicin (10 μM). (e) MEG data for 0.05 × 10⁶ HEK293 cells stably transfected with TRPV1 channels detected by channels 148, 150, 162, 177, and 181 when capsaicin in the culture media (10 μM final concentration) was added to the flask at the time point marked by the dotted line. (f) MEG data for 0.05 × 10⁶ HEK293 cells stably transfected with TRPV1 channels, containing ruthenium red (10 μm), detected by channels 163, 164, 177, 183, and 198 when capsaicin in the culture media (10 μM final concentration) was added to the flask at the time point marked by the dotted line.
2.2.2. MEG Studies
MEG experiments with TRPV1-expressing HEK293 cells were carried out in a similar manner to the fluorescence microscopy experiments. We added capsaicin (10 μM final concentration) to HEK293 cells in culture and observed a significant spike in the magnetic signal in several channels (Figure 3e). The black dotted lines in Figure 3e represent the approximate time of completion of the capsaicin solution addition to the culture flask. The signals decayed to the baseline in a way similar to the experiments with ionomycin addition. The intensity of the spike in the magnetic signal due to capsaicin (3–5 pT) was much less than that observed in the ionomycin experiments (50–75 pT), and the much shorter duration of the spike was probably due to the magnetic signal strength falling below our threshold of 0.75 pT. Overlaid plots of these signals (Figure S6) confirmed that the signals measured by these channels originated from a single source. Plotting the dependence of the measured magnetic field as a function of [capsaicin] (Figure S7) revealed that increasing [capsaicin] from 0 to 10 μM resulted in a proportional increase in [Ca2+], which reached a steady-state value. Overall, it is clear that an increase in [capsaicin] and hence an increase in [Ca2+] resulted in an increase in the magnetic field. The effect of the addition of capsaicin to adherent TRPV1-expressing HEK293 cells detected by an immediate spike in the magnetic signal has been repeated several times for different concentrations. These results strongly support our hypothesis that the measured magnetic signals correspond to cellular ionic flux. In control experiments, when only the culture media was added to the cells, we detected no increase in the magnetic signal (Figure S8). We also investigated the effect of TRPV1 antagonist (ruthenium red) on capsaicin addition to TRPV1-expressing HEK293 cells in culture. Ruthenium red (10 μM final concentration) was added to the flask containing the adherent HEK293 cells in culture prior to the addition of capsaicin. No detectable magnetic signals were observed after capsaicin (10 μM final concentration) addition (Figure 3f). The experiment was repeated several times during the same day and on different days. The results are consistent with the fluorescence experiments, demonstrating that the magnetic signals measured by the MEG system are strongly correlated to the cellular ionic flux. We would like to note that, while we are monitoring the [Ca2+] activity, a major contributor to the ionic flux through these channels would be [Na+].
2.3. Effect of Multiple Additions of Capsaicin
2.3.1. Confocal Fluorescence Microscopy Studies
We further examined the stability of the adsorbed capsaicin on the cell membrane by making multiple additions of capsaicin to the same cells and observing the effect with confocal microscopy (Figure S9). Whereas the first addition of capsaicin (10 μM final concentration) resulted in a spike in the fluorescence intensity, the second addition did not result in any detectable response. This observation likely results from saturation of the TRPV1 receptors with capsaicin, which has an EC50 of approximately 300 nM.31
2.3.2. MEG Studies
MEG experimental results were also found to be consistent with fluorescence experiments when capsaicin was added at 100 and 725 s (Figure S10) to the same cell population. That is, whereas the first addition of capsaicin (10 μM final concentration) resulted in a spike in the magnetic signal, the second addition of the same concentration did not result in any detectable response. Similar observations were made when the experiments were repeated with different waiting periods of up to 10 min between the two capsaicin additions.
In a second set of experiments, we examined the effect of replacing the culture before the second addition by washing the cells with fresh culture three times (Figure S11). Once again, the first addition of capsaicin resulted in a magnetic signal, but no detectable magnetic response was observed after the second addition (Figure S12), probably because the TRPV1 channels were saturated with the agonist. Any subsequent addition of capsaicin would therefore have no significant effect on Ca2+ flux through the channels. The results support the hypothesis in that the measured magnetic signals are due to the cellular ionic flux.
2.4. Magnetic Field Measurements from Cells in Culture
2.4.1. HeLa Cells
MEG data from channels 3, 21, 35, 45, and 175 for 1 × 10⁶ HeLa cells in culture at 80% confluency reveal a cluster of signals, approximately 1–3 pT in intensity (Figure 4a and Figure S13). Overlaid plots of signals from three channels (3, 21, and 45) for a period of 0.1 s (Figure S14) indicate that the temporal response rates and curve shapes of these signals are identical with respect to each other, implying that all the channel signals originate from the same source. We therefore hypothesize that these weak signals are due to the normal transmembrane ionic flux and each signal wavelength (FWHM) corresponds to the rise and fall rates of ion flux during channel opening and closing. Fast Fourier transform (FFT) of the data from channel 175 revealed a high level of periodicity in these signals with a characteristic frequency of 27.8 Hz (36 × 10–3 s) (Figure S15). If we assume that each adjacent signal corresponds to an open and closed state, our data would imply that, at any given time, HeLa ion channels either stay opened and closed for a duration of 36 × 10–3 s.
Figure 4.

MEG detection of magnetic fields from HeLa cells in culture. (a) Typical data for 1 × 10⁶ cells detected by channels 3, 21, 35, 45, and 175. (b) MEG data from a flask containing only culture but no cells.
Two series of control experiments were carried out to establish the system noise floor. In the first experiment, we measured the magnetic field from a flask containing only culture but no cells (Figure 4b and Figure S16). No detectable signals were observed. In the second experiment, we measured magnetic fields from HeLa cells dispersed in culture (Figure S17). Once again, we did not measure any detectable magnetic signals. This is consistent with our expectation in that, in the case of cell dispersions in the culture, there would be no net magnetic field due to symmetry considerations. This control experiment also eliminates any concern of signal contribution/contamination from any unknown “cell-related debris” in the culture.
2.4.2. Nondifferentiated H9c2(2-1) Rat Cardiac Myoblasts versus Differentiated Myocytes
The morphology of H9c2(2-1) cells were characterized before and after differentiation32 (Figure S18). MEG signals from H9c2(2-1) rat cardiac myoblasts and differentiated myocytes were measured in a manner similar to that of the HeLa cells (Figure S19). Magnetic signals emanating from nondifferentiated cells (Figure S19a) were similar to those of the HeLa cells, whereas differentiated cells exhibited clusters of signals (Figure S19b,c). FFT of the data showed a high degree of periodicity for both cell lines (Figure S19d–f). Nondifferentiated cell lines had a characteristic magnetic signature of 27.8 Hz, similar to that of the HeLa cells. In general, the differentiated cell lines consistently showed a cluster of higher-frequency signals with a characteristic frequency of around 220 Hz (4.54 × 10⁻³ s). If we assume that our earlier hypothesis for the HeLa cells is applicable to other cell types, then we would conclude that the ion channels in the nondifferentiated cell lines exhibited similar behavior and stay opened or closed for the same duration of time of 36 × 10–3 s. The differentiated cell lines, however, stayed open or closed for a much shorter duration of time, namely, 4.54 × 10⁻³ s. The delineation of different frequencies within the cluster of signals in the differentiated cell lines is likely due to different specific ion channels.
3. Conclusions
We report a noninvasive method to measure the net ionic transport through an electric field at a polarized membrane using the MEG system. Addition of a nonlethal dose of ionomycin to HeLa cells or capsaicin to TRPV1-expressing HEK293 cells resulted in a sudden change in the magnetic signal, which was consistent with confocal fluorescence experiments. Our experimental results with the TRPV1 antagonist ruthenium red, which blocks the TRPV1 ion channels, showed that the magnetic signals detected by the MEG system are strongly correlated with the cellular ionic flux. It is interesting to observe that the nondifferentiated H9c2(2-1) rat cardiac myoblasts and the differentiated myocytes showed a significant difference in their magnetic signatures. The characteristic frequency of 27.8 Hz for the myoblasts was found to be identical to that of HeLa cells, which is a cancer cell line. The differentiated cell lines showed a cluster of higher characteristic frequencies of around 220 Hz. It is speculated that each of the three frequencies in the cluster is attributable to a specific ionic flux. One could then infer that the ion channel-gating dynamics of nondifferentiated cell lines are nondistinct, which is a key factor affecting cellular homeostasis. Detailed investigations are still needed to correlate the magnetic signals to a flux of specific ions, such as Na+, K+, and Ca2+. This would further enable correlations to specific biological processes related to the cell state, type, and differentiation stage. The resulting insights into the cellular processes at the membranes would potentially lead to a noninvasive method for early-stage cancer detection.
4. Experimental Section
4.1. Cell Culture
HeLa cells were cultured in RPMI 1640 media with 10% FBS and 1% penicillin/streptomycin in cell-culture flasks at 37 °C and 5% CO2. HEK293 cells stably expressing TRPV1 were created by transfection with a pCMV6-NEO-TRPV1 plasmid (Origene) using a TrueFect reagent (United BioSystems) and G418 (600 μg/mL) for selection. The cells were cultured in DMEM with 10% FBS and 1% PEN-STREP. The antibiotic G418 (300 μg/mL) was used for maintaining the stable expression of TRPV1. TRPV1 expression was verified by western blot and immunofluorescence staining using a TRPV1 antibody33 (Figure S5). H9c2(2-1) (ATCC CRL1446) cells were cultured in RPMI 1640 with 10% FBS and 1% penicillin/streptomycin in cell-culture flasks at 37 °C and 5% CO2 at no greater than 50% confluence. To initiate differentiation, cells were allowed to grow to confluency and maintained in 2% FBS supplemented media for four days.32
4.2. Calcium Dye Loading
Calcium dye (50 μg, Fluo-4 AM, Life Technologies) was dissolved in DMSO (50 μL). Both Fluo-4 AM and Pluronic F-127 (Molecular Probes) were added to HBSS resulting in a 0.002% final concentration of each. The mixture was sonicated for 5 min, loaded onto cells growing in a 35 mm glass bottom dish, and then de-esterified for 30 min in a humidified CO2 incubator (37 °C, 5% CO2).
4.3. Confocal Microscopy
Live cell imaging was carried out on an Olympus FluoView FV1000MPE confocal microscope. Excitation using an argon ion laser was set at 488 nm and emitted light was reflected through a 500–600 nm filter from a dichroic mirror. Data capture and extraction was carried out with FluoView 10-ASW version 4.0 (Olympus), Image J-Fiji,34 and DeltaGraph (Red Rock Software). Stock solutions of ionomycin and capsaicin were prepared in DMSO, and DMSO accounted for no more than 0.2% of the final concentration of these reagents. To initiate the experiments, ionomycin (2 μM final concentration) or capsaicin (10 μM final concentration) was added to the culture dish from a pipette.
4.4. Evaluation of Ionomycin-Dependent Cell Death
HeLa cells grown in culture were treated with ionomycin solutions (1, 2, and 5 μM final concentrations) for a period of 5, 10, or 30 min. After the designated time period, the cell suspension was treated with trypan blue (final concentration of 0.4%) and immediately loaded into a hemocytometer. Dead cells are stained blue, and live cells are unstained. The cells were counted manually using a handheld tally counter.
4.5. Evaluation of Capsaicin-Dependent Cell Death
HEK293 cells stably expressing TRPV1 grown in culture were treated with DMSO (0.2%) or capsaicin solutions (1.25, 2.5, 5, and 10 μM final concentrations) for a period of 30 min. After the designated time period, the cell suspension was treated with CellTiter Blue (Promega), and the fluorescence was measured after 1.5 h using 560/590 nm filters on a BioTek Synergy microplate reader and compared to an untreated control.
4.6. MEG Data Acquisition and Analysis
A T-25 culture flask containing plated HeLa/HEK293, or H9c2(2-1) cells was placed inside the MEG chamber in a pre-determined position on the base of the helmet. MEG data was collected in the continuous mode with a 208-channel axial gradiometer system (Kanazawa Institute of Technology, Kanazawa, Japan) using MEG 160 software for data collection and post-processing. This MEG software is produced jointly by Yokogawa Electric Corp., Eagle Technology Corp., and the Kanazawa Institute of Technology (KIT). A low pass of 200 Hz, high pass of 0.1 Hz, and sampling rate of 3000 Hz for data recording were used. Data from the MEG system was acquired by a DAQ system assembled by Eagle Technology. For MEG data post-processing, offline noise reduction with a specifically designed algorithm, that is, the continuously adjusted least-squares method (CALM), using three reference magnetometers mounted outside the MEG head was used.35 The CALM noise reduction method eliminates any detected covariance between the measured data in the MEG sensors with respect to the reference sensors. This technique was specifically designed to eliminate low-frequency (<10 Hz) noise as well as large extramural unintentional magnetic noise to disrupt MEG sensors. The selected data plotting and analysis was done using Origin Pro 2016 software.
4.7. MEG Experiments for Remote Addition of Ionomycin and Capsaicin
The experimental set up was designed such that we could add the optimum dosage of ionomycin or capsaicin dissolved in culture to the culture flask remotely. We used a fine plastic tubing, one end of it being attached to the end cap of the culture flask. The other end of the tubing located outside the MEG room was attached to a plastic bulb, which contained the ionomycin or the capsaicin solution. This arrangement enabled undisturbed measurement of the baseline signal from the cells in the flask and after the addition of ionomycin or capsaicin by applying pressure to the liquid inside the tubing through a plastic bulb attached to the other end located outside the MEG room. The complete addition of ionomycin or capsaicin took approximately 1–2 s.
4.7.1. Noise Floor Characterization
-
(1)
During the first phase of our experiments, we carried out a detailed study of the noise floor of the MEG system and the contiguous environment. We worked closely with other active NYUAD faculty from the neurobiology department who relied on the MEG system for their core research and the representatives of the company that built the MEG system. The purpose of these conversations was to be educated and trained on the capabilities/limits of the MEG system and adapt the experimental protocols associated with “good” data acquisition practices, identifying potential sources of noise that are specific to the MEG system and their characteristic signatures. Overall, the MEG system was set up such that the noise floor is comparable to MEG systems in other global research facilities.
-
(2)
Our standard experimental procedure involved the following: all (reference) control experiments for a specific set of studies and general background noise measurements were repeated during each experimental session. We measured the noise floor before and after each experiment and many times between experiments as well. For (reference) control experiments, we did a minimum of two repeats and sometimes up to four repeats in each session.
-
(3)
As described in the manuscript, we only considered signals above a significant threshold that were repeatable within each experimental session and in other experiments carried out on different days.
-
(4)
For each experimental set, we usually measured signals from three to four cell cultures per session and collected two to five sets of data for each cell culture.
4.8. Reference Controls
-
(1)
Neat cell cultures: As described in the manuscript, the control experiments for the “neat” adherent cell culture measurements involved the cell-culture flask prepared in the same manner as with the adherent cells but without the cells. The data acquisition procedure was identical to that with the cells.
-
(2)
Ionomycin experiments: For the ionomycin experiment, the control experiment involved a procedure that was identical to that of the main experiment in which ionomycin in culture media (2 μM final concentration) was added to the cells using plastic tubing and pneumatic pressure, except that no ionomycin was present in the culture for the control experiment. This was repeated during the experimental session on the same day, and all the experiments were repeated again several times on different days.
-
(3)
Capsaicin experiments: For the capsaicin experiment, the control experiment involved a procedure that was identical to that of the main experiment in which 10 μM capsaicin in culture media was added to the adherent HEK cells using a plastic tubing and pneumatic pressure, except that no capsaicin was present in the culture media for the control experiment. This was repeated during the experimental session on the same day, and all the experiments were repeated again several times on different days.
-
(4)
Signal processing and statistical analysis: We did extensive statistical analysis of the data for nondifferentiated cells. The time domain magnetic signals from select channels were transformed into the frequency domain using the FFT algorithm in MatLab and Origin Pro 2016. FFT results obtained from nine individual sensors per experiment were selected for statistical testing. We calculated the standard error of the mean (SEM) for an average of five independent experiments using Prism 6.0 software (GraphPad Software, Inc. La Jolla, CA, U.S.A.). Statistical significance between or among experiments was assessed by one-way analysis of variance (ANOVA) followed by Tukey’s or Dunnett’s post hoc test. A value of p < 0.0001 was considered to be statistically significant in our experiments.
-
(5)
Data Availability: All data generated or analyzed during this study are included in this published article and in the Supporting Information.
Acknowledgments
We acknowledge the valuable support provided by the MEG Lab group and the Core Technology Platforms at NYU Abu Dhabi for the use of the instruments and discussion. We thank Prof. Kartik Sreenivasan at NYU Abu Dhabi and Dr. Daisuke Oyama at the Kanazawa Institute of Technology for their valuable insights in the analysis of the MEG data, Dr. Amitabha Mazumder (previously at the NYU Langone Medical School) and Prof. George Shubeita and Prof. Dipesh Chaudhury at NYU Abu Dhabi for their support and discussion, Dr. Xi Wei for help with the early experiments, and Mr. Graham Flick for discussion about MEG data analysis.
Supporting Information Available
The Supporting Information is available free of charge at https://pubs.acs.org/doi/10.1021/acsomega.9b03589.
Figure S1: screenshot of noise-reduced data shown in Figure 2e; Figure S2: overlaid plots of data shown in Figure 2e; Figure S3: impact of adding culture media remotely to the cell flask for the data shown in Figure 2e; Figure S4: cell viability results as a function of the dosage level of capsaicin, effect of the addition of capsaicin (10 μM final concentration) at time t = 30 s to HEK293 cells expressing TRPV1 channels, and effect of the addition of capsaicin (10 μM final concentration) at time t = 24 s to HEK293 cells expressing TRPV1 channels with pre-added TRPV1 antagonist (10 μM ruthenium red); Figure S5: verification of TRPV1 (MW = 93–95 kDa) expression in stably transfected HEK 293 cells; Figure S6: overlaid plots of data shown in Figure 3e; Figure S7: effect of increasing capsaicin concentration on the measured magnetic field from TRPV1-expressing HEK293 cells; Figure S8: addition of culture media without capsaicin remotely to the cell flask for the data shown in Figure 3e; Figure S9: confocal fluorescence experimental data on the effect of multiple additions of capsaicin to the same TRPV1-expressing HEK293 cells; Figure S10: MEG noise-reduced data on the effect of multiple additions of capsaicin to the same HEK293 cells expressing TRPV1channels; Figure S11: confocal fluorescence experimental data on the effect of replacing the culture media before the second capsaicin addition by washing the with fresh culture media three times; Figure S12: MEG data on the effect of replacing the culture media before the second capsaicin addition by washing the TRPV1-expressing HEK293 cells with fresh culture media three times; Figure S13: screenshot of MEG noise-reduced data shown in Figure 4a; Figure S14: overlaid plots of data shown in Figure 4a; Figure S15: FFT of the data of channel 175 shown in Figure 4a; Figure S16: screenshot of the MEG noise-reduced signals from the control experiment data shown in Figure 4b; Figure S17: magnetic fields from HeLa cells dispersed in culture; Figure S18: morphological characterization of H9c2(2-1) cells before and after differentiation; and Figure S19: comparison of the magnetic signals from nondifferentiated and differentiated cardiac cells (PDF)
Author Contributions
S.K.S. and S.V. contributed equally to this work. R.J. developed the concept of measurable magnetic fields emanating from cellular ionic transport using MEG and the potential distinction in magnetic signatures between normal and cancer cells. T.M.D. designed and interpreted the microscopy experiments. R.J. and S.K.S. designed the MEG experiments, and S.K.S. conducted the MEG experiments. R.J. and S.K.S. carried out the MEG data processing and analysis. S.V. and S.G. grew and maintained the cell cultures, advised on microscopy experimental design, carried out the microscopy experiments, analyzed microscopy data, and prepared cell cultures for the MEG experiments. R.J. and T.M.D. wrote the manuscript.
Funding for this work was provided by NYU Abu Dhabi.
The authors declare no competing financial interest.
Supplementary Material
References
- Garzon R.; Marcucci G.; Croce C. M. Targeting MicroRNAs in Cancer: Rationale, Strategies and Challenges. Nat. Rev. Drug Discovery 2010, 9, 775–789. 10.1038/nrd3179. [DOI] [PMC free article] [PubMed] [Google Scholar]
- Kalinich M.; Haber D. A. Cancer Detection: Seeking Signals in Blood. Science 2018, 359, 866–867. 10.1126/science.aas9102. [DOI] [PMC free article] [PubMed] [Google Scholar]
- Frangioni J. V. New Technologies for Human Cancer Imaging. J. Clin. Oncol. 2008, 26, 4012–4021. 10.1200/JCO.2007.14.3065. [DOI] [PMC free article] [PubMed] [Google Scholar]
- Schmick M.; Vartak N.; Papke B.; Kovacevic M.; Truxius D. C.; Rossmannek L.; Bastiaens P. I. H. KRas Localizes to the Plasma Membrane by Spatial Cycles of Solubilization, Trapping and Vesicular Transport. Cell 2014, 157, 459–471. 10.1016/j.cell.2014.02.051. [DOI] [PubMed] [Google Scholar]
- Prevarskaya N.; Skryma R.; Shuba Y. Ion Channels and the Hallmarks of Cancer. Trends Mol. Med. 2010, 16, 107–121. 10.1016/j.molmed.2010.01.005. [DOI] [PubMed] [Google Scholar]
- Kunzelmann K. Ion Channels and Cancer. J. Membr. Biol. 2005, 205, 159–173. 10.1007/s00232-005-0781-4. [DOI] [PubMed] [Google Scholar]
- Okada Y.; Ogawa M.; Aoki N.; Izutsu K. The Effect of K+ on The Membrane Potential in HeLa Cells. Biochim. Biophys. Acta 1973, 291, 116–126. 10.1016/0005-2736(73)90066-7. [DOI] [PubMed] [Google Scholar]
- Brackenbury W. J. Voltage-Gated Sodium Channels and Metastatic Disease. Channels 2012, 6, 352–361. 10.4161/chan.21910. [DOI] [PMC free article] [PubMed] [Google Scholar]
- Stillwell E. F.; Cone C. M.; Code C. D. Stimultation of DNA Synthesis in CNS Neurones by Sustained Depolarisation. Nature New Biol. 1973, 246, 110–111. 10.1038/246421a0. [DOI] [PubMed] [Google Scholar]
- Wright S. H. Generation of Resting Membrane Potential. Adv. Physiol. Educ. 2004, 28, 139–142. 10.1152/advan.00029.2004. [DOI] [PubMed] [Google Scholar]
- Pardo L. A.; del Camino D.; Sánchez A.; Alves F.; Brüggemann A.; Beckh S.; Stühmer W. Oncogenic Potential of EAG K+ Channels. EMBO J. 1999, 18, 5540–5547. 10.1093/emboj/18.20.5540. [DOI] [PMC free article] [PubMed] [Google Scholar]
- de Queiroz F. M.; Suarez-Kurtz G.; Stühmer W.; Pardo L. A. Ether á Go-Go Potassium Channel Expression in Soft Tissue Sarcoma Patients. Mol. Cancer 2006, 5, 42. 10.1186/1476-4598-5-42. [DOI] [PMC free article] [PubMed] [Google Scholar]
- Wikswo J.; Barach J.; Freeman J. Magnetic Field of a Nerve Impulse: First Measurements. Science 1980, 208, 53–55. 10.1126/science.7361105. [DOI] [PubMed] [Google Scholar]
- Wijesinghe R. S. Magnetic Measurements of Peripheral Nerve Function Using a Neuromagnetic Current Probe. Exp. Biol. Med. 2010, 235, 159–169. 10.1258/ebm.2009.009306. [DOI] [PubMed] [Google Scholar]
- Le Sage D.; Arai K.; Glenn D. R.; Devience S. J.; Pham L. M.; Rahn-Lee L.; Lukin M. D.; Yacoby A.; Komeili A.; Walsworth R. L. Optical Magnetic Imaging of Living Cells. Nature 2013, 496, 486–489. 10.1038/nature12072. [DOI] [PMC free article] [PubMed] [Google Scholar]
- Wijesinghe R. S. Detection of Magnetic Fields Created by Biological Tissues. J. Electr. Electron. Syst. 2014, 03, 1. 10.4172/2332-0796.1000120. [DOI] [Google Scholar]
- Barry F. J.; Turner M. J.; Schloss J. M.; Glenn D. R.; Song Y.; Lukin M. D.; Park H.; Barry J. F.; Turner M. J.; Schloss J. M.; et al. Optical Magnetic Detection of Single-Neuron Action Potentials Using Quantum Defects in Diamond. Proc. Natl. Acad. Sci. 2016, 114, 14133–14138. 10.1073/pnas.1712523114. [DOI] [PMC free article] [PubMed] [Google Scholar]
- Hall L. T.; Hill C. D.; Cole J. H.; Stadler B.; Caruso F.; Mulvaney P.; Wrachtrup J.; Hollenberg L. C. L. Monitoring Ion Channel Function In Real Time Through Quantum Decoherence. Proc. Natl. Acad. Sci. 2010, 107, 18777–18782. 10.1073/pnas.1002562107. [DOI] [PMC free article] [PubMed] [Google Scholar]
- Cohen D. Magnetoencephalography: Detection of the Brain’s Electrical Activity with a Superconducting Magnetometer. Science 1972, 175, 664–666. 10.1126/science.175.4022.664. [DOI] [PubMed] [Google Scholar]
- Baule G.; Mcfee R.; Ph D. Detection of the Magnetic of the Heart. Heart 1962, 95–96. [DOI] [PubMed] [Google Scholar]
- Cohen D.; Givler E. Magnetomyography: Magnetic Fields around the Human Body Produced by Skeletal Muscles. Appl. Phys. Lett. 1972, 21, 114–116. 10.1063/1.1654294. [DOI] [Google Scholar]
- Baillet S. Magnetoencephalography for Brain Electrophysiology and Imaging. Nat. Neurosci. 2017, 20, 327–339. 10.1038/nn.4504. [DOI] [PubMed] [Google Scholar]
- Hämäläinen M.; Hari R.; Ilmoniemi R. J.; Knuutila J.; Lounasmaa O. V. Magnetoencephalography Theory, Instrumentation, and Applications to Noninvasive Studies of the Working Human Brain. Rev. Mod. Phys. 1993, 65, 413–497. 10.1103/RevModPhys.65.413. [DOI] [Google Scholar]
- Toeplitz B. K.; Cohen A. I.; Funke P. T.; Parker W. L.; Gougoutas J. Z. Structure of Ionomycin—A Novel Diacidic Polyether Antibiotic Having High Affinity for Calcium Ions. J. Am. Chem. Soc. 1979, 101, 3344–3353. 10.1021/ja00506a035. [DOI] [Google Scholar]
- Morgan A. J.; Jacob R. Ionomycin Enhances Ca 2+ Influx by Stimulating Store-Regulated Cation Entry and Not by a Direct Action at the Plasma Membrane. Biochem. J. 1994, 300, 665–672. 10.1042/bj3000665. [DOI] [PMC free article] [PubMed] [Google Scholar]
- Dedkova E. N.; Sigova A. A.; Zinchenko V. P. Mechanism of Action of Calcium Ionophores on Intact Cells: Ionophore-Resistant Cells. Membr. Cell Biol. 2000, 13, 357–368. [PubMed] [Google Scholar]
- Clapham D. E.; Runnels L. W.; Strübing C. The TRP Ion Channel Family. Nat. Rev. Neurosci. 2001, 2, 387–396. 10.1038/35077544. [DOI] [PubMed] [Google Scholar]
- Clapham D. E. TRP Channels as Cellular Sensors. Nature 2003, 426, 517–524. 10.1038/nature02196. [DOI] [PubMed] [Google Scholar]
- Caterina M. J.; Schumacher M. A.; Tominaga M.; Rosen T. A.; Levine J. D.; Julius D. The Capsaicin Receptor: A Heat-Activated Ion Channel in the Pain Pathway. Nature 1997, 389, 816–824. 10.1038/39807. [DOI] [PubMed] [Google Scholar]
- Kárai L. J.; Russell J. T.; Iadarola M. J.; Oláh Z. Vanilloid Receptor 1 Regulates Multiple Calcium Compartments and Contributes to Ca2+-Induced Ca2+ Release in Sensory Neurons. J. Biol. Chem. 2004, 279, 16377–16387. 10.1074/jbc.M310891200. [DOI] [PubMed] [Google Scholar]
- Walpole C.S.J.; Wrigglesworth R.. Structural Requirements for Capsaicin Agonists and Antagonists. In Capsaicin in the Study of Pain; Wood J. N., Ed.; Academic Press Limted: London, 1993; pp 63–81. [Google Scholar]
- Branco A. F.; Pereira S. P.; Gonzalez S.; Gusev O.; Rizvanov A. A.; Oliveira P. J. Gene Expression Profiling of H9c2 Myoblast Differentiation towards a Cardiac-Like Phenotype. PLoS One 2015, 10, e0129303 10.1371/journal.pone.0129303. [DOI] [PMC free article] [PubMed] [Google Scholar]
- Karai L.; Brown D. C.; Mannes A. J.; Connelly S. T.; Brown J.; Gandal M.; Wellisch O. M.; Neubert J. K.; Olah Z.; Iadarola M. J. Deletion of Vanilloid Receptor 1-Expressing Primary Afferent Neurons for Pain Control. J. Clin. Invest. 2004, 113, 1344–1352. 10.1172/JCI20449. [DOI] [PMC free article] [PubMed] [Google Scholar]
- Schindelin J.; Arganda-Carreras I.; Frise E.; Kaynig V.; Longair M.; Pietzsch T.; Preibisch S.; Rueden C.; Saalfeld S.; Schmid B.; Tinevez J.-Y.; et al. Fiji - an Open Source Platform for Biological Image Analysis. Nat. Methods 2009, 9, 676–682. 10.1038/nmeth.2019.Fiji. [DOI] [PMC free article] [PubMed] [Google Scholar]
- Adachi Y.; Shimogawara M.; Higuchi M.; Haruta Y.; Ochiai M. Reduction of Non-Periodic Environmental Magnetic Noise in MEG Measurement by Continuously Adjusted Least Squares Method. IEEE Trans. Appl. Supercond. 2001, 11, 669–672. 10.1109/77.919433. [DOI] [Google Scholar]
Associated Data
This section collects any data citations, data availability statements, or supplementary materials included in this article.