

Abstract
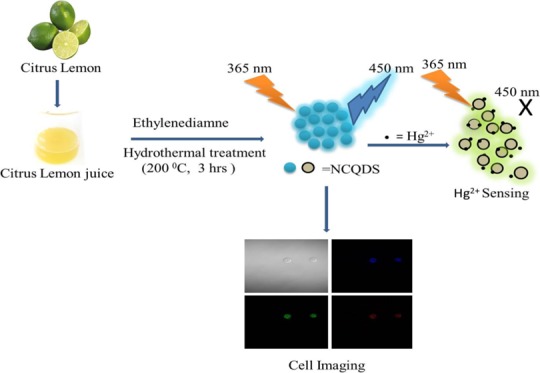
In this study, we report a green and economical hydrothermal synthesis of fluorescent-nitrogen-doped carbon quantum dots (NCQDs) using citrus lemon as a carbon source. The prepared NCQDs possess high water solubility, high ionic stability, resistance to photobleaching, and bright blue color under ultraviolet radiation with a high quantum yield (∼31%). High-resolution transmission electron microscopy (HRTEM) results show that the prepared NCQDs have a narrow size distribution (1–6 nm) with an average particle size of 3 nm. The mercury ion (Hg2+) sensing efficiency of the NCQDs was studied, and the result indicated that the material has high sensitivity, high precision, and good selectivity for Hg2+. The limit of detection (LOD) is 5.3 nM and the limit of quantification (LOQ) is 18.3 nM at a 99% confidence level. The cytotoxicity was evaluated using MCF7 cells, and the cell viabilities were determined to be greater than 88% upon the addition of NCQDs over a wide concentration range from 0 to 2 mg/mL. Based on the low cytotoxicity, good biocompatibility, and other revealed interesting merits, we also applied the prepared NCQDs as an effective fluorescent probe for multicolor live cell imaging.
Introduction
At present, water contamination by heavy metals has become a serious problem.1 Heavy metals are toxic to aquatic living organisms and harmful to humans through food-chain accumulation.2 Mercury is a heavy metal well known for its extremely high toxicity and a threat to human life and the whole environment.3 Inorganic mercury in water mainly appears in the toxic form of the Hg2+ oxidation state. As per the World Health Organization (WHO) recommendation, the maximum uptake of Hg2+ is 0.3 mg/week and the maximum acceptable limit in drinking water is 1 μg/L.4 The maximum level of mercury in drinking water permitted by the US Environmental Protection Agency is 2 ppb.5 In this regard, monitoring the concentration of Hg2+ in water is very essential. Techniques for accurate quantification of trace concentrations of mercury such as atomic absorption spectroscopy6 and inductively coupled plasma atomic emission spectrometry7 provide limits of detection up to parts per billion levels. However, their excellent performance is achieved at a high cost and time-consuming sample preparation and preconcentration procedures. As an alternative, fluorescent detection methods that can encompass a variety of advantages, including real-time and remote measurements, sensitivity and selectivity against competing analytes, and reliable, compact, and low-cost detection, have been developed for sensing of Hg2+ ions in an aquatic environment. Ncube et al.8 reported a fluorescent sensing probe based on a naphthyl azo dye modified dibenzo-18-crown-6-ether for the detection and determination of Hg2+ ions in water, and the probe showed high sensitivity and selectivity for Hg2+ ions among various alkali, alkaline earth, and transition-metal ions. Xia and Zhu9 used surface-modified CdTe quantum dots as fluorescent probes in the sensing of Hg2+ ions. However, the highly toxic effect of inorganic quantum dots, low quantum yield, and easy photobleaching of organic dyes have limited the application of these materials in the real-environment detection of Hg2+ ions. Recently, Hg2+ ion probe based on the fluorescence quenching of carbon quantum dots (CQDs) has been developed and received intense attention because of its simplicity, sensitivity, and selectivity.10−12
Carbon dots, which are also known as carbon quantum dots (CQDs), are a class of fluorescent nanomaterials with ultralow particle size (<10 nm). CQDs have interesting properties such as unique bright and tunable photoluminescence, high water solubility, excellent biocompatibility, and stability to photodegradation and photobleaching.13 In comparison with other quantum dots that are derived from heavy-metal precursors, CQDs are environmentally green and nontoxic to cell.14 Because of these important properties, the CQDs have attracted immense attention in various applications such as analytical sensing,15 bioimaging,14 and photocatalysis.16
Much progress has been made in the synthesis of photoluminescent CQDs using different methods. Researchers frequently used the hydrothermal method since it is a facile, eco-friendly, one-step process with a low synthesis cost as compared to other methods.17 Carbonization carried out by the hydrothermal method at low temperature with self-created pressure is a green method because no pollutant is released into the environment. Different natural products like orange juice18 and amino acids19 have been used as precursors to prepare fluorescent CQDs. Investigating new and green precursors for the economical synthesis of fluorescent CQDs is important. In the search for new precursors for carbon quantum dots, using environmentally green plant materials is becoming most encouraging. However, the quantum yield of most of the carbon quantum dots prepared from plant materials is relatively low.20−24 In the search for high quantum yield carbon quantum dots from natural products, we investigated the synthesis of NPQDs from lemon fruit juice as a source of carbon.
Studies have shown that citric acid is an excellent precursor for the synthesis of CQDs because it has well-known low carbonization temperature,18 and amine-containing molecules such as ethylenediamine are able to passivate CQDs with amines and form nitrogen-doped carbon quantum dots, thus increasing the quantum yield and selectively sensing analytes, such as Hg2+, Cu2+, and Cr6+ ions.14 In spite of the controversy regarding the mechanism of the photoluminescence (PL) of doped CQDs, it is agreed that trap states with different energy levels can be introduced by surface groups, which result in excitation-dependent fluorescence.25
The sour taste of lemon juice is due to the presence of a high concentration of citric acid.26 Motivated by these, we synthesized water-soluble highly fluorescent-nitrogen-doped carbon quantum dots (NCQDs) with high quantum yield (QY ∼ 31%) using eco-friendly green hydrothermal synthesis methods utilizing lemon juice as a precursor and ethylenediamine as the co-reagent. The fluorescence intensity of the prepared NCQDs is based on the pH value, and they have high photostability under different salt conditions, high photobleaching resistance, and high water solubility. The cell viability study using the 3-(4,5-dimethylthiazol-2-yl)-2,5-diphenyl tetrazolium bromide (MTT) assay of the MCF7 cell line indicated that the as-synthesized NCQDs are nontoxic. The prepared NCQDs were used for Hg2+ ion sensing in water and cell imaging, and the results revealed that they have great potential in sensing and biological application.
Experimental Section
Chemicals and Reagents
Citrus lemons were collected fresh from the nearby market in Andhra University, India, and NCQDs were prepared from the juice of these lemons using the hydrothermal method. All the reagents were of analytical grade and used without any further purification. Milli-Q water was used throughout the analysis.
Synthesis of NCQDs
Twenty milliliters of filtered fresh lemon juice and 2 mL of ethylenediamine co-reagent were mixed in 100 mL hydrothermal autoclave and kept in a furnace at 200 °C for 3 h. The as-obtained black paste was cooled down to room temperature and then dissolved in 15 mL of water and centrifuged at 3000 rpm for 15 min to separate insoluble matter. Then, dichloromethane was added to the brown solution of NCQDs and centrifuged at 3000 rpm for 20 min to remove unreacted organic moieties. The separated upper aqueous layer was then centrifuged at 12 000 rpm for 20 min thrice to remove larger-sized particles, and a brown-yellowish supernatant was finally obtained. NCQDs with smaller particle sizes were separated using column chromatography taking silica gel as the stationary phase and dichloromethane as the solvent. The as-prepared NCQDs were stored at 4 °C for characterization and used for applications.
Characterization
High-resolution transmission electron microscopy (HRTEM, Jeol/JEM 2100, LaB6) operated at 200 kV was used to determine the morphological and microstructural properties of the prepared NCQDs. Further morphological and compositional information of the samples was determined using field emission scanning electron microscopy (FESEM, Zeiss Ultra-60) equipped with an X-ray energy-dispersive spectroscope. PANalytical X’pert pro X-ray diffraction (XRD) using Cu Kα1 radiation (45 kV, 1.54056 Å; scan rate of 0.02°/s) was used to determine the crystalline pattern. The IR spectra were obtained over the range of 400–4000 cm–1 using an Fourier transform infrared (FTIR) spectrometer (Bruker). The emission properties of the NCQDs were determined with a Fluoromax-4 spectrofluorometer (HORIBA Scientific). The absorbance spectra of NCQDs were recorded using a UNICAM UV 500 spectrophotometer (Thermo Electron Corporation).
Quantum Yield
The following eq 1 was used to calculate the quantum yield (QY) by taking quinine sulfate in 0.1 M H2SO4 (the quantum yield of 54% at 365 nm) as a reference.27 The QY of NCQDs was determined by following the reported protocol. The UV–vis absorption at 365 nm and PL emission spectra (excited at 365 nm) of carbon dots and reference was measured, respectively. To reduce the reabsorption effects, the absorbance was kept under 0.05 at the excitation wavelength. The QY can be calculated using the following equation
| 1 |
where QYsamp and QYref are the quantum yields; Isamp and Iref are emission intensities; Asamp and Aref are the UV–vis absorbances; and nsamp and nref are refractive indexes of the sample and reference, respectively.
Sensing of Hg2+
The fluorescent (FL) assay of Hg2+ was carried out at room temperature using fluorescence quenching of 25 μg/mL of NCQDs in phosphate-buffered solution (PBS) at pH 7.4 (absorbance of solution = 0.05). For the detection of Hg2+ ion, the NCQDs solution was taken in a cuvette and 30 μL of different concentrations of Hg2+ was added, and finally, the volume was adjusted to 3 mL by the NCQDs solution. The FL emission spectra at 365 nm excitation were measured after reaction for 5 min at room temperature. Selectivity study was done using competing ions in place of Hg2+ and a mixture of other cations with Hg2+. The reproducibility of the method was investigated by recording the FL spectra of nine solutions prepared side by side containing 1 × 10⁻⁸ M Hg2+ prepared in the same procedure as mentioned above.
Cytotoxicity Test
The biocompatibility of NCQDs was tested on human breast adenocarcinoma (MCF7) cells using the MTT assay. Cytotoxicity was evaluated by determining the activity of mitochondrial enzymes in live MCF7 cells to transform the yellow MTT solution to an insoluble purple formazan. MCF7 cells were cultured in 96-well tissue culture plates at a density of 1 × 10⁴ cells per well and then the cells were incubated in a medium containing different doses of NCQDs for 24 h. Subsequently, the medium was removed and the cells were washed with the phosphate-buffered solution (PBS). Fresh medium with 10 μL of 0.5 mg/mL MTT solution was supplemented to each well and incubated for 4 h and then the medium was replaced with 150 μL of dimethyl sulfoxide (DMSO) followed by shaking for 15 min to dissolve the formazan crystals. The absorbance of each well was measured at 570 nm using a multimode microplate reader (Biotek, Cytation3). The untreated cells were used as controls for determining the cell viability from the following equation
| 2 |
Cell Imaging
The bioimaging potential of NCQDs was investigated using MCF7 cells. The MCF7 cells were cultured in 6-well culture plates at a density of 105 cells per well in Dulbecco’s modified eagle medium (DMEM) having 10% fetal bovine serum (FBS) and incubated for 24 h at 37 °C and 5% CO2. Then, the medium was replaced with a fresh medium of 0.025 mg/mL NCQDs and incubated for 6 h. After that the cells were washed thrice with PBS to remove extracellular NCQDs, fixed with 4% paraformaldehyde and mounted using 50% glycerol. Images were obtained using “Zeiss LSM 510 Meta confocal Microscopy” at laser excitations of 405, 488, and 561 nm.
Results and Discussion
Characterization
Upon hydrothermal treatment of precursors at 200 °C for 3 h and after separation as per procedures, the brown solution of NCQDs was obtained, as shown in Scheme 1. Figure 1 shows the absorption and emission spectra of the as-prepared NCQDs. The prepared NCQDs show two typical absorption peaks at 245 and 353 nm, as shown in Figure 1 (black solid line), which extended with a tail to the visible region. The absorption peak at 245 nm could be assigned to the π–π* transition of aromatic −C=C– bonds in the sp2-hybridized domain of graphitic core and the other peak at 353 nm could be assigned to the n–π* transition of −C=O, C–N, or −C–OH bonds in the sp3-hybridized domains, which may be from hydroxyl (−COOH) or amine (−NH2) group on the surface of NCQDs.28−31 The aqueous solution of NCQDs with brown-yellowish color appears bright blue under ultraviolet radiation (inset in Figure 1b), which indicates the bright luminescence of the prepared NCQDs. Figure 1 (blue broken line) indicates the emission spectra of the blue luminescent NCQDs, with excitation at 360 nm and emission at 452 nm. Full width at half-maximum (FWHM) value obtained at this particular fluorescence emission is 75 nm, indicating the narrow size distribution of the synthesized NCQDs.32−35
Scheme 1. Scheme Showing Reaction of Precursors to Produce NCQDs.

Figure 1.
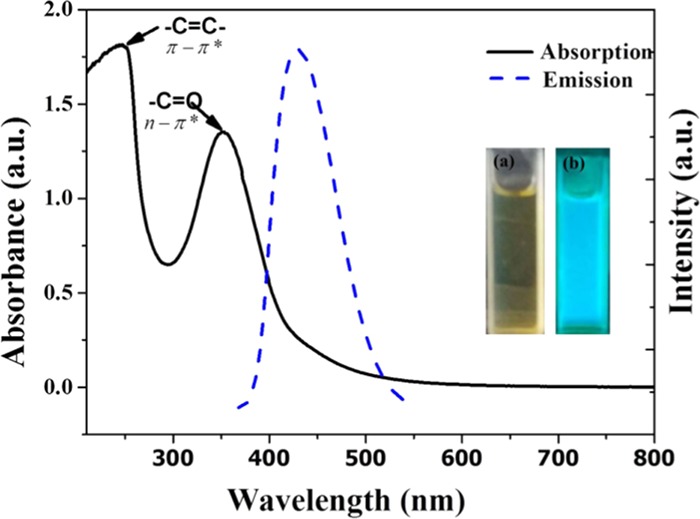
UV–vis absorption (solid black) and fluorescence spectra (blue broken) of (a) NCQDs in daylight and (b) NCQDs under ultraviolet radiation.
To further study the optical properties of the as-prepared NCQDs, a fluorescence study was carried out at different excitation wavelengths. To clarify the concept of photoluminescence, the 2D FL emission spectra of the NCQDs can be divided into two parts: one with excitation wavelengths from 300 to 410 nm (Figure 2a) and the other with the excitation wavelength from 410 to 490 nm (Figure 2b). As seen from the figures, the sample shows fluorescence with symmetrical peaks. The fluorescence emission intensity increases as the excitation wavelength increases from 310 to 360 nm, and the maximum emission intensity is obtained at the excitation wavelength of 360 nm. Further increase in excitation wavelengths results in a decrease in emission intensity. Overall, as the excitation wavelengths increase, the emission wavelengths shift to longer wavelengths (red shift). Figure 2c depicts the fluorescence emission–excitation spectra of the NCQDs, with excitation wavelengths increasing from 300 to 400 nm in 4 nm steps and showing symmetrical emission peaks. Figure 2d indicates the excitation and emission contour map of NCQDs showing emission at different excitation wavelengths. The fluorescence of NCQDS may be due to the π-plasmon absorption in the core carbon nanoparticles,36 and, to large extent, photoluminescence is highly affected by the surface chemistry of NCQDs.37 The as-synthesized NCQDs show a high FL quantum yield (QY ∼ 31%) relative to the standard quinine sulfate. This relatively high QY is due to nitrogen doping in NCQDs, as heteroatom doping may significantly improve the QY of carbon dots and N doping may provide the most effective enhancement to QY.38−40 As shown in Table 1, compared to the NCQDs synthesized using different plant materials as precursor, the NCQDs synthesized from citrus lemon juice in this work has a high QY.41−46 NCQDs showed the conversion FL in addition to strong down-converted FL properties. Figure S3a shows the FL spectra as NCQDs are excited with a longer-wavelength light with emissions centered at a wavelength of 450 nm, which is comparable to that of the down-converted FL peaks.
Figure 2.

(a) FL emission spectra of NCQDs at excitation wavelengths from 300 to 410 nm, (b) FL emission spectra of NCQDs at excitation wavelengths from 410 to 490 nm, (c) excitation–emission fluorescence spectra of NCQDs (excitation from 300 to 400 nm and corresponding emission), and (d) excitation and emission contour map of NCQDs.
Table 1. Comparison of Fluorescence Quantum Yields of CQDs Prepared Using Different Plants.
| sl. no. | plant materials as precursor | quantum yield (%) | refs |
|---|---|---|---|
| 1 | Syzygium cumini fruits | 5.9 | (21) |
| 2 | Chionanthus retusus fruit | 9 | (22) |
| 3 | fennel seeds | 9.5 | (23) |
| 4 | quince fruit | 8.55 | (41) |
| 5 | lotus root | 19.0 | (43) |
| 6 | ginkgo fruit | 3.33 | (44) |
| 7 | carrot juice | 5.16 | (45) |
| 8 | unripe Prunus mume juice | 16 | (47) |
| 9 | Citrus aurantium juice | 19.9 | (48) |
| 10 | citrus lemon juice | 31 | present study |
The ionic strength of the as-synthesized NCQDs was investigated at different concentrations (0.25–2 M NaCl), and it was obtained that the change in the concentration of salt has no significant effect on the fluorescence of NCQDs (Figure 3a). In addition, NCQDs have shown high FL stability in that neither significant shift in emission wavelength nor significant reduction in FL intensity is observed upon continuous exposure to ultraviolet radiation from 1 to 45 min (Figure 3b) and after 3 months of storage. The effect of pH on the fluorescence property of NCQDs was investigated and the fluorescence intensity of the NCQDs depends on the pH of the solution but there is no shift in emission wavelength. Decreasing pH from 6 to 2 increased the FL intensity (Figure 3c) and increasing the pH from 8 to 12 decreased the FL intensity (Figure 3d). These results described that under low pH values, the NCQDs, probably, exist as isolated species in the aqueous solution; the nanoparticles agglomerated with increasing pH value because of interactions such as hydrogen bonds between the carboxyl groups.46 The change in fluorescence intensity with pH change should result from the transition between isolated C–NH2 in acidic conditions and agglomerated C=NH in alkaline conditions. As shown in Figure S8, the surface nitrogen of NCQDs-OH existed in the form of imino groups in the alkaline environment. However, the imino groups could be transformed into amino groups in acidic conditions.
Figure 3.

(a) Fluorescence intensity of NCQDs at excitation wavelength of 365 nm indicating the ionic strength of NaCl solution of concentration 0.25–2 M. (b) Stability after irradiation at different times and after preservation for 1 and 3 months. (c) pH effect in acidic media with a pH of 6–2. (d) pH effect in basic media with pH of 8–12.
The morphological properties of the as-synthesized NCQDs were confirmed by HRTEM (Figure 4a,b). The results indicated that the NCQDs are uniformly distributed quasi-spherical nanoparticles with narrow size distribution. Particle sizes of the NCQDs are of diameter in the range of 1–6 nm with an average of 3 nm based on a statistical analysis of more than 90 dots (histogram in Figure 4d). Figure 4c shows the selected area electron diffraction (SAED) of the NCQDs, the holes indicating the particle formation and only two bright spots observed indicating the amorphous nature. As shown in the inset of Figure 4a, the as-synthesized NCQDs exhibit a lattice spacing of 0.19 nm, which is similar to the (100) facet of the sp2 graphitic carbon.49 X-ray diffraction patterns show a broad and intense diffraction peak centered at 2θ = 23° and a weak peak at 2θ = 42°, which is assigned to the (002) and (101) diffraction patterns of graphitic carbon, as shown in Figure 7a, which indicates the amorphous nature of the NCQDs and is in accordance with previous structure analysis on disordered amorphous graphitic CQDs.50
Figure 4.

(a, b) Representative TEM and HRTEM (inset) images. (c) SAED of NCQDs and (d) particle size distribution histogram.
Figure 7.

(a) Fluorescence spectra of NCQDs solution in the presence of different concentrations of Hg2+ and (b) corresponding calibration curve. (c) Fluorescence quenching response of NCQDs to different metal ions with the same concentration (1 μM). (d) Specific FL quenching response of NCQDs to Hg2+ ions in the presence of other cations.
Information regarding the surface functional group of NCQDs was investigated by Fourier transform infrared spectroscopy (FTIR). As can be seen in the spectrum (Figure 6b), there is a broad overlapping strong bands in the range of 3070–3600 cm–1, which can be due to the stretching vibration of the O–H and N–H bonds. The vibrational band of the C–O bond at 1112 cm–1 confirms the presence of primary −OH groups on the surface of NCQDs. The appearance of bands at 2934 cm–1 and in the range of 1040–1300 cm–1 illustrates the existence of aliphatic C–H and C–N/C–O functional groups, respectively. The sharp band at 1546 cm–1 can be assigned to the N–H vibration and deformation band, which indicates the presence of an amino functional group. In addition, the existence of characteristic stretching and bending vibrational bands for C–H and stretching vibrations for C=C in aromatic hydrocarbons at 3060, 770, and 1434 cm–1 confirms the presence of the aromatic skeleton (sp2-hybridized carbon) in the prepared NCQDs. Hence, the FTIR analysis shows the presence of functional groups such as alcohols, amines, aromatic rings, and carbonyls on the surface and sp2/sp3 core carbon in NCQDs derived from citrus lemon juice. The presence of different functional groups on the surface makes the NCQDs highly water-soluble.51−53
Figure 6.

(a) XRD peak of NCQDs. (b) FTIR spectrum. (c) Energy dispersive spectroscopy (EDS) spectrum (inset elemental composition of NCQDs and FESEM image).
Raman spectrometer analysis also confirmed the structural properties of NCQDs. As shown in Figure 5, the Raman spectrum of the NCQDs exhibits two peaks at 1348 and 1547 cm–1, corresponding to the D and G bands of graphitic carbon, respectively. The ratio of ID/IG is 1.03, which is characteristic of the disorder amorphous nature and the ratio of sp3/sp2 carbon, implying structural defects in the synthesized NCQDs.
Figure 5.
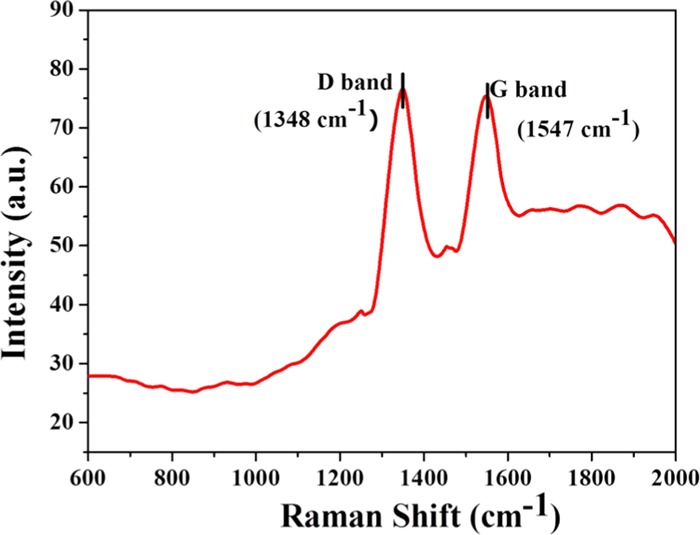
Raman spectra of NCQDs.
FESEM images of a paper sheetlike layer in Figure 6c inset indicate the amorphous nature of NCQDs. The result from the elemental composition analysis of the energy-dispersive X-ray spectroscopy (EDX) spectrum (Figure 6c) reveals the presence of C, O, and N in the as-synthesized material, indicating the formation of nitrogen-doped carbon quantum dots.
Quantitative Assay
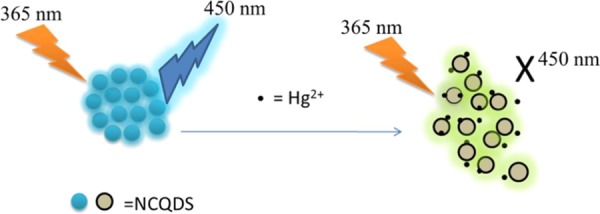
The mechanism to determine Hg2+ using fluorescence quenching of NCQDs is based on the interaction of oxygen/nitrogen-containing groups over the NCQDs surface with Hg2+ cations. The oxygen/nitrogen-containing groups have a good affinity to form a coordination bond with Hg2+ ions by donating electron pair from the functional terminal to the metal ions, resulting in the fluorescence quenching effect.54 The fluorescence quenching of NCQDs by Hg2+ ions presumably due to facilitating nonradiative electron/hole recombination/annihilation through partial electron transfer process in coordinate bond formation.55,56 The fluorescence sensing performance of the nitrogen-doped carbon quantum dots based on fluorescent quenching was evaluated by adding different concentrations of Hg2+ (0–100 μM) into the NCQD solution. As shown in Scheme 2, the fluorescence of NCQDs quenched in the presence of Hg2+ ion and the fluorescence quenching intensity depends on the concentration of Hg2+. The fluorescence spectra in the presence of various concentrations of Hg2+ in NCQDs are shown in Figure 7a. With increasing concentration of Hg2+, the fluorescence intensity of the NCQDs was gradually decreased.57 A linear relationship between the fluorescence quenching factor of NCQDs and the concentration of Hg2+ was obtained within a linear range of 0.001–1 μM with a correlation coefficient R2 of 0.995, as shown in Figure 7b.
Scheme 2. Scheme Showing Fluorescence Quenching of NCQDs by Hg2+ Ions.
The linear regression equation53 is
| 3 |
where I0 and I are the fluorescence intensities of NCQDs solutions at 465 nm without and in the presence of Hg2+ ions, respectively, and [Hg2+] is the concentration of Hg2+ ions. Detection limit determined based on the blank is 5.3 nM (t. σ, n = 9, where σ is the standard deviation and t is taken from a one-sided Student’s t distribution for n – 1 degrees of freedom at a 99% confidence level) and precision is 1.32% relative standard deviation (RSD; 0.01 μM, n = 11). The limit of quantification for this method is 18.3 nM (10σ, n = 9) at a 99% confidence level.
Selectivity
To study the selectivity of Hg2+ ions over other competing cations, 30 μL of 1 × 10⁻⁴ M solution of cations (Na+, K+, Mg2+, Mn2+, Cu2+, Ni2+, Ca2+, Co2+, Cd2+, Zn2+, Fe2+, Fe3+, Sn2+, Ba2+, Hg2+, Pb2+, Al3+) were added to NCQD solution in phosphate-buffered solution of pH 7.4 and makeup to 3 mL with final concentration of 1 μM. Fluorescence spectrum was recorded after 5 min of addition and compared with the fluorescence intensity of blank (3 mL of NCQDs in phosphate-buffered solution). As shown in Figure 7c, the addition of Hg2+ and Fe3+ ions noticeably reduces the intensity of NCQDs, whereas the effect of other cations is negligible. To further investigate the interference of the above cations with Hg2+ ions, 25 μL of 1 × 10⁻⁴ M solution of cations (Na+, K+, Mg2+, Mn2+, Cu2+, Ni2+, Ca2+, Co2+, Cd2+, Zn2+, Fe2+, Fe3+, Sn2+, Ba2+, Pb2+, Al3+) and 30 μL of 1 × 10⁻⁴ M of Hg2+ were taken in a cuvette containing NCQDs and the volume adjusted to 3 mL and then the spectrum was recorded. Figure 7d illustrates that the presence of cations (Na+, K+, Mg2+, Mn2+, Cu2+, Ni2+, Ca2+, Co2+, Cd2+, Zn2+, Fe2+, Sn2+, Ba2+, Pb2+, Al3+) with Hg2+ has no effect on the fluorescence sensing of Hg2+ because the fluorescence decrease is the same as that for the solution containing only Hg2+. However, the presence of Fe3+ causes more decrease, although it is insignificant. Hence, NCQDs can be used for selective fluorescence sensing of Hg2+ ions in aqueous solution.
Real Water Analysis
To evaluate the feasibility of the fluorescent NCQDs for Hg2+ sensing, different concentrations of Hg2+ added in water samples were determined by the spike recovery method, and the results are listed in Table 2. It can be seen that the recoveries of the samples were found to be in the range of 95–101% and the RSDs were less than 5.0%. The results showed that it was an applicable method for the determination of Hg2+ in water samples.
Table 2. Result of Hg2+ Detection in Real Water Samples Using Fluorescent NCQDs.
| concentration
of Hg2+(μM) |
||||
|---|---|---|---|---|
| sample | amount added | amount found | % recovery | %RSD (n = 3) |
| tap water 1 | 0.250 | 0.256 | 100.8 | 2.5 |
| tap water 2 | 0.040 | 0.041 | 95.2 | 4.3 |
| packed water 1 | 0.100 | 0.098 | 96.0 | 2.8 |
| packed water 2 | 0.100 | 0.097 | 95.0 | 3.7 |
Cytotoxicity Test and Live Cell Imaging
The feasibility of NCQDs derived from lemon juice for potential bioimaging applications was evaluated by the cytotoxicity test through the MTT assay using human breast adenocarcinoma (MCF7) cells. Results of cytotoxicity studies performed using various concentrations of NCQDs (0.312–2 mg/mL) are shown in Figure 8. The NCQDs exhibited low cytotoxicity, with cells maintaining the viability of about 88% for MCF7 cells at a high concentration of 2 mg/mL after 24 h incubation. The results revealed the low toxicity and excellent biocompatibility of the prepared NCQDs derived from lemon juice, which made them a suitable fluorescent probe for bioimaging application.44
Figure 8.
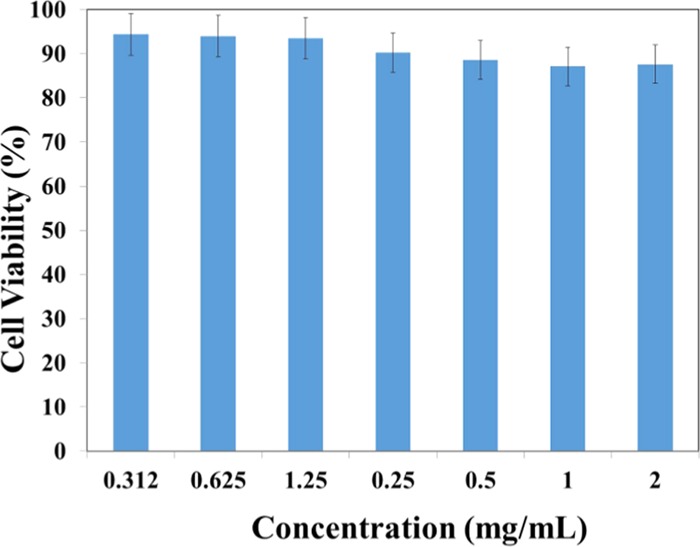
NCQDs Cell Viability Using MTT Assay.
Fluorescence imaging potential of NCQDs was tested by treating MCF7 cells with 0.025 mg/mL of NCQDs derived from citrus lemon juice. Cell images were recorded with confocal microscopy at laser excitations of 405, 488, and 561 nm. Figure 9 shows the confocal microscopic images of MCF7 cells after incubation with NCQDs. The obtained bright-field image after incubation indicates the viability of the cells (Figure 9a). After excitation at 405, 488, and 561 nm, bright blue, green, and red luminescence in the cytoplasm region was observed, respectively, indicating the excellent cell membrane permeability of NCQDs.58 The results indicate that fluorescent, water-soluble NCQDS derived from citrus lemon juice can be used as an excellent fluorescent bioimaging probe.
Figure 9.

(a–d) Fluorescence images of NCQDs labeled MCF7 cells under bright field, 405, 488, and 561 nm excitations, respectively.
Conclusions
A facile, environmentally green hydrothermal method was used to synthesize highly photofluorescent, water-soluble nitrogen-doped carbon quantum dots (NCQDs) using abundantly available fruit, citrus lemon juice as a carbon source and ethylenediamine as a coreagent. The obtained NCQDs exhibit high quantum yield, narrow size distribution, highest fluorescence intensity, good water solubility, excellent stability, and good resistance to ionic strength and photobleaching. From an environmental perspective, investigation of the sensing efficiency of NCQDs for Hg2+ ions in water samples shows that the material is suitable to develop selective sensors with high accuracy (LOD = 5.3 nM, LOQ = 18.3 nM) and high precision. From the MTT assay, we observed that the prepared NCQDs show low cytotoxicity and excellent biocompatibility. The multicolor living cell imaging of the NCQDs was investigated, and we conclude that the prepared NCQDs may be used as an eco-friendly fluorescent nanomaterial for potential in vitro or in vivo multicolor imaging and sensing applications.
Acknowledgments
The authors are grateful for the support from the Ministry of Education, Federal Democratic Republic of Ethiopia and Adama Science and Technology University. Thanks also go to Dr. P. Shyamala (Head, Department of Physical, Nuclear Chemistry and Chemical Oceanography, Andhra University) for allowing us to use their instruments.
Supporting Information Available
The Supporting Information is available free of charge at https://pubs.acs.org/doi/10.1021/acsomega.9b03175.
Optimization of synthesis method, quantum yield of synthesized NCQDs, FESEM images of NCQDs, upconverted fluorescence of NCQDS, electronic properties of NCQDs, 1H NMR spectra and 13C NMR of NCQDs, quenching effect of Hg2+ on fluorescence of NCQDs, pH effect on fluorescence of NCQDs, and carbon quantum dots dFL quenching based methods for Hg2+ detection (PDF)
The authors declare no competing financial interest.
Supplementary Material
References
- Asrari E.Heavy Metal Contamination of Water and Soil: Analysis, Assessment, and Remediation Strategies; CRC Press, 2014. [Google Scholar]
- Olsson P.-E.; Kling P.; Hogstrand C. Mechanisms of Heavy Metal Accumulation and Toxicity in Fish. Metal Metab. Aquat. Environ. 1998, 6, 321–350. 10.1007/978-1-4757-2761-6_10. [DOI] [Google Scholar]
- Gopalakrishnan S.; Thilagam H.; Raja P. V. Comparison of Heavy Metal Toxicity in Life Stages (spermiotoxicity, Egg Toxicity, Embryotoxicity and Larval Toxicity) of Hydroides elegans. Chemosphere 2008, 71, 515–528. 10.1016/j.chemosphere.2007.09.062. [DOI] [PubMed] [Google Scholar]
- World Health Organization. Guidelines for Drinking-Water Quality; World Health Organization, 2006. [Google Scholar]
- Wu D.; Huang W.; Duan C.; Lin Z.; Meng Q. Highly Sensitive Fluorescent Probe for Selective Detection of Hg2 + in DMF Aqueous Media. Inorg. Chem. 2007, 46, 1538–1540. 10.1021/ic062274e. [DOI] [PubMed] [Google Scholar]
- Hatch W. R.; Ott W. L. Determination of Submicrogram Quantities of Mercury by Atomic Absorption Spectrophotometry. Anal. Chem. 1968, 40, 2085–2087. 10.1021/ac50158a025. [DOI] [Google Scholar]
- Han F. X.; Dean Patterson W.; Xia Y.; Maruthi Sridhar B. B.; Su Y. Rapid Determination of Mercury in Plant and Soil Samples Using Inductively Coupled Plasma Atomic Emission Spectroscopy, a Comparative Study. Water, Air, Soil Pollut. 2006, 170, 161–171. 10.1007/s11270-006-3003-5. [DOI] [Google Scholar]
- Ncube P.; Krause R. W. M.; Ndinteh D. T.; Mamba B. B. Fluorescent Sensing and Determination of Mercury (II) Ions in Water. Water SA. 2014, 40, 175 10.4314/wsa.v40i1.21. [DOI] [Google Scholar]
- Xia Y.-S.; Zhu C.-Q. Use of Surface-Modified CdTe Quantum Dots as Fluorescent Probes in Sensing Mercury (II). Talanta 2008, 75, 215–221. 10.1016/j.talanta.2007.11.008. [DOI] [PubMed] [Google Scholar]
- Wu H.; Tong C. Nitrogen- and Sulfur-Codoped Carbon Dots for Highly Selective and Sensitive Fluorescent Detection of Hg2 Ions and Sulfide in Environmental Water Samples. J. Agric. Food Chem. 2019, 67, 2794–2800. 10.1021/acs.jafc.8b07176. [DOI] [PubMed] [Google Scholar]
- Zhang Y.; He Y. H.; Cui P. P.; Feng X. T.; Chen L.; Yang Y. Z.; Liu X. G. Water-Soluble, Nitrogen-Doped Fluorescent Carbon Dots for Highly Sensitive and Selective Detection of Hg2 in Aqueous Solution. RSC Adv. 2015, 5, 40393–40401. 10.1039/C5RA04653J. [DOI] [Google Scholar]
- Liang J. Y.; Han L.; Liu S. G.; Ju Y. J.; Li N. B.; Luo H. Q. Carbon Dots-Based Fluorescent Turn Off/on Sensor for Highly Selective and Sensitive Detection of Hg2 and Biothiols. Spectrochim. Acta, Part A 2019, 222, 117260 10.1016/j.saa.2019.117260. [DOI] [PubMed] [Google Scholar]
- Song Y.; Zhu S.; Yang B. Bioimaging Based on Fluorescent Carbon Dots. RSC Adv. 2014, 4, 27184 10.1039/c3ra47994c. [DOI] [Google Scholar]
- Wang J.; Zhang P.; Huang C.; Liu G.; Leung K. C.-F.; Wáng Y. X. J. High Performance Photoluminescent Carbon Dots for In Vitro and In Vivo Bioimaging: Effect of Nitrogen Doping Ratios. Langmuir 2015, 31, 8063–8073. 10.1021/acs.langmuir.5b01875. [DOI] [PubMed] [Google Scholar]
- Qian Z. S.; Chai L. J.; Huang Y. Y.; Tang C.; Jia Shen J.; Chen J. R.; Feng H. A Real-Time Fluorescent Assay for the Detection of Alkaline Phosphatase Activity Based on Carbon Quantum Dots. Biosens. Bioelectron. 2015, 68, 675–680. 10.1016/j.bios.2015.01.068. [DOI] [PubMed] [Google Scholar]
- Wang H.; Zhuang J.; Velado D.; Wei Z.; Matsui H.; Zhou S. Near-Infrared- and Visible-Light-Enhanced Metal-Free Catalytic Degradation of Organic Pollutants over Carbon-Dot-Based Carbocatalysts Synthesized from Biomass. ACS Appl. Mater. Interfaces 2015, 7, 27703–27712. 10.1021/acsami.5b08443. [DOI] [PubMed] [Google Scholar]
- Hua J.; Yang J.; Zhu Y.; Zhao C.; Yang Y. Highly Fluorescent Carbon Quantum Dots as Nanoprobes for Sensitive and Selective Determination of Mercury (II) in Surface Waters. Spectrochim. Acta, Part A 2017, 187, 149–155. 10.1016/j.saa.2017.06.058. [DOI] [PubMed] [Google Scholar]
- Sahu S.; Behera B.; Maiti T. K.; Mohapatra S. Simple One-Step Synthesis of Highly Luminescent Carbon Dots from Orange Juice: Application as Excellent Bio-Imaging Agents. Chem. Commun. 2012, 48, 8835–8837. 10.1039/c2cc33796g. [DOI] [PubMed] [Google Scholar]
- Pei S.; Zhang J.; Gao M.; Wu D.; Yang Y.; Liu R. A Facile Hydrothermal Approach towards Photoluminescent Carbon Dots from Amino Acids. J. Colloid Interface Sci. 2015, 439, 129–133. 10.1016/j.jcis.2014.10.030. [DOI] [PubMed] [Google Scholar]
- Feng X.; Zhang Y. A Simple and Green Synthesis of Carbon Quantum Dots from Coke for White Light-Emitting Devices. RSC Adv. 2019, 9, 33789–33793. 10.1039/C9RA06946A. [DOI] [PMC free article] [PubMed] [Google Scholar]
- Bhamore J. R.; Jha S.; Singhal R. K.; Kailasa S. K. Synthesis of Water Dispersible Fluorescent Carbon Nanocrystals from Syzygium cumini Fruits for the Detection of Fe Ion in Water and Biological Samples and Imaging of Fusarium avenaceum Cells. J. Fluoresc. 2017, 27, 125–134. 10.1007/s10895-016-1940-y. [DOI] [PubMed] [Google Scholar]
- Atchudan R.; Nesakumar Jebakumar T.; Chakradhar D.; Perumal S.; Shim J.-J.; Lee Y. R. Facile Green Synthesis of Nitrogen-Doped Carbon Dots Using Chionanthus retusus Fruit Extract and Investigation of Their Suitability for Metal Ion Sensing and Biological Applications. Sens. Actuators, B 2017, 246, 497–509. 10.1016/j.snb.2017.02.119. [DOI] [Google Scholar]
- Dager A.; Uchida T.; Maekawa T.; Tachibana M. Synthesis and Characterization of Mono-Disperse Carbon Quantum Dots from Fennel Seeds: Photoluminescence Analysis Using Machine Learning. Sci. Rep. 2019, 9, 14004 10.1038/s41598-019-50397-5. [DOI] [PMC free article] [PubMed] [Google Scholar]
- Meng W.; Bai X.; Wang B.; Liu Z.; Lu S.; Yang B. Biomass-Derived Carbon Dots and Their Applications. Energy Environ. Mater. 2019, 2, 172–192. 10.1002/eem2.12038. [DOI] [Google Scholar]
- Chatzimitakos T.; Stalikas C. Recent Advances in Carbon Dots. J. Carbon Res. 2019, 5, 41 10.3390/c5030041. [DOI] [Google Scholar]
- Penniston K. L.; Nakada S. Y.; Holmes R. P.; Assimos D. G. Quantitative Assessment of Citric Acid in Lemon Juice, Lime Juice, and Commercially-Available Fruit Juice Products. J. Endourol. 2008, 22, 567–570. 10.1089/end.2007.0304. [DOI] [PMC free article] [PubMed] [Google Scholar]
- Magde D.; Rojas G. E.; Seybold P. G. Solvent Dependence of the Fluorescence Lifetimes of Xanthene Dyes. Photochem. Photobiol. 1999, 70, 737 10.1111/j.1751-1097.1999.tb08277.x. [DOI] [Google Scholar]
- Bourlinos A. B.; Stassinopoulos A.; Anglos D.; Zboril R.; Karakassides M.; Giannelis E. P. Surface Functionalized Carbogenic Quantum Dots. Small 2008, 4, 455–458. 10.1002/smll.200700578. [DOI] [PubMed] [Google Scholar]
- Dimos K. Carbon Quantum Dots: Surface Passivation and Functionalization. Curr. Org. Chem. 2016, 20, 682–695. 10.2174/1385272819666150730220948. [DOI] [Google Scholar]
- Vieira K. O.; Bettini J.; de Oliveira L. F. C.; Ferrari J. L.; Schiavon M. A. Synthesis of Multicolor Photoluminescent Carbon Quantum Dots Functionalized with Hydrocarbons of Different Chain Lengths. Carbon 2017, 124, 729 10.1016/j.carbon.2017.08.052. [DOI] [Google Scholar]
- Huang Y.; Liao W. Hierarchical Carbon Material of N-Doped Carbon Quantum Dots in-Situ Formed on N-Doped Carbon Nanotube for Efficient Oxygen Reduction. Appl. Surf. Sci. 2019, 495, 143597 10.1016/j.apsusc.2019.143597. [DOI] [Google Scholar]
- Perez-Guzman M. A.; Ortega-Amaya R.; Ortega Lopez M. In Advances on Synthesis of Highly Luminescent Carbon Quantum Dots by Citric Acid Carbonization, 2017 14th International Conference on Electrical Engineering, Computing Science and Automatic Control (CCE). IEEE: Mexico City, Mexico, 2017.
- Kumar V. B.; Sheinberger J.; Porat Z.; Shav-Tal Y.; Gedanken A. A Hydrothermal Reaction of an Aqueous Solution of BSA Yields Highly Fluorescent N Doped C-Dots Used for Imaging of Live Mammalian Cells. J. Mater. Chem. B 2016, 4, 2913–2920. 10.1039/C6TB00519E. [DOI] [PubMed] [Google Scholar]
- Ren G.; Zhang Q.; Li S.; Fu S.; Chai F.; Wang C.; Qu F. One Pot Synthesis of Highly Fluorescent N Doped C-Dots and Used as Fluorescent Probe Detection for Hg2 and Ag in Aqueous Solution. Sens. Actuators, B 2017, 243, 244–253. 10.1016/j.snb.2016.11.149. [DOI] [Google Scholar]
- Atchudan R.; Nesakumar Jebakumar T.; Aseer K. R.; Perumal S.; Karthik N.; Lee Y. R. Highly Fluorescent Nitrogen-Doped Carbon Dots Derived from Phyllanthus acidus Utilized as a Fluorescent Probe for Label-Free Selective Detection of Fe3 Ions, Live Cell Imaging and Fluorescent Ink. Biosens. Bioelectron. 2018, 99, 303–311. 10.1016/j.bios.2017.07.076. [DOI] [PubMed] [Google Scholar]
- Fernando K. A.; Sahu S.; Liu Y.; Lewis W. K.; Guliants E. A.; Jafariyan A.; Wang P.; Bunker C. E.; Sun Y.-P. Carbon Quantum Dots and Applications in Photocatalytic Energy Conversion. ACS Appl. Mater. Interfaces 2015, 7, 8363–8376. 10.1021/acsami.5b00448. [DOI] [PubMed] [Google Scholar]
- Baker S. N.; Baker G. A. Luminescent Carbon Nanodots: Emergent Nanolights. Angew. Chem., Int. Ed. 2010, 49, 6726–6744. 10.1002/anie.200906623. [DOI] [PubMed] [Google Scholar]
- Shan X.; Chai L.; Ma J.; Qian Z.; Chen J.; Feng H. B-Doped Carbon Quantum Dots as a Sensitive Fluorescence Probe for Hydrogen Peroxide and Glucose Detection. Analyst 2014, 139, 2322–2325. 10.1039/C3AN02222F. [DOI] [PubMed] [Google Scholar]
- Wang Y.; Kim S.-H.; Feng L. Highly Luminescent N, S- Co-Doped Carbon Dots and Their Direct Use as mercury(II) Sensor. Anal. Chim. Acta. 2015, 890, 134–142. 10.1016/j.aca.2015.07.051. [DOI] [PubMed] [Google Scholar]
- Gu D.; Hong L.; Zhang L.; Liu H.; Shang S. Nitrogen and Sulfur Co-Doped Highly Luminescent Carbon Dots for Sensitive Detection of Cd (II) Ions and Living Cell Imaging Applications. J. Photochem. Photobiol., B 2018, 186, 144–151. 10.1016/j.jphotobiol.2018.07.012. [DOI] [PubMed] [Google Scholar]
- Ramezani Z.; Qorbanpour M.; Rahbar N. Green Synthesis of Carbon Quantum Dots Using Quince Fruit (Cydonia oblonga) Powder as Carbon Precursor: Application in Cell Imaging and As3 Determination. Colloids Surf., A 2018, 549, 58–66. 10.1016/j.colsurfa.2018.04.006. [DOI] [Google Scholar]
- Zhang W.; Jia L.; Guo X.; Yang R.; Zhang Y.; Zhao Z. Green Synthesis of up- and down-Conversion Photoluminescent Carbon Dots from Coffee Beans for Fe3 Detection and Cell Imaging. Analyst 2019, 144, 7421 10.1039/C9AN01953G. [DOI] [PubMed] [Google Scholar]
- Gu D.; Shang S.; Yu Q.; Shen J. Green Synthesis of Nitrogen-Doped Carbon Dots from Lotus Root for Hg(II) Ions Detection and Cell Imaging. Appl. Surf. Sci. 2016, 390, 38–42. 10.1016/j.apsusc.2016.08.012. [DOI] [Google Scholar]
- Li L.; Li L.; Chen C.-P.; Cui F. Green Synthesis of Nitrogen-Doped Carbon Dots from Ginkgo Fruits and the Application in Cell Imaging. Inorg. Chem. Commun. 2017, 86, 227–231. 10.1016/j.inoche.2017.10.006. [DOI] [Google Scholar]
- Liu Y.; Liu Y.; Park M.; Park S.-J.; Zhang Y.; Akanda M. R.; Park B.-Y.; Kim H. Y. Green Synthesis of Fluorescent Carbon Dots from Carrot Juice for in Vitro Cellular Imaging. Carbon Lett. 2017, 21, 61–67. 10.5714/CL.2017.21.061. [DOI] [Google Scholar]
- Carvalho J.; Santos L. R.; Germino J. C.; Terezo A. J.; Moreto J. A.; Quites F. J.; Freitas R. G. Hydrothermal Synthesis to Water-Stable Luminescent Carbon Dots from Acerola Fruit for Photoluminescent Composites Preparation and Its Application as Sensors. Mater. Res. 2019, 22, 12736 10.1590/1980-5373-mr-2018-0920. [DOI] [Google Scholar]
- Atchudan R.; Nesakumar Jebakumar T.; Sethuraman M. G.; Lee Y. R. Efficient Synthesis of Highly Fluorescent Nitrogen-Doped Carbon Dots for Cell Imaging Using Unripe Fruit Extract of Prunus Mume. Appl. Surf. Sci. 2016, 384, 432–441. 10.1016/j.apsusc.2016.05.054. [DOI] [Google Scholar]
- Fatahi Z.; Esfandiari N.; Ehtesabi H.; Bagheri Z.; Tavana H.; Ranjbar Z.; Latifi H. Physicochemical and Cytotoxicity Analysis of Green Synthesis Carbon Dots for Cell Imaging. EXCLI J. 2019, 18, 454–466. 10.17179/excli2019-1465. [DOI] [PMC free article] [PubMed] [Google Scholar]
- Dong Y.; Pang H.; Yang H. B.; Guo C.; Shao J.; Chi Y.; Li C. M.; Yu T. Carbon-Based Dots Co-Doped with Nitrogen and Sulfur for High Quantum Yield and Excitation-Independent Emission. Angew. Chem. 2013, 125, 7954–7958. 10.1002/ange.201301114. [DOI] [PubMed] [Google Scholar]
- Hao A.; Guo X.; Wu Q.; Sun Y.; Cong C.; Liu W. Exploring the Interactions between Polyethyleneimine Modified Fluorescent Carbon Dots and Bovine Serum Albumin by Spectroscopic Methods. J. Lumin. 2016, 170, 90–96. 10.1016/j.jlumin.2015.10.002. [DOI] [Google Scholar]
- Yan Z.; Shu J.; Yu Y.; Zhang Z.; Liu Z.; Chen J. Preparation of Carbon Quantum Dots Based on Starch and Their Spectral Properties. Luminescence 2015, 30, 388–392. 10.1002/bio.2744. [DOI] [PubMed] [Google Scholar]
- Liu X.; Zheng J.; Yang Y.; Chen Y.; Liu X. Preparation of N-Doped Carbon Dots Based on Starch and Their Application in White LED. Opt. Mater. 2018, 86, 530–536. 10.1016/j.optmat.2018.10.057. [DOI] [Google Scholar]
- Wang Z.-X.; Ding S.-N. One-Pot Green Synthesis of High Quantum Yield Oxygen-Doped, Nitrogen-Rich, Photoluminescent Polymer Carbon Nanoribbons as an Effective Fluorescent Sensing Platform for Sensitive and Selective Detection of silver(I) and mercury(II) Ions. Anal. Chem. 2014, 86, 7436–7445. 10.1021/ac501085d. [DOI] [PubMed] [Google Scholar]
- Abdullah Issa M.; Z Abidin Z.; Sobri S.; Rashid S.; Adzir Mahdi M.; Azowa Ibrahim N.; Y Pudza M. Facile Synthesis of Nitrogen-Doped Carbon Dots from Lignocellulosic Waste. Nanomaterials 2019, 9, 1500 10.3390/nano9101500. [DOI] [PMC free article] [PubMed] [Google Scholar]
- Jeong C. J.; Roy A. K.; Kim S. H.; Lee J.-E.; Jeong J. H.; In I.; Park S. Y. Fluorescent Carbon Nanoparticles Derived from Natural Materials of Mango Fruit for Bio-Imaging Probes. Nanoscale 2014, 6, 15196–15202. 10.1039/C4NR04805A. [DOI] [PubMed] [Google Scholar]
- Mewada A.; Pandey S.; Shinde S.; Mishra N.; Oza G.; Thakur M.; Sharon M.; Sharon M. Green Synthesis of Biocompatible Carbon Dots Using Aqueous Extract of Trapa bispinosa Peel. Mater. Sci. Eng., C 2013, 33, 2914–2917. 10.1016/j.msec.2013.03.018. [DOI] [PubMed] [Google Scholar]
- Wang C.; Sun D.; Chen Y.; Zhuo K. A Hydrothermal Route for Synthesizing Highly Luminescent Sulfur- and Nitrogen-Co-Doped Carbon Dots as Nanosensors for Hg2. RSC Adv. 2016, 6, 86436–86442. 10.1039/C6RA16357B. [DOI] [Google Scholar]
- Sachdev A.; Gopinath P. Green Synthesis of Multifunctional Carbon Dots from Coriander Leaves and Their Potential Application as Antioxidants, Sensors and Bioimaging Agents. Analyst 2015, 140, 4260–4269. 10.1039/C5AN00454C. [DOI] [PubMed] [Google Scholar]
Associated Data
This section collects any data citations, data availability statements, or supplementary materials included in this article.