

Abstract
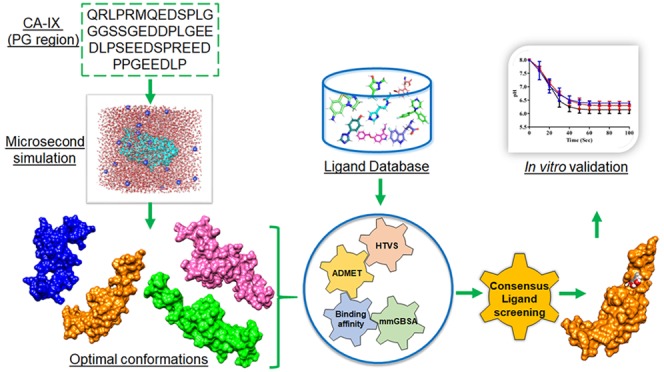
Carbonic anhydrase IX (CAIX) is a membrane-bound enzyme associated with tumor hypoxia and found to be over expressed in various tumor conditions. Targeting CAIX catalytic activity is proven to be efficient modality in modulating pH homeostasis in cancer cells. Proteoglycan-like (PG) region is unique to CAIX and is proposed to serve as an antenna enhancing the export of protons in conjunction with facilitated efflux of lactate ions via monocarboxylate transporters. Moreover, the PG region is also reported to contribute to the assembly and maturation of focal adhesion links during cellular attachment and dispersion on solid supports. Thus, drug targeting of this region shall efficiently modulate pH homeostasis and cell adhesion in cancer cells. As the PG region is intrinsically disordered, the complete crystal structure is not elucidated. Hence, in this study, we intend to sample the conformational landscape of the PG region at microsecond scale simulation in order to sample the most probable conformations that shall be utilized for structure-based drug design. In addition, the sampled conformations were subjected to high-throughput virtual screening against NCI and Maybridge datasets to identify potential hits based on consensus scoring and validation by molecular dynamics simulation. Further, the identified hits were experimentally validated for efficacy by in vitro and direct enzymatic assays. The results reveal 5-(2-aminoethyl)-1,2,3-benzenetriol to be the most promising hit as it showed significant CAIX inhibition at all levels of in silico and experimental validation.
Introduction
Carbonic anhydrase IX (CAIX) is a membrane-bound, zinc metalloenzyme with extracellular catalytic domain involved in catalyzing reversible hydration of carbon dioxide (CO2) to bicarbonate (HCO3–) and proton (H+) ions.1−4 The expression of CAIX is very much limited in normal tissues to gastric epithelium.1,5 However, its overexpression has been reported in various tumor conditions including breast,6 lung,7 cervix uteri,8,9 colon/rectum,10−12 oral cavity,13,14 gallbladder,15 ovary,16 liver,17 brain,18 and pancreas.19 Overexpression of CAIX in tumor cells favors cellular survival at an acidified extracellular environment as it modulates pH homeostasis and thereby promoting ATP synthesis, cell proliferation, and migration.1,2,20−24 Matured CAIX comprises four domains: an N-terminal proteoglycan-like domain (PG), catalytic domain (CA), transmembrane helical segment, and a short intracytoplasmic tail.25,26
The proteoglycan-like domain (38–112 residues) of CAIX is an intrinsically disordered region that spans the extracellular region of the cell.25−27 It gets the name as it shares significant similarity with the keratan sulfate attachment domain of aggrecan; however, no studies have shown the occurrence of glycosaminoglycan chains on the PG domain.25−27 The PG region has mainly been reported to be involved in cell–cell adhesion and facilitation of pH homeostasis.28−30 It also plays a significant role in tumor invasion.31 The expression of CAIX remains basal in most cells but shoots up in hypoxia-induced tumor cells.32 Moreover, this region does not occur in any other isoform. All these factors make the PG region a viable hotspot for specific targeting of cancer cells. As the PG region is intrinsically disordered, determining the complete 3D structure still remains as a challenge.
Intrinsically disordered proteins (IDPs) are a group of proteins that lack a well-defined structure but are biologically active and functional.33−38 IDPs are usually characterized by many specific features like low overall hydrophobicity, high net charge, and higher flexibility.33 Earlier studies have shown that 25–30% predicted eukaryotic proteins are partially disordered and 70% of the signaling proteins to harbor disordered regions.39,40 IDPs under controlled conditions show specific functions, which may complement ordered proteins and domains.33 In the absence of controlled conditions, these IDPs get involved in multiple roles manifested as various pathogenic conditions in humans.41,42
IDPs are usually very dynamic in nature and mostly have random coil conformations,43−45 and many of these IDPs have a good level of conformational propensities along their sequences.46−48 These unfolded regions can also act as a specific recognition site for target binding49,50 and also could interact with different partners to adopt distinct conformations.50,51 In general, X-ray crystallography methods are used to determine the protein structure in an atomic level; however, in the case of IDPs, the inherent higher flexibility makes the structure prediction more challenging. NMR studies do provide some insights into conformational changes in IDPs with higher limitations.52 Hence, molecular dynamics simulation methods becomes the preferred choice due to the vast availability of efficient algorithms and optimal force fields. Many of the earlier studies have clearly demonstrated the efficiency of MD methods in analyzing the conformational changes in IDPs.53,54 In the current scenario, molecular modeling, virtual screening, and molecular dynamics studies have become an integral part of computational drug designing.55−60
There is a paucity of studies providing structural insights into the CAIX proteoglycan region (IDP) compared to the catalytic site. Recent studies have also shown a monoclonal antibody M75 to selectively target an epitope at the proteoglycan region.61 There is an earlier study on peptides targeting the proteoglycan region based on phage display and biopanning.62 Moreover, our group has also shown oligopeptides derived from M75 antibody to be efficient inhibitors of CAIX in HeLa cells.63 As the proteoglycan-like region is unique to CAIX, it becomes essential to know about its conformational landscape for designing selective inhibitors targeting the tumor cells. Hence, in this study, in order to design chemical moieties targeting the PG-like region, we performed an extensive microsecond scale simulation of the complete PG-like region to sample the conformational landscape. Further, a consensus virtual screening and scoring of multiple conformations were performed to decipher the most potential and specific inhibitors from NCI and Maybridge databases targeting the PG-like region. Moreover, the identified inhibitor was validated for efficacy in modulating the CAIX activity in vitro. This study is first of its kind to propose chemical inhibitors targeting the PG-like region of CAIX.
Results and Discussion
Molecular Modeling of PG Domain Seed Structure
The most optimal structure of the PG domain as predicted by I-TASSER was chosen based on the significant C-score (−1.53) and was refined by the FG-MD tool. However, this refined structure showed only 39.6% of residues to be in the allowed region of the Ramachandran plot. Hence, this model was loop refined using modeller9v12 and was also optimized to remove the steric clashes within residues. Further, the loop-refined model was again geometry optimized using ModRefiner. In addition, the model was also refined using WHATIF program to remove atomic clashes (bumps) by rotating the side chain torsion angles (chi1, chi 2, and chi 3). The loop refinement, ModRefiner and WHATIF-based optimizations, were iteratively repeated until the most plausible seed structure was achieved. The final most optimal structure showed 94.3% residues in the favored region of the Ramachandran plot. Similarly, this structure also showed Verify 3D score of 82.3%, which is of allowed range for a plausible model. Additionally, WHATCHECK analysis was also performed to infer the stereochemical quality, wherein almost all the parameters ensured the plausibility and overall quality of predicted model. Further, this model was subjected to molecular dynamics simulation.
Microsecond Molecular Dynamics Simulation of PG Domain
As the net charge of the seed structure was calculated to be −23, therefore, 23 Na+ ions were added to neutralize the simulation system prior to initiation of microsecond scale production run. On trajectory analysis, the potential energy of the system was found to stabilize at around −4.98 × 10⁵ kJ/mol in 500 steps. The root-mean-square deviation (RMSD) plot across 1 ms time scale simulation inferred the system to undergo extensive conformational changes until 750 ns and tend to have minimal changes after 750 ns (Figure 1a). Further, the time-dependent radius of gyration plot (Rg) infers the overall compactness of the PG domain to be fluctuating till 750 ns and tends to lower after this time scale (Figure 1b); however, it did not tend to relax. Similarly, the root-mean-square fluctuation (RMSF) plot infers all the residues to be highly fluctuating (Figure 1c). Moreover, the time-dependent secondary structure element formation inferred the majority of residues to remain in coil formation throughout the simulation (Figure 1d). Also, this analysis infers a typical physiological behavior, as expected for a disordered protein.
Figure 1.

(a) RMSD plot showing the conformational changes of the protein till 1000 ns. (b) RMSF plot showing residue fluctuations for 1000 ns. (c) Gyration plot representing the level of compactness of the protein attained during the production run of 1000 ns. (d) Time-dependent secondary structure analysis, which shows the coil formation throughout simulation.
Principal Component Analysis (PCA) and Free Energy Landscape (FEL) Sampling
PCA analysis was performed to ensure higher conformational sampling efficiency. The projection generated for eigenvectors V1 and V2 showed the molecular movement to be in same direction with least cosine values. The PCA projection generated corresponding to eigenvalues were used to perform FEL analysis. Based on free energy landscaping, the coordinates in different clusters were analyzed to identify most optimal conformations. Here, 100 conformations per cluster (from four clusters) were chosen in accordance to the timeframe corresponding to the eigenvalue coordinates in FEL and were proceeded for further analysis (Figure 2).
Figure 2.

Four minimal energy clusters with representative structure from each cluster after FEL analysis.
Geometric Clustering
Additionally, geometric clustering was performed to identify a similar group of structures sampled during the MD simulation. A backbone RMSD cutoff of 1 Å was chosen to determine cluster membership. All clusters were mutually exclusive, so a structure can only be a member of a single cluster. The structure with the largest number of neighbors in each of the cluster was taken as the cluster representative. The geometric clustering yielded a total of 96,719 clusters with the highest of five conformations and the lowest of one conformation grouped to a single cluster (cutoff of 1 Å RMSD). Thus, a total 97,119 conformations of the PG region were obtained.
Fishing of the Most Minimal Conformation of the PG Domain with Crystallized Fragment as Bait
In PCA, eigenvalues were used to perform FEL analysis, by which the coordinates corresponding to the time interval with minimal energy were identified and proceeded for further analysis. In the case of geometric clustering, the Gromos method was used with a cutoff of 1 Å in order to identify the cluster membership. By this method, 96,719 clusters were identified, and the mid-average conformation from each cluster was sampled. These two approaches were implemented in order to sample varied conformations from the MD run, and this in turn shall aid in identifying the most approximate conformation of the PG domain. Further, the datasets resulting out of PCA and geometric clustering were used to fish the most optimal conformation with crystallized 9-mer fragment of the PG-like domain as bait using the Kpax tool. This resulted in a total of six conformations, which showed structural alignment with the crystallized fragment (<2.0 Å RMSD) (Figure 3). The entire conformational fishing protocol was automated through an in-house developed pipeline and has made it publicly available in GitHub (https://github.com/inpacdb/Kpax_automation_script).
Figure 3.

Top six conformations obtained after fishing of PG conformations from FEL and geometric clustering.
High-Throughput Virtual Screening (HTVS) of the Sampled PG Domain Conformations and Consensus Scoring
The optimized crystal fragment of PG epitope and six conformations obtained after fishing of minimal conformation were subjected to virtual screening versus NCI and Maybridge compounds (Table 1). The virtual screening results were compared to find the ligands that showed higher binding affinity across all the conformations in a consensus manner. The resultant topmost hit, namely, 5-(2-aminoethyl)-1,2,3-benzenetriol, based on its binding affinity and commercial availability was subjected to in silico ADMET predictions and was proceeded to validation by MD simulation and in vitro studies (Figure 4).
Table 1. Docking and Interaction Analysis of Ligand 5-(2-Aminoethyl)-1,2,3benzenetriol with Different PG Conformations (PCA-Based and Geometric Clustering).
| S. no. | conformation | XP-score (kcal/mol) | prime/MM-GBSA (kcal/mol) | PG domain interacting residues |
|---|---|---|---|---|
| 1 | PCA conformation 1 | –4.86 | –31.98 | Glu 75, Glu 86, Pro 84 |
| 2 | PCA conformation 2 | –5.70 | –35.22 | Glu 75, Gln 44 |
| 3 | PCA conformation 3 | –6.53 | –36.48 | Glu 87, Asp 88, Arg 73 |
| 4 | PCA conformation 4 | –5.60 | –30.94 | Asp 74, Asp 88 |
| 5 | PCA conformation 5 | –6.83 | –36.01 | Asp 88, Asp 70 |
| 6 | geometric clustering-based conformation | –6.38 | –40.87 | Glu 86, Glu 87, Leu 89 |
| 7 | crystal epitope | –4.10 | –21.90 | Glu 4, Glu 5, Leu 7 |
Figure 4.

2D interaction diagram of ligand 5-(2-aminoethyl)-1,2,3-benzenetriol with different PG conformations.
The topmost hit 5-(2-aminoethyl)-1,2,3-benzenetriol) showed hydrogen-bonded interactions at the epitope representing regions (LPGEEDLPG), though the docking was conducted in blind mode (without defining the active cavity). The optimal docked complex amongst the six conformations was found to be the component of geometric clustering with a significant docking score of −6.38 kcal/mol and a prime/MM-GBSA score of −40.87 kcal/mol. The compound showed hydrogen-bonded interactions with Glu 86, Leu 89, and Glu 87 of the epitope on the modeled conformation.
ADME Predictions and FAF-Drug 4 Profiling of the Top Hit
The identified top hit was subjected to in silico ADME predictions using Qikprop 3.5 (Schrödinger, LLC, New York, NY, 2012). The compound showed a molecular weight of 169.1 Daltons, volume of 594.5, SASA of 379, dipole of 3.4, hydrogen bond donor of 5, hydrogen bond receptor of 3, Q log BB of −1.14, PSA of 92, CNS of −2, Metab of 6, human oral absorption of 2, rule of 5 zero violation, and rule of 3 zero violation. It also showed significant physiochemical properties to be within the allowed range to be considered as a potential hit. Further, GSK 4/400 Rule (FAF-Drug 3) and Pfizer 3/75 Rule were also implemented to evaluate the drug safety profiling, wherein the compound was found to be fit with higher confidence (Figure 5).
Figure 5.

FAF-Drug 4 analysis result. (a) Physiochemical filter, the (5-(2-aminoethyl)-1,2,3-benzenetriol) properties (blue line) is within the range of the drug-like filter area (light blue). (b) 5-(2-Aminoethyl)-1,2,3-benzenetriol) (blue line) inferring a good confidence level in comparison with oral library minimum and maximum ranges (pink and red). (c) 5-(2-Aminoethyl)-1,2,3-benzenetriol) properties (blue line) falls within a higher confidence of RO5 and Veber rules (light green). (d) Compounds located in the red square are likely to cause toxicity and experimental promiscuity, wherein the 5-(2-aminoethyl)-1,2,3-benzenetriol) falls in the less toxic region.
Molecular Dynamics Simulation of Top Hit–PG Complex
Further, the protein–drug complex simulation was carried out for PG–Top hit complex for 1 ms was implemented using the GROMACS package with GROMOS 53a6 as a force field. On RMSD trajectory analysis, it could be inferred that the backbone atoms fluctuate (Figure 6a) in the holo form but remains in proximity to Apo form wherein the RMSD for the small molecule remained stable and was in complex with the PG domain with least perturbations (Figure 6b). Similarly, in the case of comparative analysis of the root-mean-square fluctuation (RMSF) plot with the Apo form, it could be inferred that the residues in the holo form is less fluctuating (Figure 6c) across 1 ms of production run. Moreover, the intermolecular hydrogen bond formation during the 1 ms simulation was analyzed, and the results infer that five hydrogen bonds remain unperturbed during the entire production run (Figure 6d). Further, the secondary structure analysis also inferred that there are not much changes incurred on post-binding of the ligand to the PG domain.
Figure 6.

(a) RMSD plot of Apo versus Holo PG domain showing the conformational changes of the protein till 1000 ns. (a) RMSD plot of a small molecule showing the stability in terms of contact with protein till 1000 ns. (c) RMSF plot showing residue fluctuations of Apo and Holo complex for 1000 ns. (d) Graph showing the total number of intermolecular H-bond interactions of the protein–ligand complex throughout the production run.
PCA analysis was also performed to ensure high sampling efficiency. The eigenvectors V1 and V2 were compared for the protein–ligand complex, and free energy landscape was also plotted based on PCA analysis. The coordinates for best clusters were identified, and the average structure corresponding to such coordinates at a particular time scale was proceeded for further analysis. The projection generated for eigenvectors V1 and V2 at the minimum energy value of 1.22 kJ/mol for the coordinate (0.4373,–0.1602) was chosen as the most optimal complex (Figure 7).
Figure 7.
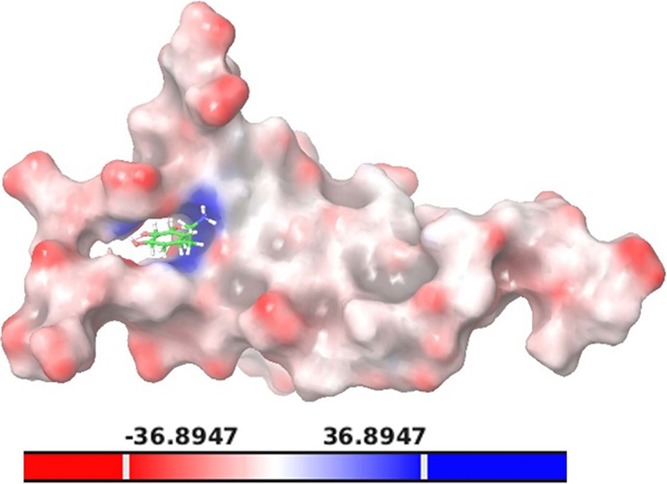
Surface representation of PG–Top hit complex. The ligand is shown in red, blue, and white, which indicates negative, positive, and neutral potential, respectively.
Cell Viability Assessment of Small Molecule Using Presto Blue
The identified top hit that showed higher binding affinity in inhibiting CAIX was further checked for the impact on cell viability in HeLa cells. The results infer a dose-dependent activity on increasing the concentration. The top hit (targeting PG domain) showed 52% of inhibition of viability at a concentration of 400 μM (Figure 8), and thus the IC50 was finalized as 400 μM/100 μL.
Figure 8.

HeLa cells showed 52% of viability when treated with 400 μM concentration of top hit for 48 h (Student’s t test was used for statistical analysis: *p < 0.05, **p < 0.01, ***p < 0.001 when compared with control).
Cell Lysate-Based CAIX Activity Assay To Validate Small Molecule
The CAIX activity on drug treatment was assayed functionally by recording the time course acidification of HeLa cell lysate following addition of saturated CO2 solution. The acidification time was also noted for control (untreated) and acetazolamide (AZM; a known inhibitor of CAIX) treated cells (identified drug) (Figure 9a). From the experiments performed, it was observed that NSC-298534 could reduce the acidification rate at 400 μM of concentration when compared to the untreated. Further, dose dependency was checked using 750 μM of concentration, which also inferred that the compound could reduce the acidification rate (Figure 9b). Further, statistical analysis was performed using ANOVA (repeated measures implementing Greenhouse–Geiser), which inferred that p value 0.5 > 0.05 is not statistically significant for 400 μM and 0.000 < 0.05 for 750 μM is statistically significant.
Figure 9.

Rate of acidification of cells lysate containing (a) CAIX (black) and reference drug AZM (blue) and (b) the presence of NSC-298534 (400 μM) (red) and the presence of NSC-298534 (750 μM) (green).
Cell Adhesion Assay in HeLa Cells on Treatment with Top Hit
On treatment of top hit (400 μM) to HeLa cells, the cell adhesion ratio was found to be significantly reduced than the control cells (Figure 10). The compound showed a reduction of 76% cells to be non-adherent at 400 μM, wherein the known drug AZM showed only 43% non-adherent cells.
Figure 10.

Cell adhesion in vitro inhibition of CAIX using NSC-298534 in HeLa cells (Student’s t test was used for statistical analysis: *p < 0.05, **p < 0.01, ***p < 0.001 when compared with control.
Direct Assay Using CO2 as a Substrate
The assay results infer top hit to decrease the specific activity of the CAIX enzyme with a WAU of 1.74, thereby inferring the CAIX inhibitory activity of the inhibitor (Table 2).
Table 2. Wilbur–Anderson Units (WAU) of CAIX Activity of Identified Small Molecule.
| S. no. | protein concentration (CAIX) (ng) | inhibitor | specific activity (U/ng) by WAU |
|---|---|---|---|
| 1 | 100 | Nil | 2.02 |
| 2 | 100 | NSC-298534 (400 μM) | 1.74 |
Conclusions
This study is the first of its kind to propose a sample of the conformational changes of the PG-like region in CAIX at microsecond scale simulation. Further, on trajectory analysis, six optimal conformations were sampled based on FEL and geometric clustering. Further, these conformations were subjected to HTVS, wherein, based on consensus scoring and binding pose analysis, the most potential hit and the most plausible conformation of the PG region were predicted. Further, this complex was cross-validated in terms of binding affinity at microsecond scale simulation. The results inferred the higher order of significance in terms of hydrogen-bonded interactions and stable protein–ligand contacts. The resultant topmost hit (5-(2-aminoethyl)-1,2,3-benzenetriol) was also experimentally validated in vitro to assess the impact of drug treatment on extracellular acidification rate and cell adhesion and on direct enzyme. The results infer that the proposed hit to be in effective in targeting CAIX activity at the cellular and at the direct enzyme levels. Thus, in this study, we propose a strategic approach to sample the optimal conformations of disordered proteins by coupling FEL and geometric clustering methods, which shall be adopted for other disordered proteins. Recently, targeting the PG-like region has been proposed to be a promising approach for modulating CAIX-mediated pH homeostasis in cancer cells. The ligand molecule proposed in this study shall pave way for future studies on lead optimization and in vivo validations.
Computational Methods and Experimental Section
Molecular Modeling of PG Domain for Starting Structure
As the 3D structure of the entire PG region is not yet crystallized, in this study, we intend to probe its conformational landscape at physiologically simulated conditions. To start with, the protein sequence of the PG region was BLASTP64 analyzed to identify suitable templates for homology modeling. As there were no significant hits, the starting structure of PG for MD simulation was modeled using the I-TASSER server65 and was refined by the FG-MD tool.66 Prior to simulation, the starting structure was also refined to fix the stereochemical errors using Modeller9v1267,68 and ModRefiner.69
Microsecond Molecular Dynamics Simulation of PG Domain
Further, to understand the conformational landscape of the modeled and refined structure of the PG-like region, MD simulation was performed using the Gromacs package.70 As the PG domain is highly disordered, extended MD simulation for 1 ms time scale was performed with GROMOS 53a6 as a force field,53 which is highly utilized for studying intrinsically disordered proteins due to it efficient handling of hydration states. To start with, the refined PG structure was used as seed conformation and placed in a cubic box with SPC water as a solvent. The protein was centered with a distance of 0.9 Å from the boundary of the box. Further, the system was neutralized by adding counterions. Following which, the system was stabilized in a step by step manner by cycles of steepest descent minimization. The coulombs and van der Waals contacts in the protein were restrained with maximum iterations of 1000 steps with cutoff values of 0.9 and 1.0 nm, respectively. Later, the system was equilibrated under the NVT and NPT ensemble using Leap-frog integrator for 100 ps simultaneously maintaining the Berendsen temperature coupling and Parrinello–Rahman pressure coupling for 300 K and 1 atm, respectively. A particle mesh Ewald method was implemented to calculate long-range electrostatic interactions using a grid size of 10 × 10 × 10 (grid spacing of 1.0 Å).70 Finally, the production run was performed for 1 ms time scale, and trajectories were analyzed for conformational landscape.71−73 The XMGRACE software was used for generating the plots from final trajectory (http://plasma-gate.weizmann.ac.il/Grace/).
Principal Component Analysis (PCA) and Free Energy Landscape (FEL) Sampling
PCA and FEL analysis were performed to ensure high sampling efficiency of the conformational landscape of the PG domain and also to extract the slow and functional motions of the PG domain.74 Initially, in order to calculate the PCA, covariance matrix C was plotted and the elements Cij in the matrix C is represented as follows:
Here, Xi and Xj are defined as the instant coordinates of the ith and jth atom, respectively, and the average coordinate of the ith and jth atom is defined by [Xi] and [Xj] ensembles, respectively. Further, diagonalization of the obtained covariance matrix C was performed. Subsequently, eigenvalues and vectors were determined for performing the PCA.74 In general, eigenvectors determine the direction of the motions, and the eigenvalues show the magnitude of the motions through the direction. Further, FEL analysis was performed to understand the conformational changes of the PG domain based on PCA obtained.75,76 Free energy ((ΔG(X)) is calculated by the equation as follows:
Here, KB is the Boltzmann constant, T is the absolute temperature, and P(X) is the probability distribution of the conformation ensemble along the principle components.75,76 Thus, based on the free energy values of the conformations, the stable and transient states of the PG domain were sampled.
Geometry-Based Clustering of PG Conformations
Similarly, geometric clustering was also performed to group ensembles of conformations sampled during MD simulation. An RMSD cutoff 1 Å was chosen to determine cluster membership. All clusters were mutually exclusive, so a structure can only be a member of a single cluster. The structure with the largest number of neighbors in each of the clusters is taken as the cluster representative.70,77
Fishing of Energy Minimal Conformation of the PG Domain
A database comprising 97,119 conformations was created from 400 conformers resulting from the best four PCA clusters (top 100 from each cluster) along with representative conformations of each cluster (96,719 conformers) from geometric clustering. Further, the crystallized PGEEDLPG epitope from M75 antibody in complex with the PG epitope (PDB ID 2HKF)61 was structurally superimposed to each conformer in the database created, and the RMSD was calculated using FAST protein structure alignment and database search tool named Kpax.78 An in-house developed shell script was utilized to develop a pipeline for iterative aligning of each conformer in the database with the epitope and to automate the reporting of RMSD scores. The optimal conformers were fished based on the structural closeness of epitope with the conformer scored in terms of least RMSD values. Further, these conformers were used for virtual screening and consensus scoring studies.
High-Throughput Virtual Screening (HTVS) of Multiple Conformers of the PG Domain
The optimized crystal complex (PG epitope) and six conformations obtained after fishing of optimal conformations were used to generate receptor grid using Glide79,80 ((grid-based ligand docking with energetics) Schrödinger, LLC, New York, NY, 2012)) so as to perform virtual screening of NCI (National Cancer Institute; https://cactus.nci.nih.gov/ncidb2.2) and Maybridge compounds (http://www.maybridge.com/). Initially, the ligands were prepared and filtered using standard methods (application of Lipinski rule of five and removal of reactive functional groups) using LigPrep (Schrödinger, LLC, New York, NY). Further, a high-throughput virtual screening (HTVS) protocol of Schrödinger suite was used for virtual screening and scoring of ligands.81−86
During the HTVS process, the van der Waals radius scaling was set to 1.0 Å to allow a free of scaling to soften the nonpolar regions of the receptor and rest of other atoms. Further, the geometry-optimized small molecules were successively docked to the receptor, ensuring a flexible sampling with not more than 300 atoms and 50 rotatable bonds.85,86 The final energy based favorable conformation was selected from 100 poses generated per docking and was finalized based on the docking score and H-bond score. During the screening process, successive elimination of ligand hits was performed through three filtering modes provided by Schrödinger suite: 50% of HTVS hits were passed to standard precision (SP), and 50% of the best hits from SP were passed to extra precision (XP) mode. This extensive sampling and advanced scoring will result in highly enriched hits.85,86 Finally, the top scoring ligands were (10%) chosen as best hits and subjected to prime MM/GBSA scoring and were in accordance to the score.85,86 This process was repeated for the PG epitope and for all the six sampled conformations. The ligands obtained for each conformation were cross-compared using in-house scripts to identify the ligand that is synonymous in terms of binding affinity with all the conformations and were proceeded for further ADMETox prediction, MD analysis, and experimental validation.
ADME Predictions and FAF-Drug 4 Profiling
The identified top hit ligand was subjected to in silico ADME predictions using Qikprop 3.5 (Schrödinger, LLC, New York, NY, 2012). The compound was also checked for significant physiochemical properties within the allowed range to be considered as a potential lead. Further, GSK 4/400 Rule (FAF-Drug 3) and Pfizer 3/75 Rule were also implemented to evaluate the drug safety profiling and toxicity,87 wherein the compound was found to be fit with higher confidence.85
Molecular Dynamics Simulation of Small-Molecule PG Complex
Further, the PG domain–drug complex that showed the most significant binding affinity in terms of docking score, prime MM/GBSA, and number of H-bonds was subjected to MD simulation53 for 1 ms adhering to a similar protocol as followed in the case of the Apo form.
Culturing of HeLa Cells for in Vitro Experiments
HeLa Cells (procured from NCCS, Pune) were cultured in DMEM high glucose medium supplemented with 10% fetal bovine serum (FBS) (Gibco, Invitrogen, India). Further, these cells were maintained in a 5% CO2 incubator at 37 °C till full confluency is attained and were further used for in vitro experiments.63 The top hit NSC-298534 (catalog #151564) and acetazolamide (catalog #A6011) were procured from Sigma.
Cell Viability Assay Using Presto Blue
The cells were seeded at a density of 5 × 10³ cells/well in a 96-well plate with 100 μL of culture media and incubated at 37 °C using a 5% CO2 incubator for 24 h. The cells were then treated with varying concentrations of the small molecule in fresh medium and incubated at 37 °C in a 5% CO2 incubator for 48 h.63,88 Cytotoxicity was tested by adding 10 μL of Presto Blue and measured at an excitation wavelength of 560 nm and an emission wavelength of 590 nm. Cell viability (or cell survival) was calculated as (test OD/control OD) × 100.63
CAIX Functional Assay in HeLa Cells
To perform this assay, intact HeLa cells were suspended in isotonic buffer (130 mM NaCl, 5 mM KCl, and 20 mM Hepes). Further, the pH of the isotonic buffer was adjusted to 8.0 at 4 °C before suspending cells. The cells in the buffer were then exposed to varying concentrations of the small molecule for 20 min at 37 °C.63 Further, 1.5 mL of the suspension was added to a stirred reaction vessel, and the pH change was monitored with a Hannah pH meter63,89 with respect to time after adding 0.5 mL of 100% CO2-saturated water. The rate of acidification was analyzed by plotting the pH change with respect to time in seconds.63,90−92
Direct Enzymatic Assay Using CO2 as a Substrate
CAIX direct activity assay procedure was adopted from a protocol described by Chirică et al.93 This assay is based on the monitoring of pH variation due to the catalytic conversion of CO2 to bicarbonate in the presence of the CAIX. Bromothymol blue was used as the indicator of pH variation. The assay was performed in an ice bath by adding 100 μL ice-cold CO2 saturated water to 100 μL mixtures of containing 25 mM Tris-SO4 with CAIX enzyme (cat. #10107-H08H) treated with small molecule.63 The catalytic activity was quantified in terms of the Wilbur–Anderson unit (WAU). One Wilbur–Anderson unit (WAU) of activity is defined as (T0 – T)/T, where T0 (non-enzymatic reaction) and T (enzymatic reaction) are recorded as the time (in seconds) required for the pH to drop from 8.3 to the transition point of the dye in control (buffer without enzyme) and in the presence of enzyme and and in drug co-treated conditions.63,94−96
Cell Adhesion Assay in HeLa Cells
HeLa cells at a density of 25 × 103 cells/well were pretreated with an inhibitor for 15 min before being plated onto a gelatin-coated 24-well plate and were incubated for 30 min at 37 °C. Further, 4% paraformaldehyde was used to fix the attached cells to the surface.63 A Nikon ECLIPSE TS2-Fl microscope was used to capture the microphotographs, and the number of attached cells was quantified using NIH Image J software. Based on these images, differential analysis was performed for treated and untreated conditions.63
Acknowledgments
Authors thank Viswanathan Natarajan - Biostatistician Vision Research Foundation, Sankara Nethralaya for helping with statistical analysis of the data. The work described in this article was supported by a research project grant from the Indian Council of Medical Research, New Delhi (project sanction order ICMR. no. BIC/12(7)/2012 and ICMR SRF grant fellowship ISRM/11(26)/2017).
The authors declare no competing financial interest.
References
- McDonald P. C.; Winum J.-Y.; Supuran C. T.; Dedhar S. Recent developments in targeting carbonic anhydrase IX for cancer therapeutics. Oncotarget 2012, 3, 84–97. 10.18632/oncotarget.422. [DOI] [PMC free article] [PubMed] [Google Scholar]
- Supuran C. T. Carbonic anhydrases: novel therapeutic applications for inhibitors and activators. Nat. Rev. Drug Discovery 2008, 7, 168–181. 10.1038/nrd2467. [DOI] [PubMed] [Google Scholar]
- Supuran C. T. Structure and function of carbonic anhydrases. Biochem. J. 2016, 473, 2023–2032. 10.1042/BCJ20160115. [DOI] [PubMed] [Google Scholar]
- Supuran C. T. Carbonic Anhydrases and Metabolism. Metabolites 2018, 8, 25. 10.3390/metabo8020025. [DOI] [PMC free article] [PubMed] [Google Scholar]
- Saarnio J.; Parkkila S.; Parkkila A. K.; Waheed A.; Casey M. C.; Zhou X. Y.; Pastoreková S.; Pastorek J.; Karttunen T.; Haukipuro K.; et al. Immunohistochemistry of carbonic anhydrase isozyme IX (MN/CA IX) in human gut reveals polarized expression in the epithelial cells with the highest proliferative capacity. J. Histochem. Cytochem. 1998, 46, 497–504. 10.1177/002215549804600409. [DOI] [PubMed] [Google Scholar]
- Tan E. Y.; Yan M.; Campo L.; Han C.; Takano E.; Turley H.; Candiloro I.; Pezzella F.; Gatter K. C.; Millar E. K. A.; et al. The key hypoxia regulated gene CAIX is upregulated in basal-like breast tumours and is associated with resistance to chemotherapy. Br. J. Cancer 2009, 100, 405–411. 10.1038/sj.bjc.6604844. [DOI] [PMC free article] [PubMed] [Google Scholar]
- İlie M.; Mazure N. M.; Hofman V.; Ammadi R. E.; Ortholan C.; Bonnetaud C.; Havet K.; Venissac N.; Mograbi B.; Mouroux J.; et al. High levels of carbonic anhydrase IX in tumour tissue and plasma are biomarkers of poor prognostic in patients with non-small cell lung cancer. Br. J. Cancer 2010, 102, 1627–1635. 10.1038/sj.bjc.6605690. [DOI] [PMC free article] [PubMed] [Google Scholar]
- Liao S.-Y.; Darcy K. M.; Randall L. M.; Tian C.; Monk B. J.; Burger R. A.; Fruehauf J. P.; Peters W. A.; Stock R. J.; Stanbridge E. J. Prognostic relevance of carbonic anhydrase-IX in high-risk, early-stage cervical cancer: a Gynecologic Oncology Group study. Gynecol. Oncol. 2010, 116, 452–458. 10.1016/j.ygyno.2009.10.062. [DOI] [PMC free article] [PubMed] [Google Scholar]
- Kirkpatrick J. P.; Rabbani Z. N.; Bentley R. C.; Hardee M. E.; Karol S.; Meyer J.; Oosterwijk E.; Havrilesky L.; Secord A. A.; Vujaskovic Z.; et al. Elevated CAIX Expression is Associated with an Increased Risk of Distant Failure in Early-Stage Cervical Cancer. Biomarker Insights 2008, 3, 45–55. 10.4137/bmi.s570. [DOI] [PMC free article] [PubMed] [Google Scholar]
- Debucquoy A.; Goethals L.; Libbrecht L.; Perneel C.; Geboes K.; Ectors N.; McBride W. H.; Haustermans K. Molecular and clinico-pathological markers in rectal cancer: a tissue micro-array study. Int. J. Colorectal Dis. 2009, 24, 129–138. 10.1007/s00384-008-0608-8. [DOI] [PMC free article] [PubMed] [Google Scholar]
- Korkeila E.; Talvinen K.; Jaakkola P. M.; Minn H.; Syrjänen K.; Sundström J.; Pyrhönen S. Expression of carbonic anhydrase IX suggests poor outcome in rectal cancer. Br. J. Cancer 2009, 100, 874–880. 10.1038/sj.bjc.6604949. [DOI] [PMC free article] [PubMed] [Google Scholar]
- Saarnio J.; Parkkila S.; Parkkila A.-K.; Haukipuro K.; Pastoreková S.; Pastorek J.; Kairaluoma M. I.; Karttunen T. J. Immunohistochemical Study of Colorectal Tumors for Expression of a Novel Transmembrane Carbonic Anhydrase, MN/CA IX, with Potential Value as a Marker of Cell Proliferation. Am. J. Pathol. 1998, 153, 279–285. 10.1016/S0002-9440(10)65569-1. [DOI] [PMC free article] [PubMed] [Google Scholar]
- Yang J.-S.; Lin C.-W.; Hsieh Y.-H.; Chien M.-H.; Chuang C.-Y.; Yang S.-F. Overexpression of carbonic anhydrase IX induces cell motility by activating matrix metalloproteinase-9 in human oral squamous cell carcinoma cells. Oncotarget 2017, 8, 83088–83099. 10.18632/oncotarget.20236. [DOI] [PMC free article] [PubMed] [Google Scholar]
- Yang J.-S.; Lin C.-W.; Chuang C.-Y.; Su S.-C.; Lin S.-H.; Yang S.-F. Carbonic anhydrase IX overexpression regulates the migration and progression in oral squamous cell carcinoma. Tumor Biol. 2015, 36, 9517–9524. 10.1007/s13277-015-3692-8. [DOI] [PubMed] [Google Scholar]
- Klatte T.; Seligson D. B.; Rao J. Y.; Yu H.; de Martino M.; Kawaoka K.; Wong S. G.; Belldegrun A. S.; Pantuck A. J. Carbonic anhydrase IX in bladder cancer: a diagnostic, prognostic, and therapeutic molecular marker. Cancer 2009, 115, 1448–1458. 10.1002/cncr.24163. [DOI] [PubMed] [Google Scholar]
- Woelber L.; Mueller V.; Eulenburg C.; Schwarz J.; Carney W.; Jaenicke F.; Milde-Langosch K.; Mahner S. Serum carbonic anhydrase IX during first-line therapy of ovarian cancer. Gynecol. Oncol. 2010, 117, 183–188. 10.1016/j.ygyno.2009.11.029. [DOI] [PubMed] [Google Scholar]
- Finkelmeier F.; Canli Ö.; Peiffer K.-H.; Walter D.; Tal A.; Koch C.; Pession U.; Vermehren J.; Trojan J.; Zeuzem S.; et al. Circulating hypoxia marker carbonic anhydrase IX (CA9) in patients with hepatocellular carcinoma and patients with cirrhosis. PLoS One 2018, 13, e0200855 10.1371/journal.pone.0200855. [DOI] [PMC free article] [PubMed] [Google Scholar]
- Said H. M.; Supuran C. T.; Hageman C.; Staab A.; Polat B.; Katzer A.; Scozzafava A.; Anacker J.; Flentje M.; Vordermark D. Modulation of carbonic anhydrase 9 (CA9) in human brain cancer. Curr. Pharm. Des. 2010, 16, 3288–3299. 10.2174/138161210793429788. [DOI] [PubMed] [Google Scholar]
- McDonald P. C.; Chafe S. C.; Brown W. S.; Saberi S.; Swayampakula M.; Venkateswaran G.; Nemirovsky O.; Gillespie J. A.; Karasinska J. M.; Kalloger S. E.; et al. Regulation of pH by Carbonic Anhydrase 9 Mediates Survival of Pancreatic Cancer Cells With Activated KRAS in Response to Hypoxia. Gastroenterology 2019, 157, 823–837. 10.1053/j.gastro.2019.05.004. [DOI] [PubMed] [Google Scholar]
- Gatenby R. A.; Gillies R. J. A microenvironmental model of carcinogenesis. Nat. Rev. Cancer 2008, 8, 56–61. 10.1038/nrc2255. [DOI] [PubMed] [Google Scholar]
- Fang J. S.; Gillies R. D.; Gatenby R. A. Adaptation to hypoxia and acidosis in carcinogenesis and tumor progression. Semin. Cancer Biol. 2008, 18, 330–337. 10.1016/j.semcancer.2008.03.011. [DOI] [PMC free article] [PubMed] [Google Scholar]
- Parks S. K.; Chiche J.; Pouyssegur J. pH control mechanisms of tumor survival and growth. J. Cell. Physiol. 2011, 226, 299–308. 10.1002/jcp.22400. [DOI] [PubMed] [Google Scholar]
- Neri D.; Supuran C. T. Interfering with pH regulation in tumours as a therapeutic strategy. Nat. Rev. Drug Discovery 2011, 10, 767–777. 10.1038/nrd3554. [DOI] [PubMed] [Google Scholar]
- Swietach P. What is pH regulation, and why do cancer cells need it?. Cancer Metastasis Rev. 2019, 38, 5–15. 10.1007/s10555-018-09778-x. [DOI] [PMC free article] [PubMed] [Google Scholar]
- Hilvo M.; Baranauskiene L.; Salzano A. M.; Scaloni A.; Matulis D.; Innocenti A.; Scozzafava A.; Monti S. M.; Di Fiore A.; De Simone G.; et al. Biochemical characterization of CA IX, one of the most active carbonic anhydrase isozymes. J. Biol. Chem. 2008, 283, 27799–27809. 10.1074/jbc.M800938200. [DOI] [PubMed] [Google Scholar]
- Opavský R.; Pastoreková S.; Zelník V.; Gibadulinová A.; Stanbridge E. J.; Závada J.; Kettmann R.; Pastorek J. Human MN/CA9 gene, a novel member of the carbonic anhydrase family: structure and exon to protein domain relationships. Genomics 1996, 33, 480–487. 10.1006/geno.1996.0223. [DOI] [PubMed] [Google Scholar]
- Pastorek J.; Pastoreková S.; Callebaut I.; Mornon J. P.; Zelník V.; Opavský R.; Zat’ovicová M.; Liao S.; Portetelle D.; Stanbridge E. J. Cloning and characterization of MN, a human tumor-associated protein with a domain homologous to carbonic anhydrase and a putative helix-loop-helix DNA binding segment. Oncogene 1994, 9, 2877–2888. [PubMed] [Google Scholar]
- de Simone G.; Supuran C. T. Carbonic anhydrase IX: Biochemical and crystallographic characterization of a novel antitumor target. Biochim. Biophys. Acta 2010, 1804, 404–409. 10.1016/j.bbapap.2009.07.027. [DOI] [PubMed] [Google Scholar]
- Švastová E.; Žilka N.; Zat’ovičová M.; Gibadulinová A.; Čiampor F.; Pastorek J.; Pastoreková S. Carbonic anhydrase IX reduces E-cadherin-mediated adhesion of MDCK cells via interaction with β-catenin. Exp. Cell Res. 2003, 290, 332–345. 10.1016/S0014-4827(03)00351-3. [DOI] [PubMed] [Google Scholar]
- Csaderova L.; Debreova M.; Radvak P.; Stano M.; Vrestiakova M.; Kopacek J.; Pastorekova S.; Svastova E. The effect of carbonic anhydrase IX on focal contacts during cell spreading and migration. Front. Physiol. 2013, 4, 271. 10.3389/fphys.2013.00271. [DOI] [PMC free article] [PubMed] [Google Scholar]
- Rohani N.; Hao L.; Alexis M. S.; Joughin B. A.; Krismer K.; Moufarrej M. N.; Soltis A. R.; Lauffenburger D. A.; Yaffe M. B.; Burge C. B.; et al. Acidification of Tumor at Stromal Boundaries Drives Transcriptome Alterations Associated with Aggressive Phenotypes. Cancer Res. 2019, 79, 1952–1966. 10.1158/0008-5472.CAN-18-1604. [DOI] [PMC free article] [PubMed] [Google Scholar]
- Závada J.; Závadová Z.; Pastoreková S.; Čiampor F.; Pastorek J.; Zelník V. Expression of MaTu-MN protein in human tumor cultures and in clinical specimens. Int. J. Cancer 1993, 54, 268–274. 10.1002/ijc.2910540218. [DOI] [PubMed] [Google Scholar]
- Uversky V. N. A decade and a half of protein intrinsic disorder: biology still waits for physics. Protein Sci. 2013, 22, 693–724. 10.1002/pro.2261. [DOI] [PMC free article] [PubMed] [Google Scholar]
- Dunker A. K.; Garner E.; Guilliot S.; Romero P.; Albrecht K.; Hart J.; Obradovic Z.; Kissinger C.; Villafranca J. E. Protein disorder and the evolution of molecular recognition: theory, predictions and observations. Pac. Symp. Biocomput. 1998, 473–484. [PubMed] [Google Scholar]
- Wright P. E.; Dyson H. J. Intrinsically unstructured proteins: re-assessing the protein structure-function paradigm. J. Mol. Biol. 1999, 293, 321–331. 10.1006/jmbi.1999.3110. [DOI] [PubMed] [Google Scholar]
- Dunker A. K.; Lawson J. D.; Brown C. J.; Williams R. M.; Romero P.; Oh J. S.; Oldfield C. J.; Campen A. M.; Ratliff C. M.; Hipps K. W.; et al. Intrinsically disordered protein. J. Mol. Graphics Modell. 2001, 19, 26–59. 10.1016/S1093-3263(00)00138-8. [DOI] [PubMed] [Google Scholar]
- Dyson H. J.; Wright P. E. Intrinsically unstructured proteins and their functions. Nat. Rev. Mol. Cell Biol. 2005, 6, 197–208. 10.1038/nrm1589. [DOI] [PubMed] [Google Scholar]
- Uversky V. N. Natively unfolded proteins: a point where biology waits for physics. Protein Sci. 2002, 11, 739–756. 10.1110/ps.4210102. [DOI] [PMC free article] [PubMed] [Google Scholar]
- Dunker A. K.; Obradovic Z.; Romero P.; Garner E. C.; Brown C. J. Intrinsic protein disorder in complete genomes. Genome Inf. 2000, 11, 161–171. [PubMed] [Google Scholar]
- Oldfield C. J.; Cheng Y.; Cortese M. S.; Brown C. J.; Uversky V. N.; Dunker A. K. Comparing and combining predictors of mostly disordered proteins. Biochemistry 2005, 44, 1989–2000. 10.1021/bi047993o. [DOI] [PubMed] [Google Scholar]
- Bellotti V.; Mangione P.; Stoppini M. Biological activity and pathological implications of misfolded proteins. Cell. Mol. Life Sci. 1999, 55, 977–991. 10.1007/s000180050348. [DOI] [PMC free article] [PubMed] [Google Scholar]
- Dobson C. M. Protein misfolding, evolution and disease. Trends Biochem. Sci. 1999, 24, 329–332. 10.1016/S0968-0004(99)01445-0. [DOI] [PubMed] [Google Scholar]
- Shortle D.; Ackerman M. S. Persistence of native-like topology in a denatured protein in 8 M urea. Science 2001, 293, 487–489. 10.1126/science.1060438. [DOI] [PubMed] [Google Scholar]
- Choy W. Y.; Forman-Kay J. D. Calculation of ensembles of structures representing the unfolded state of an SH3 domain. J. Mol. Biol. 2001, 308, 1011–1032. 10.1006/jmbi.2001.4750. [DOI] [PubMed] [Google Scholar]
- Gall C.; Xu H.; Brickenden A.; Ai X.; Choy W. Y. The intrinsically disordered TC-1 interacts with Chibby via regions with high helical propensity. Protein Sci. 2007, 16, 2510–2518. 10.1110/ps.073062707. [DOI] [PMC free article] [PubMed] [Google Scholar]
- Baker J. M. R.; Hudson R. P.; Kanelis V.; Choy W.-Y.; Thibodeau P. H.; Thomas P. J.; Forman-Kay J. D. CFTR regulatory region interacts with NBD1 predominantly via multiple transient helices. Nat. Struct. Mol. Biol. 2007, 14, 738–745. 10.1038/nsmb1278. [DOI] [PMC free article] [PubMed] [Google Scholar]
- Fuxreiter M.; Simon I.; Friedrich P.; Tompa P. Preformed structural elements feature in partner recognition by intrinsically unstructured proteins. J. Mol. Biol. 2004, 338, 1015–1026. 10.1016/j.jmb.2004.03.017. [DOI] [PubMed] [Google Scholar]
- Eliezer D.; Kutluay E.; Bussell R. Jr.; Browne G. Conformational properties of alpha-synuclein in its free and lipid-associated states. J. Mol. Biol. 2001, 307, 1061–1073. 10.1006/jmbi.2001.4538. [DOI] [PubMed] [Google Scholar]
- Vacic V.; Oldfield C. J.; Mohan A.; Radivojac P.; Cortese M. S.; Uversky V. N.; Dunker A. K. Characterization of molecular recognition features, MoRFs, and their binding partners. J. Proteome Res. 2007, 6, 2351–2366. 10.1021/pr0701411. [DOI] [PMC free article] [PubMed] [Google Scholar]
- Dunker A. K.; Cortese M. S.; Romero P.; Iakoucheva L. M.; Uversky V. N. Flexible nets. The roles of intrinsic disorder in protein interaction networks. FEBS J. 2005, 272, 5129–5148. 10.1111/j.1742-4658.2005.04948.x. [DOI] [PubMed] [Google Scholar]
- Oldfield C. J.; Meng J.; Yang J. Y.; Yang M. Q.; Uversky V. N.; Dunker A. K. Flexible nets: disorder and induced fit in the associations of p53 and 14-3-3 with their partners. BMC Genomics 2008, 9, S1. 10.1186/1471-2164-9-S1-S1. [DOI] [PMC free article] [PubMed] [Google Scholar]
- Yee A. A.; Savchenko A.; Ignachenko A.; Lukin J.; Xu X.; Skarina T.; Evdokimova E.; Liu C. S.; Semesi A.; Guido V.; et al. NMR and X-ray crystallography, complementary tools in structural proteomics of small proteins. J. Am. Chem. Soc. 2005, 127, 16512–16517. 10.1021/ja053565+. [DOI] [PubMed] [Google Scholar]
- Cino E. A.; Wong-ekkabut J.; Karttunen M.; Choy W.-Y. Microsecond molecular dynamics simulations of intrinsically disordered proteins involved in the oxidative stress response. PLoS One 2011, 6, e27371 10.1371/journal.pone.0027371. [DOI] [PMC free article] [PubMed] [Google Scholar]
- Henriques J.; Cragnell C.; Skepö M. Molecular Dynamics Simulations of Intrinsically Disordered Proteins: Force Field Evaluation and Comparison with Experiment. J. Chem. Theory Comput. 2015, 11, 3420–3431. 10.1021/ct501178z. [DOI] [PubMed] [Google Scholar]
- Rajendran V. Structural analysis of oncogenic mutation of isocitrate dehydrogenase 1. Mol. BioSyst. 2016, 12, 2276–2287. 10.1039/C6MB00182C. [DOI] [PubMed] [Google Scholar]
- Tanwar G.; Purohit R. Gain of native conformation of Aurora A S155R mutant by small molecules. J. Cell. Biochem. 2019, 11104. 10.1002/jcb.28387. [DOI] [PubMed] [Google Scholar]
- Sharma J.; Bhardwaj V.; Purohit R. Structural Perturbations due to Mutation (H1047R) in Phosphoinositide-3-kinase (PI3Kα) and Its Involvement in Oncogenesis: An in Silico Insight. ACS Omega 2019, 4, 15815–15823. 10.1021/acsomega.9b01439. [DOI] [PMC free article] [PubMed] [Google Scholar]
- Bhardwaj V.; Purohit R. Computational investigation on effect of mutations in PCNA resulting in structural perturbations and inhibition of mismatch repair pathway. J. Biomol. Struct. Dyn. 2019, 1–12. 10.1080/07391102.2019.1621210. [DOI] [PubMed] [Google Scholar]
- Singh R.; Bhardwaj V.; Das P.; Purohit R. Natural analogues inhibiting selective cyclin-dependent kinase protein isoforms: a computational perspective. J. Biomol. Struct. Dyn. 2019, 1–10. 10.1080/07391102.2019.1696709. [DOI] [PubMed] [Google Scholar]
- Bhardwaj V.; Singh R.; Singh P.; Purohit R.; Kumar S. Elimination of bitter-off taste of stevioside through structure modification and computational interventions. J. Theor. Biol. 2020, 486, 110094. 10.1016/j.jtbi.2019.110094. [DOI] [PubMed] [Google Scholar]
- Král V.; Mader P.; Collard R.; Fábry M.; Horejsí M.; Rezácová P.; Kozísek M.; Závada J.; Sedlácek J.; Rulísek L.; et al. Stabilization of antibody structure upon association to a human carbonic anhydrase IX epitope studied by X-ray crystallography, microcalorimetry, and molecular dynamics simulations. Proteins 2008, 71, 1275–1287. 10.1002/prot.21821. [DOI] [PubMed] [Google Scholar]
- Rana S.; Nissen F.; Lindner T.; Altmann A.; Mier W.; Debus J.; Haberkorn U.; Askoxylakis V. Screening of a novel peptide targeting the proteoglycan-like region of human carbonic anhydrase IX. Molecular imaging 2013, 12, 7290. 10.2310/7290.2013.00066. [DOI] [PubMed] [Google Scholar]
- John A.; Sivashanmugam M.; Natarajan S. K.; Umashankar V. Computational modeling of novel inhibitory peptides targeting proteoglycan like region of carbonic anhydrase IX and in vitro validation in HeLa cells. J. Biomol. Struct. Dyn 2019, 1–12. 10.1080/07391102.2019.1623075. [DOI] [PubMed] [Google Scholar]
- Altschul S. F.; Gish W.; Miller W.; Myers E. W.; Lipman D. J. Basic local alignment search tool. J. Mol. Biol. 1990, 215, 403–410. 10.1016/S0022-2836(05)80360-2. [DOI] [PubMed] [Google Scholar]
- Roy A.; Kucukural A.; Zhang Y. I-TASSER: a unified platform for automated protein structure and function prediction. Nat. Protoc. 2010, 5, 725–738. 10.1038/nprot.2010.5. [DOI] [PMC free article] [PubMed] [Google Scholar]
- Zhang J.; Liang Y.; Zhang Y. Atomic-level protein structure refinement using fragment-guided molecular dynamics conformation sampling. Structure 2011, 1784–1795. 10.1016/j.str.2011.09.022. [DOI] [PMC free article] [PubMed] [Google Scholar]
- Fiser A.; Do R. K. G.; Šali A. Modeling of loops in protein structures. Protein Sci. 2000, 9, 1753–1773. 10.1110/ps.9.9.1753. [DOI] [PMC free article] [PubMed] [Google Scholar]
- Šali A.; Blundell T. L. Comparative protein modelling by satisfaction of spatial restraints. J. Mol. Biol. 1993, 234, 779–815. 10.1006/jmbi.1993.1626. [DOI] [PubMed] [Google Scholar]
- Xu D.; Zhang Y. Improving the physical realism and structural accuracy of protein models by a two-step atomic-level energy minimization. Biophys. J. 2011, 101, 2525–2534. 10.1016/j.bpj.2011.10.024. [DOI] [PMC free article] [PubMed] [Google Scholar]
- Berendsen H. J. C.; van der Spoel D.; van Drunen R. GROMACS: A message-passing parallel molecular dynamics implementation. Comput. Phys. Commun. 1995, 91, 43–56. 10.1016/0010-4655(95)00042-E. [DOI] [Google Scholar]
- Vetrivel U.; Nagarajan H. Deciphering ophthalmic adaptive inhibitors targeting RON4 of Toxoplasma gondii: An integrative in silico approach. Life Sci. 2018, 213, 82–93. 10.1016/j.lfs.2018.10.022. [DOI] [PubMed] [Google Scholar]
- Nagarajan H.; Vetrivel U. Demystifying the pH dependent conformational changes of human heparanase pertaining to structure-function relationships: an in silico approach. J. Comput.-Aided Mol. Des. 2018, 32, 821–840. 10.1007/s10822-018-0131-0. [DOI] [PubMed] [Google Scholar]
- Vetrivel U.; Nagarajan H.; Thirumudi I. Design of inhibitory peptide targeting Toxoplasma gondii RON4-human β-tubulin interactions by implementing structural bioinformatics methods. J. Cell. Biochem. 2018, 119, 3236–3246. 10.1002/jcb.26480. [DOI] [PubMed] [Google Scholar]
- Bahar I.; Atilgan A. R.; Demirel M. C.; Erman B. Vibrational Dynamics of Folded Proteins: Significance of Slow and Fast Motions in Relation to Function and Stability. Phys. Rev. Lett. 1998, 80, 2733–2736. 10.1103/PhysRevLett.80.2733. [DOI] [Google Scholar]
- Piao L.; Chen Z.; Li Q.; Liu R.; Song W.; Kong R.; Chang S. Molecular Dynamics Simulations of Wild Type and Mutants of SAPAP in Complexed with Shank3. Int. J. Mol. Sci. 2019, 20, 224. 10.3390/ijms20010224. [DOI] [PMC free article] [PubMed] [Google Scholar]
- Maisuradze G. G.; Liwo A.; Scheraga H. A. Relation between free energy landscapes of proteins and dynamics. J. Chem. Theory Comput. 2010, 6, 583–595. 10.1021/ct9005745. [DOI] [PMC free article] [PubMed] [Google Scholar]
- Daura X.; Gademann K.; Jaun B.; Seebach D.; van Gunsteren W. F.; Mark A. E. Peptide Folding: When Simulation Meets Experiment. Angew. Chem., Int. Ed. 1999, 38, 236–240. . [DOI] [Google Scholar]
- Ritchie D. W.; Ghoorah A. W.; Mavridis L.; Venkatraman V. Fast protein structure alignment using Gaussian overlap scoring of backbone peptide fragment similarity. Bioinformatics 2012, 28, 3274–3281. 10.1093/bioinformatics/bts618. [DOI] [PubMed] [Google Scholar]
- Friesner R. A.; Banks J. L.; Murphy R. B.; Halgren T. A.; Klicic J. J.; Mainz D. T.; Repasky M. P.; Knoll E. H.; Shelley M.; Perry J. K.; et al. Glide: a new approach for rapid, accurate docking and scoring. 1. Method and assessment of docking accuracy. J. Med. Chem. 2004, 47, 1739–1749. 10.1021/jm0306430. [DOI] [PubMed] [Google Scholar]
- Friesner R. A.; Murphy R. B.; Repasky M. P.; Frye L. L.; Greenwood J. R.; Halgren T. A.; Sanschagrin P. C.; Mainz D. T. Extra precision glide: docking and scoring incorporating a model of hydrophobic enclosure for protein-ligand complexes. J. Med. Chem. 2006, 49, 6177–6196. 10.1021/jm051256o. [DOI] [PubMed] [Google Scholar]
- Umashankar V.; Gurunathan S.. In Silico Tools for Molecular Modeling. In General, Applied and Systems Toxicology; Ballantyne B., Marrs T. C., Syversen T., Casciano D. A., Sahu S. C., Eds.; John Wiley & Sons, Ltd: Chichester, UK, 2009; p 83. [Google Scholar]
- Umashankar V.; Gurunathan S.. Chemoinformatics and its Applications. In General, Applied and Systems Toxicology; Ballantyne B., Marrs T. C., Syversen T., Casciano D. A., Sahu S. C., Eds.; John Wiley & Sons, Ltd: Chichester, UK, 2009; p 1. [Google Scholar]
- Sadhasivam A.; Vetrivel U. Identification of potential drugs targeting L,L-diaminopimelate aminotransferase of Chlamydia trachomatis: An integrative pharmacoinformatics approach. J. Cell. Biochem. 2019, 120, 2271. 10.1002/jcb.27553. [DOI] [PubMed] [Google Scholar]
- Sadhasivam A.; Nagarajan H.; Umashankar V. Structure-based drug target prioritisation and rational drug design for targeting Chlamydia trachomatis eye infections. J. Biomol. Struct. Dyn 2019, 1–13. 10.1080/07391102.2019.1652691. [DOI] [PubMed] [Google Scholar]
- John A.; Sivashanmugam M.; Umashankar V.; Natarajan S. K. Virtual screening, molecular dynamics, and binding free energy calculations on human carbonic anhydrase IX catalytic domain for deciphering potential leads. J. Biomol. Struct. Dyn. 2017, 35, 2155–2168. 10.1080/07391102.2016.1207565. [DOI] [PubMed] [Google Scholar]
- John A.; Vetrivel U.; Subramanian K.; Deepa P. R. Comparative docking of dual conformations in human fatty acid synthase thioesterase domain reveals potential binding cavity for virtual screening of ligands. J. Biomol. Struct. Dyn. 2017, 35, 1350–1366. 10.1080/07391102.2016.1184183. [DOI] [PubMed] [Google Scholar]
- Lagorce D.; Sperandio O.; Baell J. B.; Miteva M. A.; Villoutreix B. O. FAF-Drugs3: a web server for compound property calculation and chemical library design. Nucleic Acids Res. 2015, 43, W200–W207. 10.1093/nar/gkv353. [DOI] [PMC free article] [PubMed] [Google Scholar]
- Cianchi F.; Vinci M. C.; Supuran C. T.; Peruzzi B.; de Giuli P.; Fasolis G.; Perigli G.; Pastorekova S.; Papucci L.; Pini A.; et al. Selective inhibition of carbonic anhydrase IX decreases cell proliferation and induces ceramide-mediated apoptosis in human cancer cells. J. Pharmacol. Exp. Ther. 2010, 334, 710–719. 10.1124/jpet.110.167270. [DOI] [PubMed] [Google Scholar]
- Mazzio E. A.; Smith B.; Soliman K. F. A. Evaluation of endogenous acidic metabolic products associated with carbohydrate metabolism in tumor cells. Cell Biol. Toxicol. 2010, 26, 177–188. 10.1007/s10565-009-9138-6. [DOI] [PMC free article] [PubMed] [Google Scholar]
- Swietach P.; Wigfield S.; Cobden P.; Supuran C. T.; Harris A. L.; Vaughan-Jones R. D. Tumor-associated carbonic anhydrase 9 spatially coordinates intracellular pH in three-dimensional multicellular growths. J. Biol. Chem. 2008, 283, 20473–20483. 10.1074/jbc.M801330200. [DOI] [PubMed] [Google Scholar]
- van den Beucken T.; Ramaekers C. H. M. A.; Rouschop K.; Koritzinsky M.; Wouters B. G. Deficient carbonic anhydrase 9 expression in UPR-impaired cells is associated with reduced survival in an acidic microenvironment. Radiother. Oncol. 2009, 92, 437–442. 10.1016/j.radonc.2009.06.018. [DOI] [PubMed] [Google Scholar]
- Dubois L.; Peeters S.; Lieuwes N. G.; Geusens N.; Thiry A.; Wigfield S.; Carta F.; McIntyre A.; Scozzafava A.; Dogné J.-M.; et al. Specific inhibition of carbonic anhydrase IX activity enhances the in vivo therapeutic effect of tumor irradiation. Radiother. Oncol. 2011, 99, 424–431. 10.1016/j.radonc.2011.05.045. [DOI] [PubMed] [Google Scholar]
- Chirică L. C.; Elleby B.; Jonsson B.-H.; Lindskog S. The complete sequence, expression in Escherichia coli, purification and some properties of carbonic anhydrase from Neisseria gonorrhoeae. Eur. J. Biochem. 1997, 244, 755–760. 10.1111/j.1432-1033.1997.00755.x. [DOI] [PubMed] [Google Scholar]
- Capasso C.; de Luca V.; Carginale V.; Cannio R.; Rossi M. Biochemical properties of a novel and highly thermostable bacterial α-carbonic anhydrase from Sulfurihydrogenibium yellowstonense YO3AOP1. J. Enzyme Inhib. Med. Chem. 2012, 27, 892–897. 10.3109/14756366.2012.703185. [DOI] [PubMed] [Google Scholar]
- Wilbur K. M.; Anderson N. G. Electrometric and colorimetric determination of carbonic anhydrase. J. Biol. Chem. 1948, 176, 147–154. [PubMed] [Google Scholar]
- Adem S.; Akkemik E.; Aksit H.; Guller P.; Tüfekci A. R.; Demirtas İ.; Ciftci M. Activation and inhibition effects of some natural products on human cytosolic CAI and CAII. Med. Chem. Res. 2019, 28, 711–722. 10.1007/s00044-019-02329-1. [DOI] [Google Scholar]