

Abstract
Biological membranes provide the medium through which membrane proteins move and function. It has become increasingly evident that direct interactions of membrane proteins with their surrounding lipids play key roles in regulating both protein conformations and function. However, the exact nature and structural consequences of these interactions remains difficult to track at molecular level. Here we present a protocol that addresses specifically this challenge. First, hydrogen-deuterium exchange mass spectrometry (HDX-MS) in nanodiscs of controlled lipid composition provides information on which species is involved in modulating the conformational changes in the membrane protein. Then molecular dynamics (MD) simulations in lipid bilayers pinpoint likely interaction candidates, which can then be tested experimentally using HDX-MS. By bringing together the MD predictions with the conformational readouts from HDX-MS, we uncover key lipid-proteins interactions implicated in stabilizing important functional conformations. This protocol can be applied to virtually any integral membrane protein.
Introduction
Membrane proteins represent more than half of known drug targets; yet the molecular mechanisms underlying their mode of action are poorly understood. Most membrane proteins are highly dynamic and undergo important structural rearrangements to execute their exquisite function. Such conformational changes are occurring within the lipid bilayer that forms the core of the biological membrane. It has become increasingly clear that the lipids are not passive bystanders in this process: direct lipid-protein interactions modulate transitions between different conformations1–3. Capturing these interactions and understanding how they influence structural changes at a molecular level is of great interest. Accurate structural models that include dynamic information in a native environment are required to rationally design molecules capable of modulating the activity of therapeutic targets4.
Recent advances in biophysical characterization of membrane protein have highlighted both the existence and importance of lipid-protein interactions for function5, structure6, stability7, 8, oligomerization9, 10 and folding11. Much insights have been gained by high resolution structural methods such as cryo-EM and X-ray crystallography. However, structure determination typically provides static snapshots of the protein-lipid complexes. To capture the dynamic aspect of membrane proteins in a lipid environment, other biophysical methods must be used. The labelling of the protein of interest with a pair of probes whose distance can be assessed is a common approach. FRET12 and more recently DEER13 can deduce the conformational changes of a membrane protein by looking at the distance changes between a pair of labels (spin labels or fluorescent labels). Despite valuable insight, these methods require covalent modification of the protein, which often disrupts the structural integrity and function of the protein of interest. NMR also provides dynamic information but its applications to large and heterogeneous systems results into extremely complex signals, thwarting data analysis and interpretation14.
Mass spectrometry (MS) plays an increasingly important role in characterizing the conformational dynamics of membrane proteins15–21. In particular, the recent advent of hydrogen-deuterium exchange coupled to mass spectrometry (HDX-MS) enabled unprecedented resolution in membrane protein dynamics22–24. Upon incubation in a deuterated solvent, the labile hydrogens of the protein backbone are exchanged with deuterium. The mass uptake at different locations is measured by MS and mapped on a 3D structure of the protein to allow visualization of its structural dynamics. Near atomic resolution structures or homology models are thus required for the interpretation of HDX-MS experiments. Specifically, differential HDX-MS (ΔHDX-MS) experiments compare the pattern of deuterium uptake of the same protein in two different conditions to study the effect of one experimental variable. Recent studies have shown the power of this approach to understand the structural dynamics of membrane proteins in various membrane mimics18, 25–28. The nanodisc technology is a method of choice for such biophysical investigation. This technique allows the reconstitution of any membrane protein in a nanoscale soluble bilayer limited by an amphiphilic scaffold protein. The lipid composition can be tuned with great precision, allowing to interrogate the specific role of lipid-protein interactions29–31. However, to enable mechanistic interpretation of the system in question, one must complement HDX-MS with other approaches that allow molecular level resolution. An obvious choice is the use of molecular dynamics (MD) simulations. MD of membrane proteins embedded in lipid bilayers can offer molecular level resolution of lipid-protein interactions and pinpoint mechanisms of functional modulation32–37. The predictive power of all-atoms MD simulations can be harnessed to generate a new framework for interpretation of experimental results8.
Here, we have developed a protocol that combines the power of molecular-level predictions from MD simulations with the conformational read-out of HDX-MS performed in different lipid environments. In this protocol, we describe both the set-up of ΔHDX-MS experiments in nanodiscs and that of all-atoms MD simulations in bilayers. We show how the information gained from HDX-MS can be used for MD simulations and vice-versa, in order to identify mechanistically relevant interactions of lipids with membrane proteins. The combination of HDX-MS of membrane proteins in nanodiscs of chosen compositions with MD simulations offers a window into the molecular role of dynamic interactions between membrane proteins and their surrounding lipids. As an example, we identify key lipid-protein interactions within a ubiquitous family of transporters necessary to support optimal function in lipid membranes.
Overview of the procedure
This protocol aims to identify - at a molecular level - lipid-protein interactions playing critical roles in the conformational changes of membrane proteins. It represents the convergence of experimental and computational approaches. On the one hand, ΔHDX-MS of the membrane proteins reconstituted in nanodiscs of different lipid compositions identifies lipid species involved in the conformational dynamics. On the other hand, MD simulations of the same protein in mixed lipid bilayers predicts lipid-protein interactions at molecular level resolution. These interactions are tested experimentally using mutagenesis followed by ΔHDX-MS to confirm their role in the observed conformational changes. This protocol highlights which interactions play a role in the mechanism, and as a corollary the function, of membrane proteins. The procedure consists of four major steps (Fig. 1).
Figure 1. Four-step workflow to identify lipid-protein interactions involved in conformational transitions of membrane proteins.

From top to bottom: (1) Generation of a ΔHDX map of a known conformation to guide interpretation of the results. (2) Identification of the lipid species involved in conformational changes by generating a ΔHDX map of the protein of interest in two different lipid compositions. (3) Prediction of lipid-protein interactions using all atoms MD simulations of the protein of interest in lipid bilayers. (4) Validation of the predicted interaction by perturbing the interaction with a mutation, then performing ΔHDX-MS to check the loss of conformational sensitivity upon mutation.
Step 1: Generate a fingerprint of the protein in a known conformation.
This step provides a library of peptides sensitive to global conformational changes, to be used as conformational reporters. We carry out ΔHDX-MS experiments comparing the protein in a known conformation (conformational lock) with the protein free to sample its conformational space (conformational exchange). Such comparisons provide a fingerprint of the ΔHDX pattern of the protein in a known conformation; specific locations are protected from deuterium exchange and other locations deprotected from exchange (Fig. 1). This step presupposes structural knowledge of the existing conformations; for instance channels typically alternate from open to closed states38, GPCRs sample active and inactive conformations39 and transporters transitions between inward- and outward-open states40. Different strategies can be used to generate a conformationally locked protein (Fig. 2). Addition of a ligand known to stabilize one conformation, introduction of a steric clash through mutagenesis to restrict structural rearrangement and crosslinking between two cysteines strategically located, are three approaches that we used successfully during the development of this procedure. For instance, the addition of the substrate xylose to the transporter XylE stabilizes the outward-open conformation and leads to a clear ΔHDX pattern where peptides on the extracellular side are deprotected while peptides on the opposite sides are protected (Fig. 2a). An opposite pattern is observed for the protein GltPh; the crosslinking of engineered cysteines 55 and 364 on the extracellular side locks the inward-open conformation (Fig. 2c). This benchmarking step requires a priori structural and functional knowledge of the system; we recommend to use the strategy that seems the more apt produce a conformationally locked membrane protein. The library of peptides reporting global conformational changes can subsequently be used to interpret ΔHDX patterns resulting from ΔHDX-MS experiments in different lipid environments (step 2).
Figure 2. Strategies to produce conformationally locked membrane proteins.

The addition of an excess of ligand xylose (15mM) (1), of a steric clash preventing helical contact by replacing glycine 46 by a bulky tryptophan (2) or of a cysteine crosslink between residues 55 and 364 to restrict motions (3) have been used on the membrane transporters XylE, LacY and GltPh respectively.
Step 2: Identify which lipids are involved in the conformational dynamics.
In order to identify which lipid species plays a role in the conformational dynamics, we have devised a strategy that takes advantage of the versatility afforded by nanodiscs. The nanodisc reconstitution allows the lipid environment to be tuned with a great accuracy41. Practically, the protein of interest is reconstituted in two different lipid environments, differing by one lipid species. The two samples are subjected to ΔHDX-MS following the optimized procedure described hereafter in order to identify which peptides are protected/ deprotected in the presence of the specific lipid species (Fig. 3). The two samples are incubated in a deuterated solvent at minimum three time points (5 min, 30 mins, and 150 mins). The addition of detergent in the quench buffers disassembles the nanodiscs and the lipids are removed by adsorption on Zirconia-coated beads. The proteins are then digested at high pressure (~7000 psi) on a pepsin column. The resulting peptides are separated by liquid-chromatography (UPLC) and identified with HDMSE using the proteomics software PLGS™ from Waters. The level of deuteration per peptide is quantified using the software DynamX™ from Waters. Peptides displaying significant uptake differences between both conditions are sorted out using the software Deuteros42 and plotted on a structural model. The ΔHDX pattern is interpreted with the help of both the benchmarking experiment that identified conformational reporters (step 1) and MD simulations as described below (step 3).
Figure 3. Workflow for identification of lipids modulating the conformational dynamics.

The protein is reconstituted in nanodisc of two different lipid composition and incubated with a deuterated solvent (1). The reaction is quenched and the nanodiscs assemblies are disrupted with detergent dodecylmaltoside (DDM) (2). The lipids are removed by adsorption (3) and the proteins are digested with pepsin (4). The resultant peptides are separated by liquid chromatography (UPLC) and identified by MS (5). The two conditions are compared (6) using the software DynamX™ that allows deuterium quantification (7). The peptides displaying significant difference in deuterium uptake are sorted using Deuteros42 (8), mapped on a structural model (9) and the conformational change caused by the difference in lipid environment is deduced (10).
Step 3: Predict lipid-protein interactions with MD simulations in bilayers.
All-atoms molecular simulation of membrane proteins in bilayer of different compositions identify likely interacting sites and unveil putative mechanistic scenarios43, 44. Practically, the membrane protein of interest is embedded in a model of mixed bilayer and simulated using an appropriate forcefield in a simulation engine. In this protocol, the forcefield chosen is CHARMM3645 and the engine is NAMD46, implemented in the molecular graphics program VMD (Visual Molecular Dynamics)47. Prior to the simulation itself, the system (protein and bilayer) has to be modelled as an appropriate ensemble which mimics its equilibrium configuration. These preparative steps include modelling the protein and the bilayer, and inserting the protein in the bilayer. The steps are outlined in Figure 4 and described in detail below.
Figure 4. Workflow for molecular dynamics simulations of membrane protein in mixed bilayers.
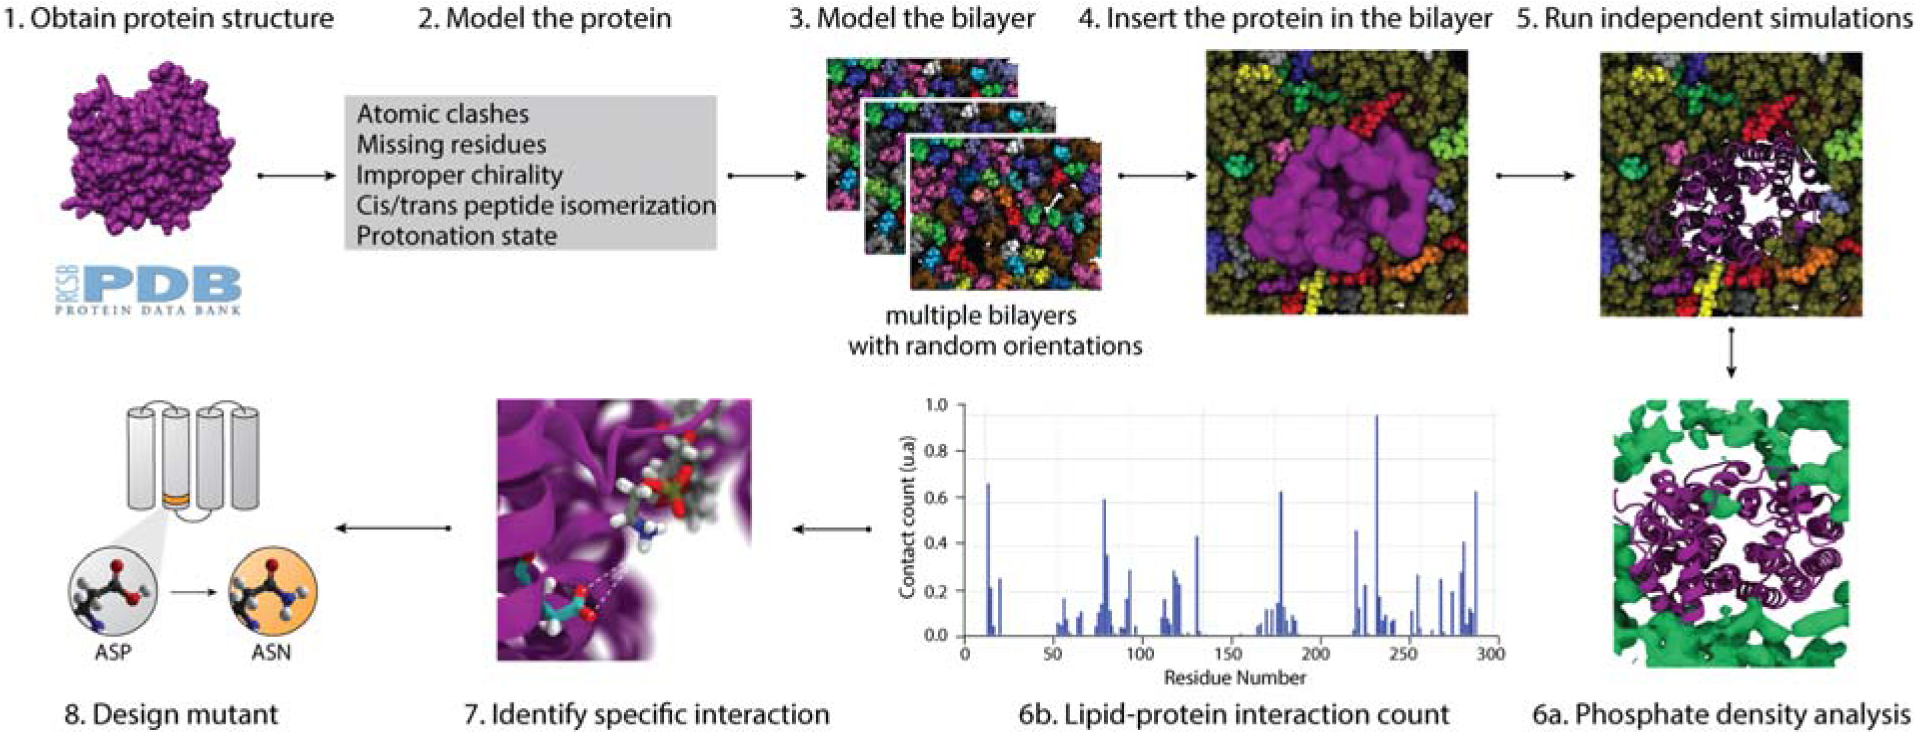
Obtain a high-resolution structure from relevant databases (1), look for and correct potential issues in the PDB (2), model a mixed bilayer in CHARMM (3), then insert the protein in the bilayer avoiding steric clashes (4). Run independent simulations with different lipid orientations for 500 ns or longer (5). Specific phospholipid-protein interactions are identified using the phosphate density analysis tool36(6a) and the lipid-protein interaction count per residue (6b). Once a specific lipid-protein interaction is identified (7) a mutant of the protein of interest is designed (8). The mutation is designed to prevent the stabilization of a specific conformation through the lipid-protein interaction.
Modelling the protein
This initial step requires a three-dimensional structure of the protein in the PDB format. The structure can be obtained from RCSB (https://www.rcsb.org) or EMDB database (https://www.ebi.ac.uk/pdbe/emdb). The structural model is inspected for specific issues such as atomic clashes, missing segments/loops, cis/trans peptide isomerization and improper chirality. The missing segments/loops are introduced using the webserver Superlooper (http://bioinf-applied.charite.de/superlooper). Trans peptide and improper chirality of amino-acids are verified and corrected with the Fix cispeptide and the Fix chirality tools in VMD, respectively. Finally, the correct protonation state of the ionizable residues is assigned based on the pKa prediction using PROPKA(http://nbcr-222.ucsd.edu/pdb2pqr_2.0.0).
Modelling the bilayer
An important question to address prior to assembling the membrane protein system is the choice of lipid composition and the force field describing its bulk properties. The membrane building tool present in the webserver CHARMM-GUI48 is well-suited for MD simulations in mixed bilayers as described in this protocol. This webserver supports a total of 32 different lipids types. We chose the latest CHARMM36 forcefield to describe our lipid protein system, considered to be the most accurate for the simulation of lipid bilayers45.
Modelling the system
The next step consists in inserting the protein within the bilayer. The initial orientation of the protein with respect to the bilayer plane should be reasonably determined before starting MD simulations. For this purpose, we use the OPM database (http://opm.phar.umich.edu), which provides PDB coordinates of membrane proteins in the optimal orientation predicted by minimizing the solvation free energy in membranes49. After determining the orientation, the membrane protein is embedded into an explicit lipid bilayer. Many protocols have been proposed to construct an initial structure of a protein-membrane complex50. We have employed the most prevalent method to generate membrane protein systems with homogenous or mixed bilayers by utilizing the “Membrane Builder” module from the web application CHARMM-GUI48.
The simulation
A typical MD simulation consists in three steps: a minimization step, an equilibration step and the actual simulation, or production run (Fig. 5). The equilibration step is performed in an NVT statistical ensemble, where the number of particles (N), the volume (V) and the temperature (T) are kept constant. We initially minimize the system for 5000 steps, allowing for the removal of any clashes between lipids and the protein that might have occurred during the previous modelling stage. Then, the lipid headgroups and protein heavy atoms are restrained and the simulation is carried on until the pressure of the system stabilizes. The simulation length of this equilibration stage depends on the system size (larger systems lead to longer equilibration time). Typically, for a membrane-protein simulation within a system size of ~150–200 K atoms, the equilibration stage is around 5–10 ns. Various bulk properties of the system like the volume or the total energy are monitored until they stabilize, which indicates that equilibration is attained. The restraints are removed and the production runs are performed for a minimum of 500ns in an NPT ensemble (particle number, pressure and temperature constant), the widely accepted ensemble for membrane protein MD simulations50. We recommend running the simulation for a minimum of 500 ns for a system of a size of 100–200K atoms, a simulation time which usually allows to capture significant lipid-protein interactions. More complex systems in terms of size and heterogeneity may require longer timescales (1–2 μs). At the end of the simulation, the generated data (position and velocity of each atom) are analysed in VMD to highlight specific lipid-protein interactions (see section MD data analysisbelow).
Figure 5. General protocol for MD simulation of a membrane protein in a bilayer.

A typical MD simulation involves three main steps: 1) Minimization 2) Equilibration 3) Production run. After initial minimization in an NVT ensemble for 1000–5000 steps, the system is equilibrated for 5 ns with the heavy atoms of the protein restrained. Then, the production run is performed in an NPT ensemble at 310 K and 1 atm for a minimum of 500 ns.
When performing MD simulations in a mixed lipid bilayer, it is important to keep in mind that proper mixing of the lipid molecules is not possible in the time scales of conventional MD simulations, due to their slow diffusion. In order to sample a diverse distribution of lipid molecules around the protein, we initiate multiple (>3) independent MD simulations with randomized distribution of lipid molecules around the protein.
Step 4: Experimental validation of the predicted lipid-protein interaction.
The two-pronged strategy described so far provides two main information: Step 2identifies one or more specific lipid species modulating the conformational equilibrium of the membrane protein and Step 3predicts lipid-protein interaction(s) for a specific conformation of the same protein. As an obvious next step, we need to determine if the lipid-protein interaction(s) observed in the simulations are responsible for the conformational change observed experimentally. The MD simulation provides molecular hypothesis that can be tested experimentally using mutagenesis followed by ΔHDX-MS.
In the example below (Fig. 6), the bacterial transporter XylE was reconstituted in nanodiscs containing the main bacterial lipid phosphatidylethanolamine (PE) or the eukaryotic lipid phosphatidylcholine (PC) as a control condition. ΔHDX-MS indicates that the presence of PE favours a conformation opened to the cytoplasm and closed to the extracellular side: reporting peptides on the extracellular side are protected from exchange while the peptides on the cytoplasmic side are deprotected (Fig. 6 a, e). MD simulations have shown a direct interaction between PE headgroup and conserved charged residues on the cytoplasmic side (Fig. 8). This interaction can only occur if the protein is in the conformation used in the simulation and suggests that PE prevents cytoplasmic closure necessary for the conformational transition, effectively stabilizing the simulated conformation. To test this hypothesis, we mutated a charged residue to a polar residue, to perturb the network of charges between the conserved residues and the lipid PE. We then repeated the ΔHDX-MS experiment on the mutant. The peptides that were displaying different uptake in the two different lipid environments for the non-mutated protein are no longer showing difference in their deuteration profile and in fact no significant difference in deuterium is observed for any peptide (Fig. 6 b, f). Such observation confirms the hypothesis and validates the molecular role of the predicted interaction in modulating the conformational dynamics of the transporter.
Figure 6.

Experimental validation of a molecular hypothesis suggested by MD simulations.(a) The ΔHDX map of the transporter XylE in nanodiscs of PE lipids vs nanodiscs of PC lipids shows a clear conformational sensitivity. (b) The ΔHDX map of the mutant XylE E153Q in the same nanodisc shows a loss of conformational sensitivity to the lipid environment. (c) Comparison between the WT and the mutant of the deuterium uptake of the cytoplasmic peptide 69–88. (d) Comparison between the WT and the mutant of the deuterium uptake for the extracellular peptide 49–56. (e) Differential uptake plot for the WT XylE in both lipid compositions showing the statistically significant different peptides (confidence interval of 99%). (f) Differential uptake plot for the mutant XylE E153Q in both lipid compositions showing the statistically significant different peptides (confidence interval of 99%).
Figure 8. MD simulations in mixed bilayers predict direct interactions between the phospholipid PE and the transporters XylE and LacY.

(a) Simulation box of XylE (PDB 4PYP) in a mixed bilayer of PE:PG:CL (70:20:10). (b) cytoplasmic view of XylE showing the PE headgroup interacting with the charged residues R80 and E153 (c) Simulation box of LacY (PDB 2V8N) in a mixed bilayer of PE:PG:CL (70:20:10).(d) cytoplasmic view of LacY showing the PE headgroup interacting with the charged residue E139.
Advantages and limitations of the method
Advantages:
HDX-MS is particularly well suited for membrane proteins, known to be difficult to express and purify in large quantity. HDX-MS requires a limited amount of sample – typically 150 μL at 30μM will be used for one ΔHDX-MS experiment with four time points and three technical replicates per time point. High sample purity is desirable but not essential since protein contaminants will easily be sorted out by the proteomics software. Furthermore, HDX-MS does not require covalent modification of the protein, circumventing the typical limitation of other biophysical techniques aimed at probing dynamics. Such modifications are known to affect the structure and stability of the protein of interest and require a number of time-consuming controls. Another clear advantage is that the HDX-MS experiments are carried out in solution, at room temperature, in the buffer which is deemed the most suitable for the protein stability and function. In this regard, HDX-MS is one of the most “native” tool available for biophysical investigation. MD is performed in silico and uses up no protein.
Limitations:
The major disadvantage of ΔHDX-MS experiments is that data interpretation requires a priori structural knowledge of the conformations that the protein can adopt. First, the benchmarking step requires the design of a conformationally locked mutant which presumes a good understanding of the conformations available to the protein. Second, the changes in deuterium uptake report do not directly report on conformational dynamics but rather on changes in H-bond stability, which can only be correlated to conformational changes in a well-defined structural framework (e.g.: if the protein is a transporter known to alternate between two conformations open to opposite sides of the membrane, inward-open and outward-open). Interpretation and visualization of the ΔHDX patterns requires a near-atomic resolution structure, although a homology model can be used if no structure is available. Furthermore, while the size of the protein is in theory not a limit, the HDX-MS data analysis takes much longer for larger protein/complexes where the number of peptides to analyse increases. From our experience, a 50 kDa membrane protein will generate around 300 peptides. The analysis of one set of ΔHDX-MS experiments (two datasets compared) for a protein of that size requires 1–2 days. Regarding the MD simulations, an important requirement is the availability of a high-resolution structure. The predictive power of MD decreases dramatically if a homology model is used. Low resolution structures (less than 3.5 angstroms) should be avoided as they may lead to ambiguous or inconclusive results.
Experimental Design
Here, using the membrane transporters XylE an LacY as examples51, 52, we show that the synergistic use of MD simulations in mixed bilayers and ΔHDX-MS experiments in nanodiscs identifies direct lipid-protein interactions, important for the transport cycle. We believe a few points should be stressed out prior to the detailed description of the protocol. First, we would like to note that the procedure was adapted for the two transporters. The buffers used for the ΔHDX-MS experiments are optimized for the stability and function of the proteins LacY and XylE. The exact buffer compositions have to be adapted for the membrane protein of interest, and fulfil the conditions in which the protein is stable, folded and functional. Furthermore, the nanodiscs reconstitution procedure generates an excess of empty discs, which have to be discarded to improve the signal to noise ratio of the proteomics analysis. The separation between full and empty discs is typically done using affinity purification, which implies that the protein of interest must possess the appropriate tag for such purification step.
MATERIALS
REAGENTS for HDX-MS
Deuterium oxide (99.8% atom D; Sigma cat. no 617385)
Sodium deuteroxide solution (40% wt. in D2O 99% atom D; Sigma cat. no. 176788)
Deuterium chloride solution (35% wt. in D2O 99% atom D; Sigma cat. no. 543047)
Sodium Iodide (>99.5%; Sigma cat.no. 383112)
Isopropanol (HPLC grade; Fisher Chemical cat. no. P/7507/15)
N-Dodecyl-β-D-maltopyranoside (DDM; Anagrade, Anatrace, cat. no. D310LA)
Potassium phosphate monobasic (>98%; Sigma cat.no P9791)
Potassium phosphate dibasic (>98%; Sigma cat.no P3786)
Sodium phosphate dibasic (>99%; Sigma cat.no. 71636)
Sodium phosphate monobasic (>99%; Sigma cat. no. 71505)
Glycerol (>99.5%; Sigma cat. no. G7893)
Sodium Chloride (>99.5%, Sigma-Aldrich cat. no. S7653)
Formic acid (>99%; Acros Organics cat. no. 270480250)
Water (HPLC gradient grade; Fisher Chemical cat. no. W/0106/17)
Acetonitrile (ACN ; Pierce LC-MS Grade, cat. no. 51101)
Leucine Enkephalin acetate salt hydrate (>95%; Sigma cat. no. L9133)
Zirconia coated silica bulk (Supelco; cat. no. 5425-U)
Phosphorylase B from rabbit muscle (Sigma cat. no P6635)
Protein of interest, both in detergent micelles and reconstituted in nanodiscs of chosen lipid compositions. The protocol for nanodiscs reconstitution can be found elsewhere2.
EQUIPMENT for HDX-MS
Trap column ACQUITY UPLC BEH C18 VanGuard Pre-column (1.7μm 2.1 × 5 mm; Waters cat. no. 186003975)
Analytical column ACQUITY UPLC BEH C18 analytical column (1.7μm 1.0 × 100mm; Waters cat. no 186002346)
Enzymate BEH pepsin column (300 A, 5μm, 2.1 × 30 mm; Waters cat. no. 186007233)
Spin X centrifuge tube filters, 0.22μm Pore CA membranes (Costar cat. no. 8161)
Syringe for injection in HDX manager (Syr 250μL PTFE 22 CTC cat. no. 8010–0467)
Centrifugal concentrators (molecular weight cutoff (MWCO) 50kDa, Vivaspin 500 GE cat. no. 28–9322-37)
BenchTop centrifuge – refrigerated
Heating block at 22°C
pH-meter with 0.01 pH unit accuracy and 0–14 pH range (FiveGo F2, Mettler – Toledo)
Timer
Table-top vortexer
HDX – ACQUITY UPLC M-Class System with HDX Manager (Waters)
Mass spectrometer with ion mobility cell - Synapt G2-Si (Waters)
Optional: LEAP Technologies dual arm PAL for automated sample preparation
Optional: Vial conical bottom, polypropylene (12mm × 32mm, 300μL; Thermo Scientific cat. no. C4010–13) for autosampler
Optional: Vial Screw Thread Caps (Thermo scientific cat. no. C4010–55BLK) for autosampler
ProteinLynx Global SERVER software 3.1 (Waters): used to analyse the MS data of unlabelled peptide and generate peptide libraries for each target protein
DynamX 3.0 software (Waters): used to analyse and quantify the deuteration for each peptide
Deuteros in MatLab 2017: used to sort out statically significant differences in deuterium uptake for the same peptides in two different conditions. Generates scripts for Pymol
Pymol 2.0.4 molecular graphics software used to visualize the results of the ΔHDX-MS experiments (open source – under Python License)
EQUIPMENT for MD
Protein structure coordinates (http://www.rcsb.org)
Appropriate Force Field (CHARMM)
In general, an MD application requires two types of software, namely an MD engine and a visualization software.
MD engine:
GROMACS (http://www.gromacs.org)
AMBER (http://ambermd.org)
OpenMM (http://openmm.org)
Visualization Software:
Chimera (https://www.cgl.ucsf.edu/chimerax)
PyMOL (https://pymol.org/2)
In the examples presented in the protocol, NAMD and VMD were used.
MD simulations require parallel computing to be able to run longer simulations in a shorter period. For smaller jobs or pre-processing, a desktop workstation machine preferably running on Linux is sufficient. However, it is preferable to perform initial steps on a local machine and the final MD run on a computer cluster.
Local Workstation:
Intel(R) Xeon(R) CPU E5–2660 v3 @ 2.60GHz
NVIDIA GeForce GT 625
16 processors
510 GB memory
Centos Linux version 7 OS
Supercomputing Resources:
Bluewaters NCSA (https://bluewaters.ncsa.illinois.edu)
2,640 Cray XE6 nodes and 4,228 Cray XK7
XE6 nodes: 64 GB/node of memory and the XK7s: 32 GB/node
REAGENT SETUP
Membrane protein expression and purification.
We refer the user to existing protocols and chose the best suited for the protein of interest. In this protocol, we use the transporters XylE and LacY as examples, using published procedures2
Membrane scaffold protein expression and purification.
The scaffold protein can be purchased or produced in-house following established protocols53. Scaffolds proteins of different lengths are available, depending on the size of the protein to insert. We have used the scaffold protein MSP1E3D1 to reconstitute the two transporters.
Detergent storage and use.
10% stock of detergent DDM are prepared in mQ water, aliquoted in 500ul vials and stored at −20°C for up to 6 months. The vial is thawed on the day of use.
HDX equilibration buffer.
Prepare the buffer by mixing sodium phosphate 50 mM, 100 mM NaCl, 10% glycerol. Adjust to pH7.4 with HCl and/or NaOH. Filter through 0.22uM filter and keep at 4°C for up to two months. Filter again on the day of use. Use HPLC grade water or purer.
HDX labelling buffer.
Same composition as HDX equilibration buffer but with D2O. The pD is adjusted with NaOD and DCl. It is important to note that the actual pD value is calculated from the relation: pD = pH reading +. 0.41
HDX Quench buffer.
Prepare the buffer with 100 mM potassium phosphate, brought to pH 2.4 with formic acid. Add detergent DDM to a final concentration of 0.2% (m/v). Use HPLC grade water or purer
Clean blank buffer.
Dilute 0.1% formic acid in water (HPLC grade), pH2.4 adjusted with formic acid
Zirconia-coated silica beads solution.
Weigh 300mg of ZrO2 beads and add 1mL of ice-cold Quench buffer. Prepare on the day of use. This stock can be kept at 4°C for up to one week.
NaI calibration solution.
Prepare a solution of 2μg/mL of NaI in 50:50 water:isopropanol. The solution can be stored at 4°C for several months. It is important to calibrate the MS instrument before starting the HDX-MS experiments.
LeuEnk lockmass solution.
Prepare a solution of 50pg/μL in 50:50 water:ACN + 0.1% formic acid. This will be used a s a refence mass during the MS acquisition.
Protein of interest in detergent micelles and lipid nanodiscs.
We demonstrate our protocol using the membrane proteins LacY and XylE as examples. Both proteins were purified in DDM detergent micelles according published purification protocols2 and then reconstituted in lipids nanodisc composed either of dioleoyl phosphatidylethanolamine (PE): dioleoyl phosphatidylglycerol (PG): tetraoleoyl cardiolipin (CL) in a 7:2:1 molar or nanodiscs in which PE was substituted for dioleoyl phosphatidylcholine (PC).
EQUIPMENT SETUP
Pepsin column digestion.
We systematically perform in-line on column pepsin digestion at 20°C and at high-pressure (~7500 psi under 200μL/min flow-rate) as it consistently gave better results in terms of sequence of coverage and peptide redundancy. This column can be purchased through Waters and is kept at 4°C between experiments. Before starting the experiment, the pepsin column should be placed in the pepsin chamber set at 20°C to allow temperature equilibration for 30 min.
LC separation.
The peptides were separated using a nanoACQUITY UPLC class-M from Waters. For 1D reversed-phase liquid chromatography, peptides were injected onto a BEH C18 trap column and then eluted onto a C18 analytical column maintained at 0°C. The LC program consisted of a gradient of 8 to 40% acetonitrile in HPLC water (acidified with 0.1% v/v formic acid) over 8 minutes with a flow rate of 40 μL min−1, followed by a ramp to 85% acetonitrile for 2 min, then a return to the initial conditions.
Clean blank.
Between each sample injection, a clean blank run is performed to prevent carry-over of peptides from previous injection. 100 μL of Clean blank buffer is injected in the sample injection loop and the following saw-tooth LC method is used:
| Time (min) | Flow (μL/min) | %A (water) | %B (ACN) |
|---|---|---|---|
| Initial | 40 | 92 | 8 |
| 2 | 40 | 15 | 85 |
| 4 | 40 | 92 | 8 |
| 6 | 40 | 15 | 85 |
| 8 | 40 | 92 | 8 |
| 9 | 40 | 92 | 8 |
Mass spectrometer.
The mass spectrometer used in this protocol is the Synapt G2-Si, coupled to the HDX manager™ from Waters. Mass spectrometry was performed based on data-independent acquisition using high-definition (HD) MSE methodology54. The following acquisition parameters were used on the SYNAPT G2-Si: HDMSE, positive electrospray (ESI+) mode, V optics, scan time 0.3 seconds, cone voltage 30 V, m/z range 50–2000, and lock mass [Leucine Enkephaline][M+H]+1 556.2771 m/z. Collision energy (CE) was ramped based the mobility of ions for optimal collision-induced dissociation (CID). The optimal ramping parameters for both our proteins of interest were found to be 25V to 45V in the transfer collision cell.
HDX-MS Data Analysis.
HDX-MS experiments generate a vast amount of raw data. The only information used in this protocol is the significant difference of the sum of HDX over all time points (ΔHDX) between two conditions. A lot of other information can be extracted from HDX-MS experiments, such as changes in dynamics over time between different locations on the protein, degree of protection from exchange by comparing absolute uptake values with the maximum theoretical uptake values, etc. Our experience has shown that the reproducibility between different experiments is mostly limited to this ΔHDX parameter, as the absolute deuterium uptake value as well as the exact location of deuterium uptake varies significantly between biological replicates. For this reason, we restrict our analysis to this parameter. After analysis of ΔHDX data with the software DynamX (Waters) we use the Deuteros Matlab script to extract peptides showing a statistically significant difference between conditions42.
MD Data Analysis.
MD simulations generate trajectories containing information of the positions and velocities of each individual atoms. We save these trajectories every 1000–5000 steps. They are visualised in the MD visualization software VMD which remains freely available for academic use36. Initial visual inspection of the MD trajectory provides an overall idea of the behaviour of lipids in the presence of the membrane protein. We perform two sets of analysis: the phosphate density analysis and the specific lipid-protein interaction count. We calculate the density of the phosphate of the lipids around the protein using the Volmap tool in VMD36. Furthermore, we calculate the average lipid-protein interaction count by counting the lipid molecules that came within 3.0 A of any protein atoms. The analysis scripts were written in Tcl employing Tk console in VMD. The scripts that were used to perform the analysis are provided here:
Procedure
Identifying peptides reporting global conformational changes. Timing: ~18h (NB: this step can be performed overnight on an automated system)
This first step consists in comparing the membrane protein of interest in a dynamic conformational equilibrium with a specific conformational intermediate known by the user.
Δcritical step: steps 1–3 require the addition of detergent in the buffers. Only a few buffers are compatible with LC-MS/MS separation and analysis. We recommend the use of dodecylmaltoside (DDM) as this detergent leads to minor ion suppression and does not co-elute with the peptides. The vast majority of known membrane proteins are stable in DDM. The use of other detergents should be systematically tested. Triton and other PEG-based detergents lead to PEG contamination of the MS signal and should be avoided.
Δcritical step: Steps 2–3 can be automated and performed overnight if the LC separation system is coupled to an autosampler. We used the LEAP Technologies dual arm PAL for automated sample preparation.
-
1
Take 100μL of your membrane protein of interest and 100 μL of the conformationally locked version. Make sure that the concentration of your sample ranges from 30μM to 70μM. We typically check this by measuring absorbance at 280nm on a Nanodrop.
-
2
Prepare your reference samples for peptide identification and sequence coverage check by mixing 5μL of sample with 95μL of HDX equilibration buffer supplemented with 2 cmc of DDM or any other compatible detergent. Add 100μL of ice-cold Quench buffer, mix by vortexing. Immediately take 100μL of the quenched sample and inject on the pepsin column and run the LC-HDMSE method. Prepare and run 5 technical replicates. Perfom a clean blank run with clean blank buffer between each sample using recommended saw-tooth LC method.
PAUSE POINT. Alternately, the quenched sample can be flash-frozen in liquid nitrogen and kept at −80C for up to one month.
-
3
Start the deuteration experiment by mixing 5μL of the protein sample with 95μL of HDX labelling buffer supplemented with 2 cmc of adequate buffer and incubate at 22°C in a heating block during a defined amount of time. Quench the reaction by adding 100μL of ice-cold Quench buffer, mix by vortexing. Take 100μL of the quenched sample and inject on the pepsin column and run the LC-MS/MS method. Prepare and run 3 replicates for each time point. Perfom a clean blank run with clean blank buffer between each sample using recommended saw-tooth LC method. We recommend a minimum of 3 deuteration time points (eg 30s, 5 min, 30min).
PAUSE POINT. Alternately, the quenched sample can be flash-frozen in liquid nitrogen and kept at −80C for up to one month.
-
4
Analyse the raw data of the reference samples with PLGS to generate a list of peptides and measure the differential deuterium uptake for each peptide using DynamX. We recommend using the following parameters for compiling the library of peptides: minimum products per amino acid of 0.3 and minimum score of 6.
Troubleshooting
-
5
Export the difference data file and the state data files from DynamX and input the files in the open-source visualization software Deuteros. Generate a Woods plot for the sum of ΔHDX over all time points and a Pymol script to sort out the peptides displaying significant uptake difference between the two conditions. We recommend using a confidence interval of 99% as we observe a high degree of reproducibility between biological replicates using this interval. Export the pymol script from Deuteros and plot the sum differential uptake data on the PDB structure of the membrane protein of interest. This allows visualization and identification of the regions of the protein sensible to the changes in conformational equilibrium (Fig. 7).
Figure 7. Using Deuteros to visualize and sort peptides displaying significant difference in deuterium uptake.

Open Deuteros in Matlab and import the difference data and the state data files generated from DynamX. Set the confidence limits intervals. Plot the sum of the differential uptake over all time points and identify peptides displaying significant differences between both conditions. Generate a Pymol script and visualize the ΔHDX map on the 3D structure or model.
Identifying lipid species involved in conformational transitions. Timing: ~15h
This step highlights changes in the conformational equilibrium within two different compositions of lipid bilayers.
-
6
Prior to the HDX-MS experiment, reconstitute the membrane protein of interest in lipid nanodisc of two different chosen compositions. One lipid mix should contain the lipid species of interest and the other lipid mix is devoid of that lipid and used as a control/reference. We recommend a few reviews and protocols detailing the procedure55–57. The ideal reconstitution depends on the protein of interest and several parameters can be optimized such as the choice of the scaffold protein, the choice of lipid species, the lipid: protein ratio and the MSP:protein ratio.
-
7
Prepare your reference samples for peptide identification and sequence coverage check by mixing 5μL of sample with 95μL of HDX equilibration buffer (no DDM!). Add 100μL of ice-cold Quench buffer, mix by vortexing. Add 10μL of zirconia beads solution and vortex for 3s to remove the lipids. Place on ice for 30s and vortex again. Filter the sample through pre-chilled 0.22 μm spin filtration devices in a pre-chilled microcentrifuge at 1,000 x g for 30 s. Take 100μL of the quenched sample and inject on the pepsin column and run the LC-MS/MS method. Prepare and run 5 replicates. Perfom a clean blank run with clean blank buffer between each sample using recommended saw-tooth LC method.
PAUSE POINT. Alternately, the quenched sample can be flash-frozen in liquid nitrogen and kept at −80C for up to one month.
Δcritical step: don’t forget to resuspend the zirconia coated silica beads by vortexing gently prior to pipetting
Δcritical step. Make sure that your Quench buffer and zirconia bead solution are on ice, and that a refrigerated bench top Eppendorf centrifuge is ready to use and cooled-down.
Δcritical step. The nanodisc concentration is a critical parameter to obtain a good sequence coverage and the HDX conditions have to be manually optimized for each nanodisc sample. Practically, the purified nanodiscs are tested for coverage by performing a reference only run on the mass spectrometer and the coverage immediately assessed using PLGS. The protein is concentrated using mini vivaspin concentrators until a coverage of more than 85% is achieved.
Troubleshooting
-
8
Start the deuteration experiment by mixing 5μL of the protein sample with 95μL of HDX labelling buffer (no DDM!) and incubate at 22°C in a heating block during a defined amount of time. Quench the reaction by adding 100μL of ice-cold Quench buffer, mix by vortexing 3s then place the sample on ice for 1min. Add 10μL of zirconia beads solution, vortex for 3s, place on ice for 30s, vortex again for 3s, re-place on ice for 30s. Filter the sample through pre-chilled 0.22 μm spin filtration devices in a pre-chilled microcentrifuge at 1,000 x g for 30 s. Take 100μL of the quenched sample and inject on the pepsin column and run the LC-MS/MS method. Prepare and run 3 replicates for each time point. We recommend a minimum of 3 deuteration time points. Perfom a clean blank run with clean blank buffer between each sample using recommended saw-tooth LC method.
PAUSE POINT. Alternately, the quenched sample can be flash-frozen in liquid nitrogen and kept at −80C for up to one month.
Δcritical point: the dynamics of the membrane protein can be affected by the lipid environment, and the time points used for the previous step 3 might need to be adapted for this step. Typically, we observe that the structural dynamics are reduced in nanodiscs and that longer time points are required to observe significant differences between the lipid compositions. Increasing the incubation time can lead to protein unfolding or aggregation. Care should be taken to check that the protein is stable at RT during the incubation (either by performing CD and/or by running an analytical SEC).
-
9
Analyse the raw data of the reference samples with PLGS to generate a list of peptides and measure the differential deuterium uptake for each peptide using DynamX (same as step 4). We recommend using the following filtering parameters: minimum products per amino acid of 0.3 and minimum score of 6.
Troubleshooting
-
10
Export the difference data file and the state data files from DynamX and input the files in the open-source visualization software Deuteros. Generate a Woods plot (Fig. 7) and a pymol script to sort out the peptides displaying significant uptake difference between the two conditions. We recommend using a confidence interval of 99% as we have a high degree of reproducibility between biological replicates using this interval. Export the pymol script from Deuteros and plot the sum differential uptake data on the PDB structure of the membrane protein of interest. This allows visualization and identification of the regions of the protein sensible to the changes in conformational equilibrium in the two different lipid environments.
-
11
Compare this result with the one obtained at step 5 (benchmarking step) to see whether the lipid species favours a specific conformational intermediate.
Predict direct lipid-proteins interactions with MD. Timing:~ 2 weeks
This step predicts with a molecular level of detail plausible direct lipid protein interactions
Δcritical step. A typical MD simulation probing lipid-protein interactions is in the order of 500 ns-1 μs simulation timescale. As such, depending on the system size and the available hardware, run time may range from a couple of weeks to a month.
-
12
The 3-D protein structures obtained from the databases like PDB/EMDB are initially checked for various issues such as missing segments/loops, cis/trans peptide isomerization and improper chirality (Fig. 4)
Δcritical step. Multiple protein conformations - if available - can be used in independent sets of simulations to probe for different lipid interactions.
-
13
Using Charmm-GUI, protein in is inserted into a mixed bilayer of lipid molecules.
-
14
The process of protein insertion is repeated with multiple different lipid orientations (n>3 simulation sets).
Δcritical step This partially accounts for the lack of lipid mixing in the timescales of atomistic simulations, thereby allowing for a statistically significant ensemble of varied lipid orientations.
-
15
The generated protein-lipid complex is minimized using steepest descent minimization and simulated in an NVT ensemble keeping the head group and the protein atom restrained for 0.5 ns.
-
16
The restraints on the lipid head group are removed and the system is simulated for 3.0 ns with restraints only on the protein Cα atoms.
Δcritical step. This step allows for tight packing of lipids around the protein as well as solvent relaxation. This is also beneficial in correcting for the incorrect rotameric assignments during the initial stages.
-
17
In the subsequent 2 ns of the simulation the restraints on the Cα atoms are slowly ramped down.
-
18
System volume is monitored and if it has stabilized, the production simulation runs can be performed in NPT ensemble.
Δcritical step. In order to generate statistically relevant datasets to describe lipid-protein interactions, 5 copies of system are made and independent simulations are launched each with the same starting conformation but at different randomized velocities.
Troubleshooting
-
19
The trajectories obtained from the MD simulation is saved every 1000–5000 steps and visualized on VMD to look out for potential lipid-protein interaction.
-
20
Lipid-protein interaction is quantified by calculating the density of the phosphate group around the protein using the volmap tool in VMD.
-
21
specific lipid protein interaction is obtained by calculating average per-residue protein lipid contact using the tcl script provided alongside.
Identify direct lipid-protein interactions involved in conformational transitions.
This final step tests the predictions of MD by combining mutagenesis with HDX-MS in nanodiscs.
-
22
Repeat steps 6–10 with a mutant of the membrane protein of interest. The mutation is designed to disrupt or compromise the predicted lipid protein interaction, while introducing as little as possible structural perturbation of the native protein fold.
Timing:
Steps 1–5: identify peptides reporting on conformational changes: preparation and acquisition of the reference samples: 2h30.
The ΔHDX-MS experiment timing varies depending on the number and length of deuteration time points. Typical time for 3 time points, 3 replicates is 10h if the samples are prepared and run on the MS in parallel. Otherwise sample preparation is ~4hours and running time of a whole set (3 time points, 3 replicates per time point, two conditions) on the MS is ~10h
Steps 6–10: Identifying lipid species involved in conformational transitions. preparation and acquisition of the reference samples: 2h30.
The ΔHDX-MS experiment timing varies depending on the number and length of deuteration time points. Typical time for 3 time points, 3 replicates is 10h if the samples are prepared and run on the MS in parallel. Otherwise sample preparation is ~4hours and running time of a whole set (3 time points, 3 replicates per time point, two conditions) on the MS is ~10h
Steps 12–21: two weeks to one month, depending on the computing resources available and the size of the system.
Steps 22: preparation and acquisition of the reference samples: 2h30.
The ΔHDX-MS experiment timing varies depending on the number and length of deuteration time points. Typical time for 3 time points, 3 replicates is 10h if the samples are prepared and run on the MS in parallel. Otherwise sample preparation is ~4hours and running time of a whole set (3 time points, 3 replicates per time point, two conditions) on the MS is ~10h
Troubleshooting:
| step | problem | Possible reason | solution |
|---|---|---|---|
| 4 | Poor sequence coverage for the detergent-solubilized sample |
|
|
| 9 | Poor sequence coverage in nanodiscs. Good digestion on the detergent-solubilized protein. | The nanodisc disassembly didn’t work. Alternately, the protein concentration is too low. | Increase the concentration of DDM in Quench buffer. The use of a harsher detergent such as foscholine can help for dissociation. However, a harsher detergent can lead to aggregation. Different concentrations of both detergents should be tested Alternately, concentrate the sample more on mini-spin concentrators. |
| 9 | There is little or no deuterium uptake. | The protein is not solvent accessible or the kinetics of exchange are too slow. | Use shorter chain lipids or increase the pD of HDX labelling buffer. |
| 18 | Protein is unfolding during the simulation and structure is not stable. |
|
|
| 4 and 9 | Poor digestion | Enzyme pepsin not active anymore. | Test the efficiency of the pepsin column by digesting the standard sample phosphorylase B. Alternately, place the column upside-down or change column |
ANTICIPATED RESULTS:
We used the protocol presented here above to follow the conformational transitions of secondary transporters from the widespread Major Facilitator Superfamily. The strategy we used for the initial benchmarking step (step 1) was to stabilize the outward-open conformation with the introduction of a bulky tryptophan in place of a conserved glycine. Such substitution sterically prevents the closing of the extracellular side and thus trap the protein in an outward-open conformation (Fig. 2). We then carried out ΔHDX-MS measurements in DDM detergent micelles. We observed that the end of the helices on the extracellular side was significantly deprotected compared to the WT, while the end of the helices on the intracellular side was significantly protected. This pattern of protection on one side was coupled to deprotection on the other side was observed for two homologous transporters. These results are in agreement with the alternating-access mechanism of transport, which describes the structural transitions of secondary transporters as oscillating between an inward-open and an outward-open conformation, alternately exposed to both sides of the membrane.
Previous work on homologous transporters had suggested a role for phosphatidylethanolamine (PE) lipid in regulating conformational transitions of MFS transporters58. We reconstituted both transporters in nanodiscs containing PE as the main lipid component (70%), as well as phosphatidylglycerol (PG) (20%) and cardiolipin (CL) (10%) to mimic the native environment of the transporters59. This was compared to a nanodisc composition where PE was replaced by PC, a non-bacterial lipid. For both transporters, significant ΔHDX values for different peptides were observed between the two conditions. Peptides on the extracellular side of the transporters were protected from exchange while peptides on the intracellular side were deprotected. This pattern was very clear for XylE (Fig. 6) and less pronounced for LacY2. By comparing this ΔHDX pattern with the one obtained for the conformationally locked mutant, we could confidently suggest that the presence of PE was favouring the inward-open conformation. We then ran MD simulations of LacY and XylE in bilayers composed of PE:PG:CL and PC:PG:CL (2 simulation runs of 50ns each). XylE has been crystallized in different conformations, outward-open and inward-open, and both conformations were tested. For LacY, only the inward-open conformation was tested. For both transporters, we observed clear lipid-protein interaction only for the inward-open conformation, between conserved acidic residues located on the cytoplasmic side (Fig. 8). We could clearly observe the PE coming from the membrane inside of the transporter cavity.
These results clearly imply that the interaction between PE and the network of charged residues are stabilizing the inward-open conformation. We tested this hypothesis on XylE by replacing the most interacting residue glutamate153 with a glutamine. We then performed HDX-MS experiments in PE- and PC-based nanodisc and could not detect any significant ΔHDX anymore. The conformational sensitivity to the lipid environment was lost (Fig. 6). The simplest explanation for this observation is that a direct interaction between PE and the conserved network of charged residues is important to stabilize the inward-open conformation. Since PE is the most abundant lipid in E.coli, it is very likely that such interaction plays a crucial role in regulating the rate of conformational transition, and thus the in vivo function of secondary transporters
In summary, we have shown how synergising HDX-MS experiment with computational approaches in a lipid environment can be used to identify key lipid-protein interactions. It is worth noting that this protocol highlights relevant interactions; this is not to be confused with binding which can be tested using other protocols and tools including high resolution native MS9. The dynamic and transient aspect of interaction should not be neglected and is of fundamental importance in biological processes.
Acknowledgments
We thank Olga Boudker and Xiaoyu Wang for providing the GltPh samples. This work was supported by the Wellcome Trust (109854/Z/15/Z) and a King’s Health Partners R&D Challenge Fund through the MRC (MC_PC_15031) to A.P. C.M is a research fellow from the FNRS. The research is also supported in part by the National Institute of General Medical Sciences of the National Institutes of Health under awards U54-GM087519, P41-GM104601, and R01-GM123455 to E.T. We also acknowledge computing resources provided by Blue Waters at National Center for Supercomputing Applications, and Extreme Science and Engineering Discovery Environment (grant TG-MCA06N060 to E.T.).
Footnotes
Competing interests
The authors declare no competing interests.
References
- 1.Laganowsky A et al. Membrane proteins bind lipids selectively to modulate their structure and function. Nature 510, 172–175 (2014). [DOI] [PMC free article] [PubMed] [Google Scholar]
- 2.Martens C et al. Direct protein-lipid interactions shape the conformational landscape of secondary transporters. Nature communications 9, 4151 (2018). [DOI] [PMC free article] [PubMed] [Google Scholar]
- 3.Pliotas C et al. The role of lipids in mechanosensation. Nature structural & molecular biology 22, 991–998 (2015). [DOI] [PMC free article] [PubMed] [Google Scholar]
- 4.Yin H & Flynn AD Drugging Membrane Protein Interactions. Annual review of biomedical engineering 18, 51–76 (2016). [DOI] [PMC free article] [PubMed] [Google Scholar]
- 5.Gao Y, Cao E, Julius D & Cheng Y TRPV1 structures in nanodiscs reveal mechanisms of ligand and lipid action. Nature 534, 347–351 (2016). [DOI] [PMC free article] [PubMed] [Google Scholar]
- 6.Zhou M et al. Mass spectrometry of intact V-type ATPases reveals bound lipids and the effects of nucleotide binding. Science 334, 380–385 (2011). [DOI] [PMC free article] [PubMed] [Google Scholar]
- 7.Allison TM et al. Quantifying the stabilizing effects of protein-ligand interactions in the gas phase. Nature communications 6, 8551 (2015). [DOI] [PMC free article] [PubMed] [Google Scholar]
- 8.Landreh M et al. Integrating mass spectrometry with MD simulations reveals the role of lipids in Na(+)/H(+) antiporters. Nature communications 8, 13993 (2017). [DOI] [PMC free article] [PubMed] [Google Scholar]
- 9.Gupta K et al. Identifying key membrane protein lipid interactions using mass spectrometry. Nature protocols 13, 1106–1120 (2018). [DOI] [PMC free article] [PubMed] [Google Scholar]
- 10.Pyle E et al. Structural Lipids Enable the Formation of Functional Oligomers of the Eukaryotic Purine Symporter UapA. Cell chemical biology 25, 840–848 e844 (2018). [DOI] [PMC free article] [PubMed] [Google Scholar]
- 11.Sanders MR, Findlay HE & Booth PJ Lipid bilayer composition modulates the unfolding free energy of a knotted alpha-helical membrane protein. Proceedings of the National Academy of Sciences of the United States of America 115, E1799–E1808 (2018). [DOI] [PMC free article] [PubMed] [Google Scholar]
- 12.Majumdar DS et al. Single-molecule FRET reveals sugar-induced conformational dynamics in LacY. Proceedings of the National Academy of Sciences of the United States of America 104, 12640–12645 (2007). [DOI] [PMC free article] [PubMed] [Google Scholar]
- 13.Claxton DP, Kazmier K, Mishra S & McHaourab HS Navigating Membrane Protein Structure, Dynamics, and Energy Landscapes Using Spin Labeling and EPR Spectroscopy. Methods in enzymology 564, 349–387 (2015). [DOI] [PMC free article] [PubMed] [Google Scholar]
- 14.Liang B & Tamm LK NMR as a tool to investigate the structure, dynamics and function of membrane proteins. Nature structural & molecular biology 23, 468–474 (2016). [DOI] [PMC free article] [PubMed] [Google Scholar]
- 15.Konermann L, Stocks BB, Pan Y & Tong X Mass spectrometry combined with oxidative labeling for exploring protein structure and folding. Mass spectrometry reviews 29, 651–667 (2010). [DOI] [PubMed] [Google Scholar]
- 16.Konijnenberg A et al. Global structural changes of an ion channel during its gating are followed by ion mobility mass spectrometry. Proceedings of the National Academy of Sciences of the United States of America 111, 17170–17175 (2014). [DOI] [PMC free article] [PubMed] [Google Scholar]
- 17.Marcoux J et al. Mass spectrometry reveals synergistic effects of nucleotides, lipids, and drugs binding to a multidrug resistance efflux pump. Proceedings of the National Academy of Sciences of the United States of America 110, 9704–9709 (2013). [DOI] [PMC free article] [PubMed] [Google Scholar]
- 18.Vahidi S, Bi Y, Dunn SD & Konermann L Load-dependent destabilization of the gamma-rotor shaft in FOF1 ATP synthase revealed by hydrogen/deuterium-exchange mass spectrometry. Proceedings of the National Academy of Sciences of the United States of America 113, 2412–2417 (2016). [DOI] [PMC free article] [PubMed] [Google Scholar]
- 19.Li S, Lee SY & Chung KY Conformational analysis of g protein-coupled receptor signaling by hydrogen/deuterium exchange mass spectrometry. Methods in enzymology 557, 261–278 (2015). [DOI] [PubMed] [Google Scholar]
- 20.Mehmood S, Domene C, Forest E & Jault JM Dynamics of a bacterial multidrug ABC transporter in the inward- and outward-facing conformations. Proceedings of the National Academy of Sciences of the United States of America 109, 10832–10836 (2012). [DOI] [PMC free article] [PubMed] [Google Scholar]
- 21.Zhou M et al. Ion mobility-mass spectrometry of a rotary ATPase reveals ATP-induced reduction in conformational flexibility. Nat Chem 6, 208–215 (2014). [DOI] [PMC free article] [PubMed] [Google Scholar]
- 22.Eisinger ML, Dorrbaum AR, Michel H, Padan E & Langer JD Ligand-induced conformational dynamics of the Escherichia coli Na(+)/H(+) antiporter NhaA revealed by hydrogen/deuterium exchange mass spectrometry. Proceedings of the National Academy of Sciences of the United States of America 114, 11691–11696 (2017). [DOI] [PMC free article] [PubMed] [Google Scholar]
- 23.Merkle PS et al. Substrate-modulated unwinding of transmembrane helices in the NSS transporter LeuT. Science advances 4, eaar6179 (2018). [DOI] [PMC free article] [PubMed] [Google Scholar]
- 24.Vadas O & Burke JE Probing the dynamic regulation of peripheral membrane proteins using hydrogen deuterium exchange-MS (HDX-MS). Biochemical Society transactions 43, 773–786 (2015). [DOI] [PubMed] [Google Scholar]
- 25.Reading E et al. Interrogating Membrane Protein Conformational Dynamics within Native Lipid Compositions. Angewandte Chemie 56, 15654–15657 (2017). [DOI] [PubMed] [Google Scholar]
- 26.Hebling CM et al. Conformational analysis of membrane proteins in phospholipid bilayer nanodiscs by hydrogen exchange mass spectrometry. Analytical chemistry 82, 5415–5419 (2010). [DOI] [PMC free article] [PubMed] [Google Scholar]
- 27.Adhikary S et al. Conformational dynamics of a neurotransmitter:sodium symporter in a lipid bilayer. Proceedings of the National Academy of Sciences of the United States of America 114, E1786–E1795 (2017). [DOI] [PMC free article] [PubMed] [Google Scholar]
- 28.Duc NM et al. Effective application of bicelles for conformational analysis of G protein-coupled receptors by hydrogen/deuterium exchange mass spectrometry. Journal of the American Society for Mass Spectrometry 26, 808–817 (2015). [DOI] [PMC free article] [PubMed] [Google Scholar]
- 29.Schuler MA, Denisov IG & Sligar SG Nanodiscs as a new tool to examine lipid-protein interactions. Methods in molecular biology 974, 415–433 (2013). [DOI] [PMC free article] [PubMed] [Google Scholar]
- 30.Keener JE et al. Chemical additives enable native mass spectrometry measurement of membrane protein oligomeric state within intact nanodiscs. Journal of the American Chemical Society (2018). [DOI] [PMC free article] [PubMed] [Google Scholar]
- 31.Marty MT, Hoi KK, Gault J & Robinson CV Probing the Lipid Annular Belt by Gas-Phase Dissociation of Membrane Proteins in Nanodiscs. Angewandte Chemie 55, 550–554 (2016). [DOI] [PMC free article] [PubMed] [Google Scholar]
- 32.Marrink SJ et al. Computational Modeling of Realistic Cell Membranes. Chemical reviews (2019). [DOI] [PMC free article] [PubMed] [Google Scholar]
- 33.Wen PC et al. Microscopic view of lipids and their diverse biological functions. Current opinion in structural biology 51, 177–186 (2018). [DOI] [PMC free article] [PubMed] [Google Scholar]
- 34.Contreras FX et al. Molecular recognition of a single sphingolipid species by a protein’s transmembrane domain. Nature 481, 525–529 (2012). [DOI] [PubMed] [Google Scholar]
- 35.Zeppelin T, Ladefoged LK, Sinning S, Periole X & Schiott B A direct interaction of cholesterol with the dopamine transporter prevents its out-to-inward transition. PLoS computational biology 14, e1005907 (2018). [DOI] [PMC free article] [PubMed] [Google Scholar]
- 36.Hedger G & Sansom MSP Lipid interaction sites on channels, transporters and receptors: Recent insights from molecular dynamics simulations. Biochimica et biophysica acta 1858, 2390–2400 (2016). [DOI] [PMC free article] [PubMed] [Google Scholar]
- 37.Salas-Estrada LA, Leioatts N, Romo TD & Grossfield A Lipids Alter Rhodopsin Function via Ligand-like and Solvent-like Interactions. Biophysical journal 114, 355–367 (2018). [DOI] [PMC free article] [PubMed] [Google Scholar]
- 38.Yellen G The voltage-gated potassium channels and their relatives. Nature 419, 35–42 (2002). [DOI] [PubMed] [Google Scholar]
- 39.Gurevich VV & Gurevich EV Molecular Mechanisms of GPCR Signaling: A Structural Perspective. International journal of molecular sciences 18 (2017). [DOI] [PMC free article] [PubMed] [Google Scholar]
- 40.Drew D & Boudker O Shared Molecular Mechanisms of Membrane Transporters. Annual review of biochemistry 85, 543–572 (2016). [DOI] [PubMed] [Google Scholar]
- 41.Denisov IG & Sligar SG Nanodiscs in Membrane Biochemistry and Biophysics. Chemical reviews 117, 4669–4713 (2017). [DOI] [PMC free article] [PubMed] [Google Scholar]
- 42.Lau AMC, Ahdash Z, Martens C & Politis A Deuteros: software for rapid analysis and visualization of data from differential hydrogen deuterium exchange-mass spectrometry. Bioinformatics (2019). [DOI] [PMC free article] [PubMed] [Google Scholar]
- 43.Manna M et al. Mechanism of allosteric regulation of beta2-adrenergic receptor by cholesterol. eLife 5 (2016). [DOI] [PMC free article] [PubMed] [Google Scholar]
- 44.Guixa-Gonzalez R et al. Membrane cholesterol access into a G-protein-coupled receptor. Nature communications 8, 14505 (2017). [DOI] [PMC free article] [PubMed] [Google Scholar]
- 45.Klauda JB et al. Update of the CHARMM all-atom additive force field for lipids: validation on six lipid types. The journal of physical chemistry. B 114, 7830–7843 (2010). [DOI] [PMC free article] [PubMed] [Google Scholar]
- 46.Phillips JC et al. Scalable molecular dynamics with NAMD. Journal of computational chemistry 26, 1781–1802 (2005). [DOI] [PMC free article] [PubMed] [Google Scholar]
- 47.Humphrey W, Dalke A & Schulten K VMD: visual molecular dynamics. Journal of molecular graphics 14, 33–38, 27–38 (1996). [DOI] [PubMed] [Google Scholar]
- 48.Jo S, Kim T, Iyer VG & Im W CHARMM-GUI: a web-based graphical user interface for CHARMM. Journal of computational chemistry 29, 1859–1865 (2008). [DOI] [PubMed] [Google Scholar]
- 49.Lomize MA, Pogozheva ID, Joo H, Mosberg HI & Lomize AL OPM database and PPM web server: resources for positioning of proteins in membranes. Nucleic acids research 40, D370–376 (2012). [DOI] [PMC free article] [PubMed] [Google Scholar]
- 50.Kandt C, Ash WL & Tieleman DP Setting up and running molecular dynamics simulations of membrane proteins. Methods 41, 475–488 (2007). [DOI] [PubMed] [Google Scholar]
- 51.Sun L et al. Crystal structure of a bacterial homologue of glucose transporters GLUT1–4. Nature 490, 361–366 (2012). [DOI] [PubMed] [Google Scholar]
- 52.Abramson J et al. Structure and mechanism of the lactose permease of Escherichia coli. Science 301, 610–615 (2003). [DOI] [PubMed] [Google Scholar]
- 53.Denisov IG, Grinkova YV, Lazarides AA & Sligar SG Directed self-assembly of monodisperse phospholipid bilayer Nanodiscs with controlled size. Journal of the American Chemical Society 126, 3477–3487 (2004). [DOI] [PubMed] [Google Scholar]
- 54.Distler U, Kuharev J & Tenzer S Biomedical applications of ion mobility-enhanced data-independent acquisition-based label-free quantitative proteomics. Expert review of proteomics 11, 675–684 (2014). [DOI] [PubMed] [Google Scholar]
- 55.Denisov IG & Sligar SG Nanodiscs for structural and functional studies of membrane proteins. Nature structural & molecular biology 23, 481–486 (2016). [DOI] [PMC free article] [PubMed] [Google Scholar]
- 56.Bayburt TH & Sligar SG Membrane protein assembly into Nanodiscs. FEBS Lett 584, 1721–1727 (2010). [DOI] [PMC free article] [PubMed] [Google Scholar]
- 57.Ritchie TK et al. Chapter 11 - Reconstitution of membrane proteins in phospholipid bilayer nanodiscs. Methods in enzymology 464, 211–231 (2009). [DOI] [PMC free article] [PubMed] [Google Scholar]
- 58.Martens C et al. Lipids modulate the conformational dynamics of a secondary multidrug transporter. Nature structural & molecular biology 23, 744–751 (2016). [DOI] [PMC free article] [PubMed] [Google Scholar]
- 59.Sohlenkamp C & Geiger O Bacterial membrane lipids: diversity in structures and pathways. FEMS Microbiol Rev (2015). [DOI] [PubMed] [Google Scholar]