

INTRODUCTION
Across the ideological spectrum, there is broad agreement that a key objective of healthcare finance reform in the United States should be to more closely link reimbursement to quality and value of care. To this end, the Centers for Medicare and Medicaid Services (CMS) is moving rapidly towards its goal of tying at least 50% of reimbursement to alternative payments models by the end of 2018.1 In general, these payment experiments ask providers to take some responsibility for the total costs of entire episodes of care, including not only hospitalization costs but other expenses as well. The hope that better care coordination and emphasis on quality will ultimately reduce costs is best embodied by Accountable Care Organizations (ACOs). ACOs have proliferated rapidly, covering more than 32 million Americans,2 and early results suggest that they have had some success in reducing total healthcare spending.3
While several studies have evaluated the effects of ACOs on spending and quality in medical populations,3–9 evidence for decreased expenditures or improved outcomes under ACOs in surgical populations is much more limited. Early efforts of nascent ACOs focused heavily on primary care and chronic disease, with limited engagement of surgeons.10 However, more contemporary data indicate that over 20% of U.S. surgeons participate in at least one ACO.11 Furthermore, surgery accounts for 50% of total hospital expenditures and 30% of total healthcare costs.12, 13 Given the large fraction of healthcare expenditures attributable to surgical care, ACOs must tackle surgical quality improvement and cost reduction if they are to build on their gains in chronic disease management. In theory, ACO-affiliated hospitals would be well-positioned and motivated to prioritize surgical quality improvement and cost efficiency. Whether they have done so successfully remains unknown. The literature that does exist for surgical populations (e.g., cancer surgery) includes very limited follow up, as short as one year.14 A longer duration of ACO enrollment may be required to demonstrate salient effects.
In this study, we sought to evaluate whether hospital participation in the largest CMS ACO program, the Medicare Shared Savings Program (MSSP), was associated with changes in Medicare spending or perioperative outcomes for major inpatient surgery. We compared Medicare spending and outcomes for patients treated before and after hospital ACO participation. We accounted for secular trends using a difference-in-differences analysis that included a similar cohort of patients treated at matched non-ACO hospitals. We evaluated the impact of hospital ACO participation for six common, high-risk surgical procedures in the national Medicare population. We hypothesized that, despite the theoretical benefits of ACO participation, treatment at ACO hospitals would not be associated with changes in Medicare spending or perioperative outcomes for major inpatient surgery.
METHODS
Data Sources and Study Population
We used data from the 100% Medicare Provider Analysis and Review (MEDPAR) File to identify Medicare beneficiaries aged 65–99 years undergoing elective surgery during the years 2010 to November 2014 to allow 30-day follow-up time for all patients. We included patients undergoing non-ruptured abdominal aortic aneurysm (AAA) repair, colectomy for cancer, coronary artery bypass grafting (CABG), total hip replacement (excluding fractures and malignancies), total knee replacement (excluding malignancies), and lung resection, as identified by ICD-9-CM procedure codes. Patients without concurrent Medicare Part A & B enrollment for at least 3 months before and 6 months after surgery were excluded, as were patients enrolled in Medicare managed care plans. Only elective admissions for surgery from acute care and critical access hospitals with at least 20 or more of the 6 procedures in total per year were included, and patients with pre-operative length of stay > 1 day, urgent/emergent admissions, or multiple procedures during the same admission were excluded. Patients who were transferred and discharged against medical advice were also excluded. Data from the MEDPAR file were linked to other claims data (Carrier, Outpatient and Home Health Agency (HHA)) to assess total Medicare payments. Hospital characteristics were assessed by linkage to data from the American Hospital Association Annual Survey. The study was approved by the University of Michigan Institutional Review Board.
Propensity Score Matching
The main exposure variable was the MSSP ACO participation status of the hospital performing the index surgical procedure as of the date that procedure was performed. Because ACO and non-ACO hospitals were likely to differ in ways that might confound the relationship of ACO participation with surgical costs,15 we used logistic regression to construct a propensity score model incorporating geographic region, procedure volume, profit status, and hospital technology status. We also examined balance in hospital teaching status, bed size, nurse ratio, and Medicaid patient-days normalized to total patient-days, but they were not included in the propensity score model. ACO hospitals were then matched 1:3 with non-ACO hospitals based on the propensity score, and differences in hospital-level variables were examined to ensure adequate balance. Non-ACO hospitals were assigned the same “date of entry” as their matched ACO hospitals for further analyses.
Outcome Variables
The primary outcome was total Medicare payment for the entire surgical episode, including the index hospitalization (diagnosis related group and outlier payments), readmissions, physician services, and post-acute care, beginning with the index hospitalization and extending to 30 days after discharge. Payments were also price-standardized in order to remove differences in payment not directly related to utilization, including geographic (wage index), Disproportionate Share Hospital (DSH), and Indirect Medical Education (IME) adjustments. This study used methods previously described by the Medicare Payment Advisory Commission16 and the Dartmouth Institute,17, 18 as have multiple previous studies of Medicare payments for surgical procedures.19–21 All payments were inflation-adjusted to 2014 dollars.
Secondary outcome variables included 30-day mortality, complications, serious complications, and readmissions. Complications were determined from primary and secondary ICD-9-CM diagnosis and procedure codes that have been used in multiple previous studies and have been demonstrated to have high sensitivity and specificity in surgical populations.19, 22–24 Serious complications were defined as those associated with an extended length of stay beyond the 75 percentile for that procedure. Because most patients without complications are discharged earlier, the addition of the extended length of stay criterion was intended to increase the specificity of the outcome variable.19, 24–26
Statistical Analysis
We implemented a difference-in-differences analysis in order to assess whether ACO participation was associated with changes in Medicare payments for inpatient surgery, independent of temporal trends in surgical payments regardless of hospital ACO participation.27 First, a hierarchical linear model was used to model price-adjusted episode payments at the patient level, with hospital-level random effects. Payments were risk-adjusted for patient age, sex, race, individual Elixhauser comorbidities,28 year of procedure, type of procedure, minimally invasive approach (i.e., endovascular AAA repair, laparoscopic colectomy, or thoracoscopic lung resection), and the hospital-level variables listed above. An indicator variable was then included to specify whether the patient’s surgery was performed at an ACO or non-ACO (control) hospital within the propensity-matched cohort. A time variable was included to indicate whether surgery occurred before or after ACO participation based on the date of entry (pre-post analysis). An interaction term between ACO participation and the time variable was then added to indicate whether ACO participation was significantly associated with changes in payments beyond those accounted for by time trends alone.
In order to assess for lagged effects, we performed an additional analysis to allow for the possibility that payments could vary based on duration of ACO participation. This model also tested the sensitivity of our primary pre-post analysis to an alternate specification of post-enrollment effects. For this analysis, we used a time variable indicating years since ACO enrollment (pre-ACO and years 1, 2, and 3 of participation, specified as indicator variables so as not to assume a linear effect). Again, the interactions between ACO participation and these time variables were assessed.
For analysis of binary secondary outcomes, hierarchical logistic regression models with hospital-level random effects were specified using the same covariates. As a sensitivity analysis, generalized estimation equations were also used to assess binary outcomes, and in all cases the inferences were the same.
Statistical analyses were performed using Stata 15 (StataCorp LLC, College Station, TX). Statistical significance was determined by a two-sided P-value of < 0.05.
RESULTS
The initial hospital cohort included 427 ACO hospitals and 3,090 non-ACO hospitals (Table 1). Before matching, there were some significant differences in hospital characteristics (Table 1). Propensity score matching allowed the 427 ACO hospitals to be matched to 1,531 non-ACO hospitals. After propensity score matching, no significant differences in these hospital-level variables remained. Similarly, there were no major differences in patient characteristics between these groups (Table 2). Standardized mean differences in hospital and patient characteristics between ACO and non-ACO cohorts were < 0.1 for all variables after matching. Propensity score-based matching of hospitals resulted in a study cohort of 341,678 patients at ACO hospitals and 1,024,095 at non-ACO hospitals. The study cohort included 62,584 AAA repairs (86% endovascular), 228,595 colectomies (31% laparoscopic), 120,712 CABG, 228,334 hip replacements, 641,560 knee replacements, and 83,980 lung resections (57% thoracoscopic). Among 427 ACO hospitals, post-enrollment payment data were available for 1 year of participation in 423, 2 years in 327, and 3 years in 161.
Table 1.
Hospital characteristics before and after propensity score matching, ACO versus non-ACO hospitals
| Before matching | After matching | Weighted standardized difference | ||||||
|---|---|---|---|---|---|---|---|---|
| ACO | Non-ACO | P-value | ACO | Non-ACO | P-value | Before matching | After matching | |
| Number of hospitals | 427 | 3,090 | 427 | 1,529 | ||||
| Number of patients | 341,675 | 1,861,428 | 341,675 | 1,024,090 | ||||
| Geographic region (%) | ||||||||
| Northeast | 26.7 | 13.8 | < 0.001 | 26.7 | 29.7 | 0.336 | 0.3244 | −0.0748 |
| West | 12.6 | 20.8 | < 0.001 | 12.6 | 15.7 | 0.206 | −0.2191 | −0.0813 |
| Midwest | 35.4 | 27.3 | 0.001 | 35.4 | 32.3 | 0.338 | 0.1748 | 0.0672 |
| South | 25.3 | 38.1 | < 0.001 | 25.3 | 22.4 | 0.324 | −0.2782 | 0.0625 |
| Procedure volume quintile (%) | ||||||||
| 1st | 10.5 | 21.4 | 0.935 | 10.5 | 10.7 | 0.935 | −0.3002 | −0.0047 |
| 2nd | 14.1 | 20.8 | 0.001 | 14.1 | 12.1 | 0.392 | −0.1779 | 0.0523 |
| 3rd | 18.3 | 20.2 | 0.343 | 18.3 | 19.4 | 0.677 | −0.0497 | −0.0283 |
| 4th | 23.0 | 19.5 | 0.099 | 23.0 | 26.0 | 0.296 | 0.0832 | −0.0753 |
| 5th | 34.2 | 18.0 | < 0.001 | 34.2 | 31.8 | 0.458 | 0.3742 | 0.0553 |
| Technology hospital (%) | 71.8 | 46.3 | < 0.001 | 71.8 | 70.4 | 0.639 | 0.5596 | 0.0306 |
| Profit status (%) | ||||||||
| For-Profit | 4.5 | 22.8 | < 0.001 | 4.5 | 4.6 | 0.962 | −0.5669 | −0.0020 |
| Non-Profit | 88.0 | 60.5 | < 0.001 | 88.0 | 88.9 | 0.677 | 0.6774 | −0.0218 |
| Other | 7.5 | 16.7 | < 0.001 | 7.5 | 6.5 | 0.581 | −0.2913 | 0.0299 |
| Bed size (%)1 | ||||||||
| < 250 beds | 55.0 | 73.571 | <0.001 | 55.0 | 58.6 | 0.270 | −0.4053 | −0.0795 |
| > 250 to < 500 beds | 30.9 | 19.626 | <0.001 | 30.9 | 29.1 | 0.547 | 0.2738 | 0.0438 |
| > 500 beds | 14.1 | 6.8 | <0.001 | 14.098 | 12.3 | 0.415 | 0.2466 | 0.0622 |
| Teaching hospital (%)1 | 53.2 | 34.0 | <0.001 | 53.197 | 49.6 | 0.266 | 0.4231 | 0.0784 |
| Nurse ratio1 | 8.9 | 9.8 | 0.016 | 8.8655 | 8.8 | 0.946 | −0.1441 | 0.0034 |
| % Medicaid days1,2 | 19.1 | 18.9 | 0.729 | 19.14 | 18.4 | 0.362 | 0.0181 | 0.0594 |
Variables not used in propensity score matching.
Medicaid patient-days normalized to total patient-days
Table 2.
Patient characteristics before and after propensity score matching, ACO versus non-ACO hospitals
| Before matching | After matching | Weighted standardized difference | ||||||
|---|---|---|---|---|---|---|---|---|
| ACO | Non-ACO | P-value | ACO | Non-ACO | P-value | Before matching | After matching | |
| Number of patients | 341,675 | 1,861,428 | 341,675 | 1,024,090 | ||||
| Number of hospitals | 427 | 3,090 | 427 | 1,529 | ||||
| Age, mean (years) | 74.9 | 75.0 | 0.001 | 74.9 | 75.0 | < 0.001 | −0.0064 | −0.0154 |
| Male, % | 42.0 | 42.4 | < 0.001 | 42.0 | 42.9 | < 0.001 | −0.0096 | −0.0179 |
| White race, % | 92.2 | 91.5 | < 0.001 | 92.2 | 92.0 | < 0.001 | 0.0262 | 0.0069 |
| Elixhauser Comorbidities (%) | ||||||||
| 0–1 | 31.6 | 33.0 | < 0.001 | 31.6 | 31.2 | < 0.001 | −0.0299 | 0.0078 |
| 2 | 26.1 | 26.9 | < 0.001 | 26.1 | 26.2 | 0.400 | −0.0163 | −0.0017 |
| ≥ 3 | 42.3 | 40.1 | < 0.001 | 42.3 | 42.5 | 0.003 | 0.043 | −0.0058 |
Risk-adjusted mean total payments were similar prior to enrollment for both ACO ($23,447, CI95%: $23,182, $23,712) and non-ACO ($23,337, CI95%: $23,193, $23,480) hospitals (Table 3). Individual components of payment were also similar, including payments for the index admission, readmissions, physician services, and post-acute care. In the pre-post analysis, there was no significant change in payments after enrollment for ACO or non-ACO hospitals. The difference-in-differences estimate for this analysis was −$72 (CI95%: −$228, +$84), indicating no net change in payments associated with ACO enrollment after accounting for underlying temporal trends. Similarly, there were no significant differences in individual components of payments. When payments were modeled as a function of years since ACO enrollment, there remained no significant association with payments up to 3 years post-enrollment (Figure 1).
Table 3.
Changes in payments associated with ACO enrollment, pre-post difference-in-differences (DID) analysis
| Risk-adjusted average payment ($) | Pre-post analysis, change in payment ($) | DID analysis, change in payment ($) | |||||
|---|---|---|---|---|---|---|---|
| ACO | Non-ACO | ACO | Non-ACO | ||||
| Before enrollment | After enrollment | Before enrollment | After enrollment | After vs. before enrollment | After vs. before enrollment | ||
| Total payment | 23447 (23182 to 23712) |
23451 (23194 to 23708) |
23337 (23193 to 23480) |
23413 (23267 to 23559) |
4 (−155 to 164) |
76 (−30 to 182) |
−72 (−228 to 84) |
| Index hospitalization | 15043 (14917 to 15169) |
15113 (15001 to 15225) |
15065 (14993 to 15137) | 15134 (15062 to 15206) |
69 (−20 to 159) |
69 (1 to 137) |
1 (−88 to 89) |
| Readmissions | 9385 (9184 to 9585) |
9285 (9063 to 9508) |
9274 (9153 to 9396) |
9457 (9315 to 9600) |
−99 (−416 to 217) |
183 (−21 to 387) |
−282 (−588 to 23) |
| Physician services | 3233 (3183 to 3283) |
3223 (3173 to 3272) |
3238 (3213 to 3263) |
3208 (3181 to 3234) |
−10 (−34 to 14) |
−30 (−46 to −14) |
20 (−5 to 45) |
| Post-acute care | 6262 (6083 to 6442) |
6269 (6086 to 6452) |
6188 (6088 to 6288) |
6256 (6154 to 6358) |
7 (−93 to 107) |
68 (1 to 135) |
−61 (−160 to 38) |
95% confidence intervals given in parentheses.
Figure 1.
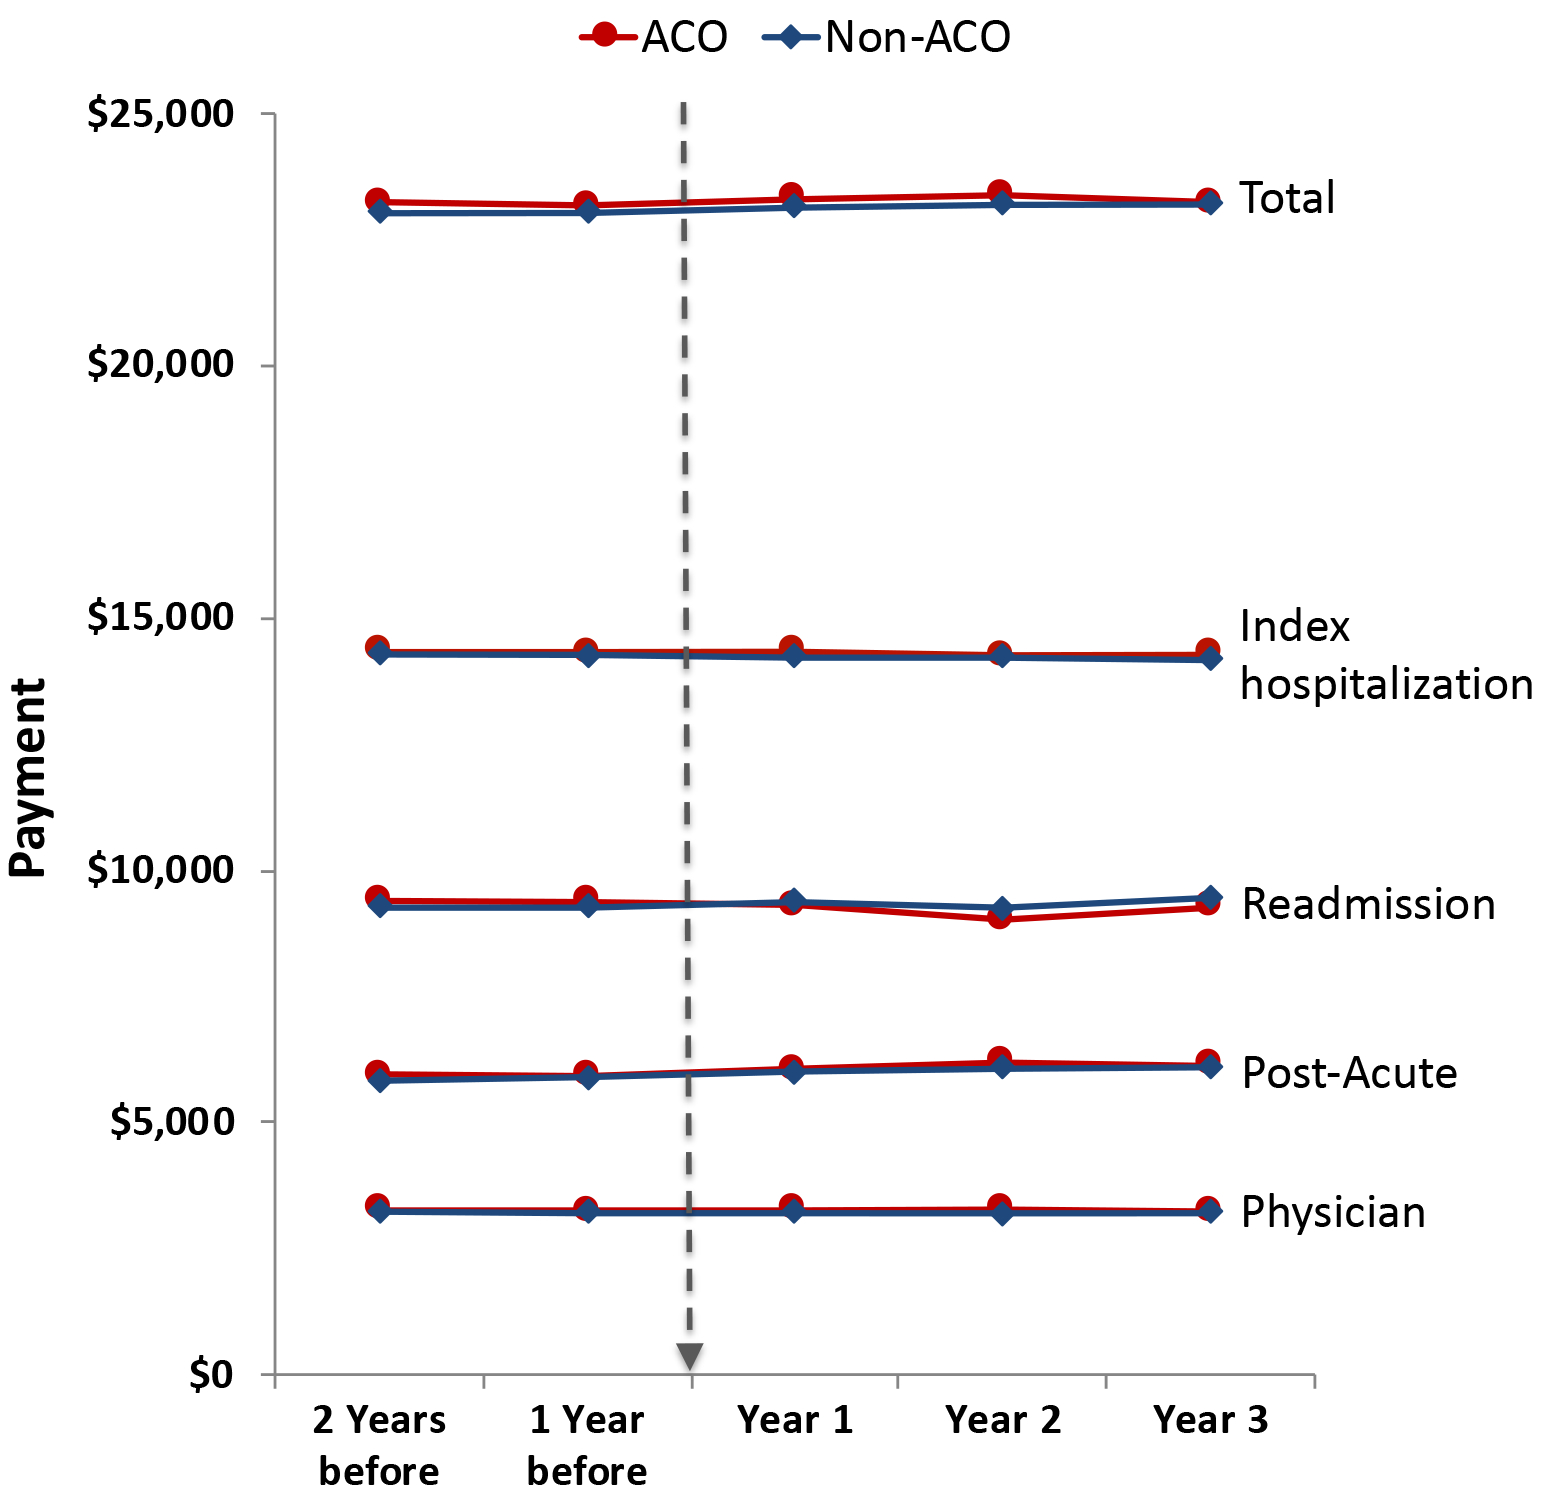
Differences between ACO and non-ACO hospitals in Medicare 30-day surgical episode payments for 2 years before and 3 years after ACO enrollment (dotted arrow).
Similarly, there was no association between ACO participation and perioperative outcomes (Table 4). No significant changes in mortality, complications, serious complications, or readmissions were observed in either the ACO or non-ACO groups between the pre- and post-enrollment periods. As with the payment analysis, difference-in-differences relative risk (RR) estimates indicated that ACO enrollment was not associated with changes in any perioperative outcomes after accounting for underlying temporal trends. In the pre-post analysis, ACO participation conferred no advantage with respect to mortality (RR 0.96, CI95%: 0.91, 1.01), complications (RR 1.00, CI95%: 0.98, 1.02), serious complications (RR 1.00, CI95%: RR 0.97, 1.02) or readmissions (RR 0.99, CI95%: 0.97, 1.02). When time since ACO enrollment was considered, there was no evidence that accumulated improvements with increasing duration of ACO participation resulted in significantly improved perioperative outcomes (Figure 2).
Table 4.
Changes in clinical outcomes associated with ACO enrollment, pre-post difference-in-differences (DID) analysis
| Risk-adjusted rates (%) | Pre-post analysis, RR | DID analysis, RR | |||||
|---|---|---|---|---|---|---|---|
| ACO | Non-ACO | ACO | Non-ACO | ||||
| Before enrollment | After enrollment | Before enrollment | After enrollment | After vs. before enrollment | After vs. before enrollment | ||
| Mortality | 2.35 (2.24, 2.45) |
2.3 (2.19, 2.41) |
2.32 (2.26, 2.39) |
2.37 (2.3, 2.44) |
0.98 (0.93, 1.03) |
1.02 (0.98, 1.06) |
0.96 (0.91, 1.01) |
| Any complications | 13.02 (12.69, 13.35) |
12.87 (12.54, 13.2) |
12.49 (12.3, 12.69) |
12.31 (12.11, 12.51) |
0.99 (0.97, 1.01) |
0.99 (0.97, 1) |
1.00 (0.98, 1.02) |
| Serious complications | 6.86 (6.62, 7.1) |
6.8 (6.56, 7.05) |
6.79 (6.65, 6.94) |
6.76 (6.61, 6.91) |
0.99 (0.96, 1.02) |
0.99 (0.97, 1.02) |
1.00 (0.97, 1.02) |
| Readmissions | 9.56 (9.33, 9.8) |
9.49 (9.25, 9.74) |
9.57 (9.42, 9.72) |
9.58 (9.42, 9.74) |
0.99 (0.97, 1.02) |
1.00 (0.98, 1.02) |
0.99 (0.97, 1.02) |
95% confidence intervals given in parentheses.
RR: relative risk
Figure 2.
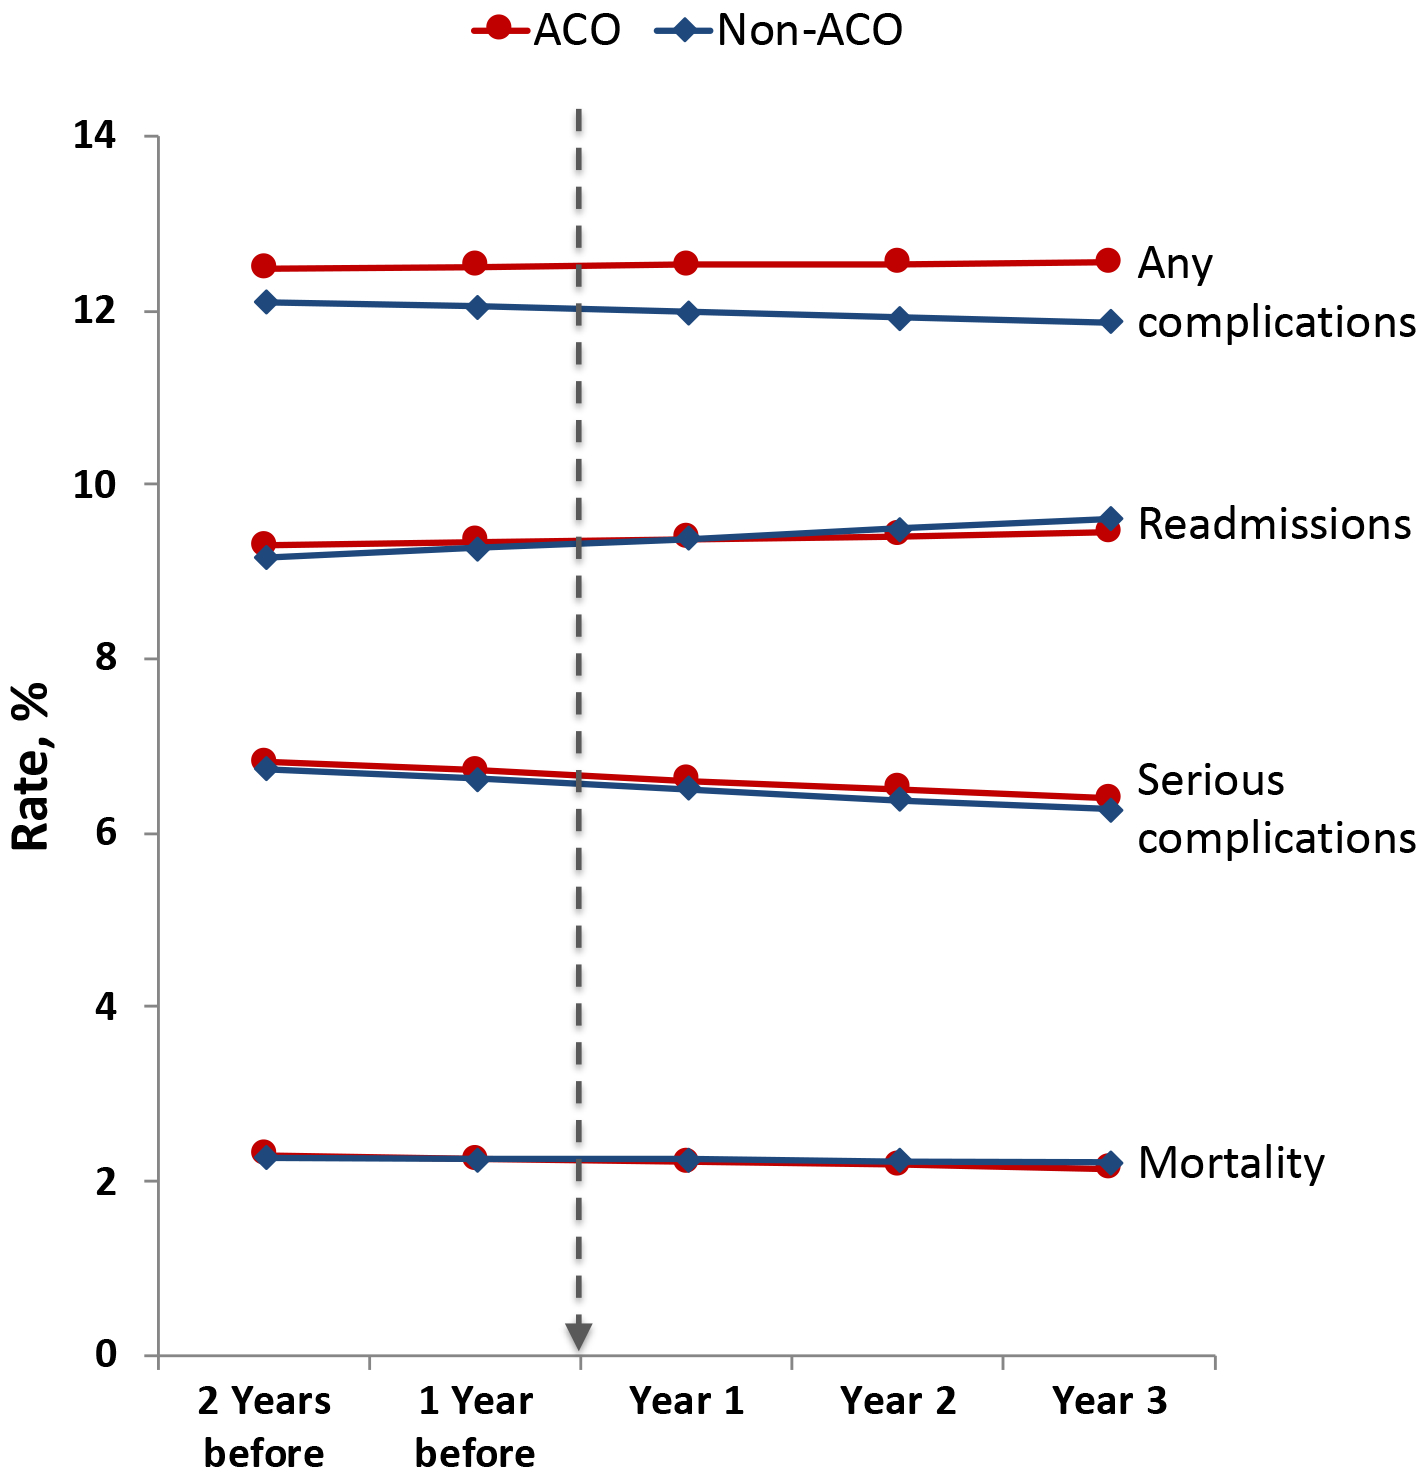
Differences between ACO and non-ACO hospitals in perioperative outcomes for 2 years before and 3 years after ACO enrollment (dotted arrow).
Finally, we performed similar analyses for each procedure individually in order to ensure that heterogeneity of ACO effect by procedure type was not overlooked. In these analyses, there was no evidence of significant changes in total payments, individual components of payments, or perioperative outcomes for any of the procedures.
DISCUSSION
In this analysis, hospital participation in Medicare SSP ACOs was not associated with decreased Medicare spending for 6 inpatient surgical procedures during the first three years of ACO participation. This finding was consistent across all 4 individual components of total episode payments, including payments for the index hospitalization, readmissions, physician services, and post-acute care. Furthermore, no difference was apparent even when duration of hospital participation in the ACO was considered. When mortality, complication, and readmission rates were analyzed, there again were no changes associated with hospital ACO participation. These findings suggest that, in their early implementation period, Medicare SSP ACOs have been ineffective at the hospital level in decreasing surgical expenditures and improving surgical quality.
Previous studies have confirmed that Medicare SSP ACOs have had modest early success in reducing aggregate healthcare expenditures for their beneficiaries.3 Savings have generally increased with additional experience in the program. Despite the fact that 46% of early Medicare ACOs included hospitals,29 no previous studies have examined the impact of hospital ACO participation on healthcare costs. Hospital ACO participation may be particularly important in influencing expenditures for discrete episodes of care such as inpatient surgery by improving the quality of inpatient care, facilitating clinical coordination, limiting use of post-acute care services, and reducing readmissions. Despite these theoretical advantages, our analysis demonstrates that ACO-affiliated hospitals did not achieve savings for any of the 6 procedures studied.
Some previous work has demonstrated clinical improvements associated with hospital participation in ACOs, although results have been mixed. Among medical populations, hospital participation in SSP ACOs has been associated with reductions in readmission30, 31 but not with improved performance in the Hospital Value-Based Purchasing (HVBP) Program or Hospital-Acquired Conditions (HAC) Reduction Program.31 With respect to surgical care, ACO-affiliated hospitals have not improved perioperative outcomes for patients undergoing major cancer surgery.14 We found that perioperative outcomes—including 30-day mortality, complications, and readmissions—did improve at ACO-affiliated hospitals over the study period. However, these improvements were no different than those seen at non-ACO hospitals, suggesting that secular trends or other CMS policies were responsible for the observed effects.
Our study must be interpreted in the context of several limitations. First, hospitals that participate in ACOs may have conflicting incentives with respect to elective surgery. While reducing utilization of surgery altogether may lower overall costs of care and lead to incentives for the ACOs, these would come at the cost of hospital revenue for the procedure. Our analysis did not address this conflict, but rather assessed Medicare expenditures after the decision to perform a procedure had already been made. Second, the nature and significance of hospital participation in ACOs may vary, and as such may result in heterogeneity in the impact on healthcare costs. A detailed exploration of how ACO affiliation may reflect and in turn influence a hospital’s culture of quality, care efficiency, and structural characteristics was outside the scope of this analysis but should be explored in future work. Third, risk adjustment using administrative data is inherently limited. Although we observed no significant differences across a broad range of patient characteristics, both before and after matching, unobserved differences in patient risk, disease severity, or procedural complexity could have biased our findings. However, we have no evidence to suggest that hospitals that participate in ACOs treat patients who are systematically different from those treated at non-ACO hospitals. If the observed null effect in this study resulted from underlying improvements by ACO hospitals being confounded by inadequate risk adjustment, this would suggest that ACO hospitals were selecting higher-risk patients, which is highly unlikely. Finally, our study was limited to MSSP ACOs, and our findings may not be generalizable to other Medicare ACOs or private ACOs. However, MSSP is the dominant ACO program in the United States.
Given the large proportion of total healthcare costs attributable to surgical care, ACOs will ultimately need to broaden their focus to include surgery and other episodic care. Ironically, elective inpatient surgery should be an ideal target for cost-saving measures. ACOs could take advantage of cost variation at a local level32 and within integrated health systems in order to selectively triage patients undergoing elective surgery to high-quality, low-cost providers. This would require a more intentional focus on surgical care, which early analyses suggest has been missing.10 With respect to ACO policy, the MSSP program could be modified by CMS in order to encourage attention to surgical expenditures. First, retrospective assignment of beneficiaries to ACOs during the period of this study may have hindered appropriate planning around episodic care. ACOs must know who their beneficiaries are if they are to optimize surgical costs, in particular if they wish to prospectively identify high-cost surgical patients for intervention.33, 34 Recently, prospective beneficiary assignment has been implemented, but its effects remain to be seen. In particular, there may be important interactions between beneficiary assignment to an ACO and hospital ACO affiliation that can ultimately influence quality and cost of surgical care. Second, there are conflicting incentives for hospitals that participate in ACOs. The revenue that is lost through cost reduction may not be offset by CMS shared savings bonus payments to ACOs. Alternately, if CMS does not intend for ACOs to reduce costs associated with surgical care, it might consider carving out these expenditures from MSSP spending calculations and rely on other existing initiatives, such as bundled payment programs, instead.
CONCLUSION
Hospital participation in MSSP ACOs was not associated with changes in Medicare spending or perioperative outcomes for major inpatient surgery during the first 3 years of ACO participation.
Research Support:
Agency for Healthcare Research and Quality (K08-HS-024763 to Dr. Nathan) and National Institute on Aging (R01-AG-039434 to Drs. Dimick, Ryan, and Nathan).
Footnotes
Disclosures: J.B.D. is the cofounder of ArborMetrix, a company that makes software for profiling hospital quality and efficiency.
REFERENCES
- 1.Burwell SM. Setting value-based payment goals--HHS efforts to improve U.S. health care. N Engl J Med 2015; 372(10):897–9. [DOI] [PubMed] [Google Scholar]
- 2.Muhlestein D, Saunders R, McClellan M. Growth Of ACOs and alternative payment models in 2017. Health Affairs Blog, Vol. 2017. [Google Scholar]
- 3.McWilliams JM, Hatfield LA, Chernew ME, et al. Early Performance of Accountable Care Organizations in Medicare. N Engl J Med 2016; 374(24):2357–66. [DOI] [PMC free article] [PubMed] [Google Scholar]
- 4.Busch AB, Huskamp HA, Kreider AR, et al. Medicare Accountable Care Organizations and Antidepressant Use by Patients With Depression. Psychiatr Serv 2017; 68(11):1193–1196. [DOI] [PMC free article] [PubMed] [Google Scholar]
- 5.Busch AB, Huskamp HA, McWilliams JM. Early Efforts By Medicare Accountable Care Organizations Have Limited Effect On Mental Illness Care And Management. Health Aff (Millwood) 2016; 35(7):1247–56. [DOI] [PubMed] [Google Scholar]
- 6.McWilliams JM, Gilstrap LG, Stevenson DG, et al. Changes in Postacute Care in the Medicare Shared Savings Program. JAMA Intern Med 2017; 177(4):518–526. [DOI] [PMC free article] [PubMed] [Google Scholar]
- 7.McWilliams JM, Landon BE, Chernew ME. Performance in Year 1 of Pioneer Accountable Care Organizations. N Engl J Med 2015; 373(8):777. [DOI] [PubMed] [Google Scholar]
- 8.McWilliams JM, Najafzadeh M, Shrank WH, et al. Association of Changes in Medication Use and Adherence With Accountable Care Organization Exposure in Patients With Cardiovascular Disease or Diabetes. JAMA Cardiol 2017; 2(9):1019–1023. [DOI] [PMC free article] [PubMed] [Google Scholar]
- 9.Rose S, Zaslavsky AM, McWilliams JM. Variation In Accountable Care Organization Spending And Sensitivity To Risk Adjustment: Implications For Benchmarking. Health Aff (Millwood) 2016; 35(3):440–8. [DOI] [PMC free article] [PubMed] [Google Scholar]
- 10.Dupree JM, Patel K, Singer SJ, et al. Attention to surgeons and surgical care is largely missing from early medicare accountable care organizations. Health Aff (Millwood) 2014; 33(6):972–9. [DOI] [PubMed] [Google Scholar]
- 11.Resnick MJ, Graves AJ, Buntin MB, et al. Surgeon Participation in Early Accountable Care Organizations. Ann Surg 2017. [DOI] [PubMed] [Google Scholar]
- 12.2013 Health Care Cost and Utilization Report 2014. Available at: http://www.healthcostinstitute.org/files/2013%20HCCUR%20Appendix%2010-28-14.pdf. Accessed May 10, 2015.
- 13.Munoz E, Munoz W 3rd, Wise L. National and surgical health care expenditures, 2005–2025. Ann Surg 2010; 251(2):195–200. [DOI] [PubMed] [Google Scholar]
- 14.Herrel LA, Norton EC, Hawken SR, et al. Early impact of Medicare accountable care organizations on cancer surgery outcomes. Cancer 2016; 122(17):2739–46. [DOI] [PMC free article] [PubMed] [Google Scholar]
- 15.Chukmaitov AS, Harless DW, Bazzoli GJ, et al. Factors associated with hospital participation in Centers for Medicare and Medicaid Services’ Accountable Care Organization programs. Health Care Manage Rev 2017. [DOI] [PMC free article] [PubMed] [Google Scholar]
- 16.Miller DC, Gust C, Dimick JB, et al. Large variations in Medicare payments for surgery highlight savings potential from bundled payment programs. Health Aff (Millwood) 2011; 30(11):2107–15. [DOI] [PMC free article] [PubMed] [Google Scholar]
- 17.Gottlieb DJ, Zhou W, Song Y, et al. Technical report: a standardized method for adjusting medicare expenditures for regional differences in prices 2010. Available at: http://www.dartmouthatlas.org/downloads/papers/std_prc_tech_report.pdf. Accessed September 26, 2017.
- 18.Gottlieb DJ, Zhou W, Song Y, et al. Prices don’t drive regional Medicare spending variations. Health Aff (Millwood) 2010; 29(3):537–43. [DOI] [PMC free article] [PubMed] [Google Scholar]
- 19.Osborne NH, Nicholas LH, Ryan AM, et al. Association of hospital participation in a quality reporting program with surgical outcomes and expenditures for Medicare beneficiaries. JAMA 2015; 313(5):496–504. [DOI] [PMC free article] [PubMed] [Google Scholar]
- 20.Birkmeyer JD, Gust C, Baser O, et al. Medicare payments for common inpatient procedures: implications for episode-based payment bundling. Health Serv Res 2010; 45(6 Pt 1):1783–95. [DOI] [PMC free article] [PubMed] [Google Scholar]
- 21.Ibrahim AM, Hughes TG, Thumma JR, et al. Association of Hospital Critical Access Status With Surgical Outcomes and Expenditures Among Medicare Beneficiaries. JAMA 2016; 315(19):2095–103. [DOI] [PubMed] [Google Scholar]
- 22.Iezzoni LI, Daley J, Heeren T, et al. Identifying Complications of Care Using Administrative Data. Medical Care 1994; 32(7):700–715. [DOI] [PubMed] [Google Scholar]
- 23.Weingart SN, Iezzoni LI, Davis RB, et al. Use of administrative data to find substandard care - Validation of the complications screening program. Medical Care 2000; 38(8):796–806. [DOI] [PubMed] [Google Scholar]
- 24.Dimick JB, Nicholas LH, Ryan AM, et al. Bariatric surgery complications before vs after implementation of a national policy restricting coverage to centers of excellence. JAMA 2013; 309(8):792–9. [DOI] [PMC free article] [PubMed] [Google Scholar]
- 25.Livingston EH. Procedure incidence and in-hospital complication rates of bariatric surgery in the United States. Am J Surg 2004; 188(2):105–10. [DOI] [PubMed] [Google Scholar]
- 26.Pradarelli JC, Healy MA, Osborne NH, et al. Variation in Medicare Expenditures for Treating Perioperative Complications: The Cost of Rescue. JAMA Surg 2016; 151(12):e163340. [DOI] [PubMed] [Google Scholar]
- 27.Dimick JB, Ryan AM. Methods for evaluating changes in health care policy: the difference-in-differences approach. JAMA 2014; 312(22):2401–2. [DOI] [PubMed] [Google Scholar]
- 28.Elixhauser A, Steiner C, Harris DR, et al. Comorbidity measures for use with administrative data. Med Care 1998; 36(1):8–27. [DOI] [PubMed] [Google Scholar]
- 29.Epstein AM, Jha AK, Orav EJ, et al. Analysis of early accountable care organizations defines patient, structural, cost, and quality-of-care characteristics. Health Aff (Millwood) 2014; 33(1):95–102. [DOI] [PubMed] [Google Scholar]
- 30.Ryan AM, Krinsky S, Adler-Milstein J, et al. Association Between Hospitals’ Engagement in Value-Based Reforms and Readmission Reduction in the Hospital Readmission Reduction Program. JAMA Intern Med 2017; 177(6):862–868. [DOI] [PMC free article] [PubMed] [Google Scholar]
- 31.Muhlestein D, Tu T, de Lisle K, et al. Hospital participation in ACOs associated with other value-based program improvement. Am J Manag Care 2016; 22(7):e241–8. [PubMed] [Google Scholar]
- 32.Nathan H, Thumma JR, Norton EC, et al. Strategies for Reducing Population Surgical Costs in Medicare: Local Referrals to Low-cost Hospitals. Ann Surg 2017. [DOI] [PubMed] [Google Scholar]
- 33.Shubeck SP, Thumma JR, Dimick JB, et al. Hospital quality, patient risk, and Medicare expenditures for cancer surgery. Cancer 2017. [DOI] [PubMed] [Google Scholar]
- 34.Shubeck SP, Thumma JR, Dimick JB, et al. Hot Spotting as a Strategy to Identify High-Cost Surgical Populations. Ann Surg 2018. [DOI] [PubMed] [Google Scholar]