Abstract
Background:
To respond adaptively in a dynamic environment, it is important for organisms to utilise information about recent events to decide between response options.
Methods:
To examine the role of medial prefrontal cortex in adaptive decision-making, we recorded single neuron activity in rats performing a dynamic delayed non-matching to position task.
Results:
We recorded activity from 1335 isolated neurons, 458 (34%) with criterion event-related activity, of which 431 (94%) exhibited 1 of 10 distinct excitatory response types: five at different times relative to delivery (or lack) of reinforcement following sample and choice responses and five correlated with movements or lever press actions that occurred multiple times in each trial. Normalised population averages revealed a precisely timed cascade of population responses representing the temporal organisation behavioural events that constitute delayed non-matching to position trials. Firing field analyses identified a subset of neurons with restricted spatial fields: responding to the conjunction of a behavioural event with a specific location. Anatomical analyses showed considerable overlap in the distribution of different response types in medial prefrontal cortex with a significant trend for dorsal areas to contain more neurons with action-related activity and ventral areas more responses related to action outcomes.
Conclusion:
These results indicate that medial prefrontal cortex contains discrete populations of neurons that represent the temporal organisation of actions and outcomes during delayed non-matching to position trials. They support the hypothesis that medial prefrontal cortex promotes flexible control of complex behaviours by action–outcome contingencies.
Keywords: Medial prefrontal cortex, decision-making, reinforcement, population analyses, single neuron activity, action–outcome representation, temporal organisation, flexible responding
Adaptive responding requires organisms to utilise up-to-date information to select actions likely to produce favourable outcomes. This process is modelled by delayed conditional discrimination tasks where reinforcement following a choice is based conditionally on information from a preceding sample. Lesions of rodent medial prefrontal cortex (mPFC) impair cognitive and executive processes that underlie adaptive decision-making (Chudasama, 2011; Dalley et al., 2004; Kesner and Churchwell, 2011). Questions remain about the activity of neurons that give rise to these abilities. Subregions of rodent mPFC have distinctive sets of afferent and efferent connections: dorsal mPFC is connected predominantly from sensorimotor areas that are crucial for preparing and selecting actions while ventral regions interact primarily with limbic areas that represent information about recent events, spatial context, and action outcomes (Condé et al., 1995; Heidbreder and Groenewegen, 2003; Hoover and Vertes, 2007; Sesack et al., 1989; Van Enden et al., 1992; Vertes, 2004). Lesions of dorsal mPFC impair delayed conditional discrimination where choice is defined by egocentric coordinates or motor response information but not for seemingly similar tasks where choice is defined by allocentric spatial location. By contrast, ventral mPFC lesions affect tasks measuring allocentric spatial and visual object memory spared by more dorsal lesions (Horst and Laubach, 2009; Kesner and Churchwell, 2011; Porter et al., 2000; Seamans et al., 1995; Young et al., 1996). Ventral mPFC lesions are also associated with deficits in supervisory attentional control and behavioural flexibility (Birrell and Brown, 2000; Boulougouris et al., 2007; Bussey et al., 1997; Dias and Aggleton, 2000; Raggozzino et al., 1999), spatial contextual control of reward learning (Ashwell and Ito, 2014), and action–outcome contingency (Bradfield et al., 2015; Corbit and Balleine, 2003; De Wit et al., 2006; Tran-Tu-Yen et al., 2009) that may underlie these effects.
To understand the contributions of dorsal and ventral mPFC to delayed conditional decision-making, we recorded neurons throughout mPFC in rats performing dynamic delayed non-matching to position (dDNMTP) using procedures shown to be sensitive to the effects of mPFC lesions (Porter et al., 2000; Porter and Mair, 1997). Trials consisted of a sequence involving four lever press responses, three movements between adjacent levers, and two reinforcement events so that neuronal activity could be compared during comparable behavioural events throughout dDNMTP trials. Each trial involved three levers in a T-configuration, 90° apart in an octagonal chamber. The location of the base lever, representing the stem of the T, was randomly selected for each trial so that behavioural events were not confounded with a specific location. An earlier study reported single unit analyses of mPFC neurons in rats performing dDNMTP where event-related activity was analysed by raster plots, peri-event time histogram (PETH), and spatial heat maps (Onos et al., 2016). Here results were examined for a larger population of mPFC neurons. PETH results were combined as normalised averages to compare population firing patterns for different response types, spatial coding properties were analysed by mapping the frequency of cell firing as a function of position as firing fields, and anatomical locations of recording sites were mapped throughout mPFC to compare the distribution of neurons with different spatial and event-related coding properties in dorsal and ventral mPFC.
Materials and methods
Subjects
Recordings were made from 11 male Long-Evans rats obtained from Harlan Laboratories (Boston, MA). Rats were 2–9 months old at the start of training, 5–13 months at the start of recording, and 10–17 months at the end of recording. They were housed in plastic tubs with wood shavings on a 12:12 h light/dark cycle and tested during the light cycle. Food was provided ad libitum. Water was restricted to 30 m at the start of the dark cycle on days when rats received water during training and 60 m on days when they did not so that water could be used as a positive reinforcer. This research was approved by the University of New Hampshire Institutional Animal Care and Use Committee and was conducted in accordance with the Guide for the Care and Use of Laboratory Animals of the National Institutes of Health.
Apparatus
The equipment was described in detail by Onos et al. (2016). Rats were trained in octagonal arenas with clear polycarbonate walls, 61 cm in diameter. Retractable levers were positioned on four walls 90° apart (N, E, S, W). There was a stimulus light and drinking spout above each lever with a miniature solenoid valve to signal and deliver water as a reinforcer. The recording arena was located in a Faraday cage with a screen door that provided ambient illumination and many visible external cues. A video camera was centred 1 m above the floor of the arena to record the location and head orientation of rats during recording sessions. The levers, stimulus lights, and computer interface were purchased from Med Associates (Fairfax, VT) and the solenoid valves from The Lee Co. (Westbrook, CT).
Electrical activity was recorded from neurons with tetrodes that were connected through a head stage and tether (Neuralynx, Bozeman, MT) through either a motorised servo-controlled commutator (Neuralynx) or low torque slip-ring commutator (Dragonfly Research and Development, Inc., Ridgeley, WV) to a Neuralynx Digital Lynx SX high-density electrophysiology recording system.
Behavioural procedures
There are four lever presses in each dDNMTP trial: start, sample, delay, and then choice (Figure 1). Trials begin with the base lever extending for the start response. This retracts when pressed causing a lever 90° to the left or right (randomly selected) to extend for the sample response. This retracts when pressed, delivering water reinforcement immediately above the sample lever (signalled by the panel light and the sound of the miniature solenoid valve). The base lever extends again after sample reinforcement for the delay press. This retracts with the first press after the memory delay causing the levers 90° to the left and right of the base lever to extend for the choice. Reinforcement (two 0.1 s, 0.1 mL pulses of water, 1 s apart) is delivered and all levers retracted when rats press the lever not extended for the sample (i.e. non-matching to sample position). Trials are scored as correct when this is the first lever pressed during the choice. When rats respond incorrectly, levers remain extended and rats continue until they press the correct lever and receive reinforcement. This correction procedure prevents rats from developing side biases. There is a 5.0 s inter-trial interval (ITI). For each trial, the base lever location was randomly selected without replacement (from a pool containing two representations of each possible start location). In earlier experiments, base lever location was selected from four possible locations for every session. In later experiments, base lever location was selected from two opposite locations (N vs S or E vs W) and the pair tested was switched between sessions. Base lever location was switched between trials so that behavioural events were not confounded with a consistent location. Training was switched from 4 to 2 base lever locations/session in later experiments so that spatial mapping results could be used to determine whether cells encoded direction of travel.
Figure 1.
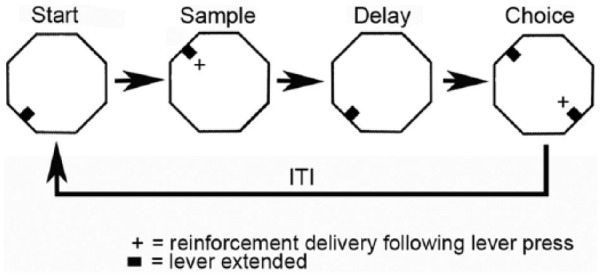
The dDNMTP task has a modular design that allows comparison of neuronal activity associated with comparable behavioural elements during each trial, including: four lever press responses, three movements between adjacent levers, and two reinforcement events. The location of the base lever used for start and delay presses was randomly selected for each trial so that behavioural elements were not consistently confounded with spatial location. To promote stable responding rats received a minimum of 60 pre-surgical training sessions to a criterion of completing 60 trials within a 60 m session with 70% correct for two of three consecutive sessions. Electrophysiological data were analysed only when rats completed a minimum of 40 trials in a 60 m recording session.
Rats were shaped and trained to a criterion of completing 60 dDNMTP trials in a 60 m session with 70% correct. This required 3–4 months of daily training (rats received a minimum of 60 pre-surgical training sessions). Water restriction ended for at least 2 days before surgery to implant tetrode arrays. Water restriction was re-instituted after a week of recovery from surgery, and recording sessions began 3 days later.
Surgical procedures
Tetrodes were implanted with stereotaxic surgery using aseptic procedures. Rats were anesthetised with ketamine (85 mg/kg) and xylazine (8.5 mg/kg), injected IM. Tetrode arrays were positioned through a small opening in the skull 3.0 mm anterior to Bregma, and 0.6 mm off midline in the left hemisphere for four rats and in the right hemisphere for seven rats. Arrays were attached to 0–80 stainless steel skull screws using Grip cement (Dentsply Int., Inc., Milford, DE). Butorphanol (0.2 mg/kg SC) was administered for postsurgical analgesia. Seven of the rats additionally had guide cannulae implanted aimed at central thalamus in one hemisphere for inactivation studies (data not reported here). Data are reported here only for days that did not involve inactivation or 24 h recovery from inactivation (tetrodes were left in place for three consecutive days for inactivation studies to compare activity on pre-inactivation, inactivation, and post-inactivation days).
Electrophysiological recording
Neurons were recorded from an array of four tetrodes extending from stainless steel cannula. Each tetrode was constructed of four 17.8 μm platinum iridium microwires (California Fine Wire, Grover Beach, CA) twisted with a Tetrode Spinner v. 2 (Neuralynx). Cannulae were soldered to a central pin in an 18 pin Mill-Max socket. Tetrode wires were attached to the other pins along with a silver ground wire. Before implantation, each microwire electrode was tested and plated with platinum black to lower impedances to a target of ≤200 kΩ at 1 kHz using a Nano-Z (Neuralynx). Recorded signals were amplified and processed using Cheetah data acquisition software. Digital signal processing low cut and high cut filters were set to 600–6000 Hz.
Tetrode arrays were fastened through a poly(methyl methacrylate) base to a tripod of 2–56 × 15 mm stainless steel base screws threaded into sockets that were glued to the skull. Arrays were lowered in steps of 1/8th (0.056 mm) or 1/16th of a turn (0.028 mm) for each of the three screws. Arrays were advanced through mPFC following recording sessions when rats performed at criterion for analysing results or when tetrodes had not been lowered in the previous 3 days. Data were analysed only for criterion sessions when rats completed a minimum of 40 trials in a 60 m session. At the end of the study, histological analyses were conducted to confirm the location of tetrode tracks and to determine where neurons were recorded.
Histology
Tetrode tracks were marked for 8 of the rats after the final recording session by passing a 30 s 100 µV current from a constant current stimulus isolator (A365 from WPI, Sarasota, FL) to make small lesions at the end of the track. For the other three rats histological analyses were conducted without marking lesions. Three days later rats were sacrificed by transcardiac perfusion of physiological saline followed by 4% (v/v) neutral buffered formalin under deep anaesthesia (100 mg/kg ketamine, 10 mg/kg xylazine IM). Brain tissue was removed and immersed in 30% along the track sucrose 4% neutral buffered formalin until sectioned. Tissue was blocked in the flat skull position with a RBM 4000 C brain matrix (ASI Instruments, Inc., Warren, MI) and sectioned frozen in the coronal plane at 50 µm. Tissue was stained with thionin and examined to identify the course of the tetrode track. The locations of individual neurons studied were inferred from histological results showing the location of the tetrode track and by the number of turns the arrays had been advanced when they were recorded.
Experimental design and data analyses
Tetrode signals were processed offline using automated cluster cutting to identify signals from individual neurons (Spike Sort 3D, Neuralynx). Spike Sort cluster plots were rotated manually to identify potential overlap between clusters. Clusters identified by Spike Sort plots were merged when together they formed a well-defined cluster in 3D space and exhibited highly similar waveforms at each of the microwires in a tetrode. The criteria for identifying isolated cells (see Figure 2) were distinct waveforms recorded by different microwires in a tetrode, a well-defined cluster in the 3D plot, a minimum interspike interval above 1 ms with an interspike interval histogram peaking above 10 ms, signal-to-noise (peak-to-peak) ratio of 2:1, hyperpolarisation that was asymmetrical with depolarisation, and an L ratio of <1 (Schmitzer-Torbert et al., 2005).
Figure 2.
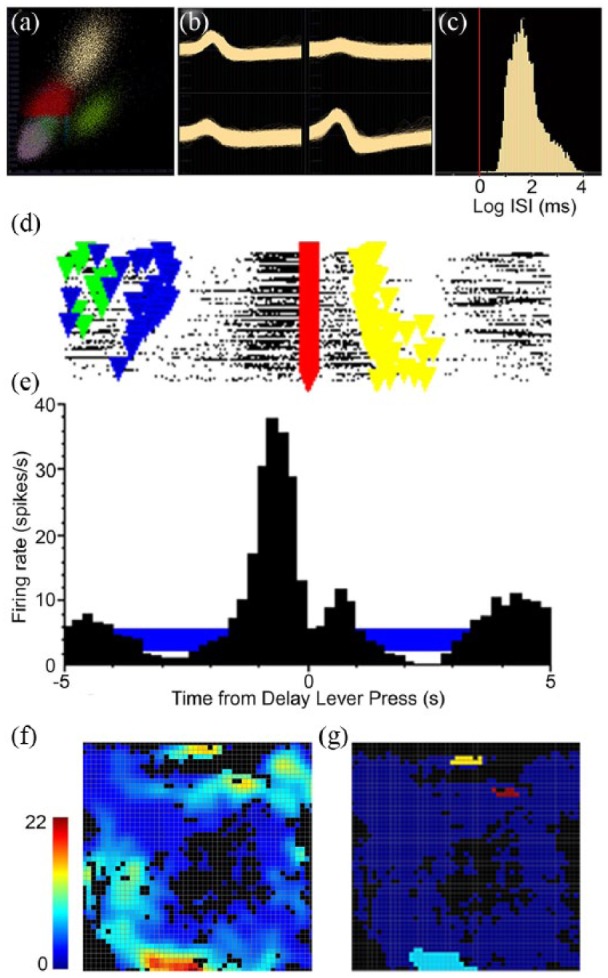
Example from one neuron of single unit electrophysiological analyses. Criteria for identifying isolated neurons included a well-defined cluster in the 3D plot (a), distinct waveforms recorded by different microwires in a tetrode (b), and a minimum interspike interval above 1 ms with an interspike interval histogram peaking above 10 ms (c). Examples are shown of a raster plot (d) and peri-event time histogram (PETH) (e) aligned with the delay lever press. Triangular event markers in the raster indicate start (green), sample (blue), delay (red), and choice (yellow) lever presses. The horizontal blue bar shows the 99% confidence interval for the PETH. The criterion for an event-related response was a PETH beyond the 99% confidence interval for two consecutive time bins with consistent changes in activity for at least 20% of trials in the raster plot. Spatial coding properties were characterised by heat maps (f) colour coded to show activity in spikes/s and firing fields (g) indicating areas reaching the criterion of a minimum of 9 contiguous bins with activity 3 standard deviations above the mean. This cell was classified as spatially restricted movement 1 since 2 of the 4 pathways traversed during movements between levers were not associated with firing fields.
Each dDNMTP trial consisted of a sequence of four lever presses (start, sample, delay, and choice), movements between each press, and reinforcement following sample and correct choice responses (Figure 1). Event-related activity was identified by generating a standard set of 13 averaged PETHs and raster plots (Figure 2) for each neuron identified using NeuroExplorer (Madison, AL). These include plots aligned with each of the four lever press responses, reinforcement events, correct and incorrect choice responses, and delay lever presses when different directions of turning (L vs R) or lever locations (1, 2, 3, or 4) were associated with correct (reinforced) responses. PETHs were produced by averaging activity in 200 ms time bins for 5 s before until 5 s after the aligned event. Confidence limits for PETH bins were calculated from the frequency of neuronal firing by NeuroExplorer based on the actual Poisson distribution when the expected number of events/bin was <30 and by the Gaussian approximation when more events were predicted.
Event-related responses were defined by the criteria of a PETH with two consecutive 200 ms bins beyond the 99% confidence interval associated with consistent changes in activity in at least 20% of trials in raster plots (see Figure 2 for example). These were designed to identify event-related responses without relying on a priori categorisation as a particular response type or averaged activity during broad periods of the task (e.g. sample, delay, choice). A criterion of a single bin beyond the 99% confidence interval produces too high a type I error rate. Adopting a more stringent criterion for a single bin, for instance the Bonferroni correction of p < 0.0002 (α = 0.01 for 50 bins/PETH), produces too many apparent type II errors (failing to identify what seem clear event-related responses). Since event-related responses in mPFC tend to last much longer than 200 ms for dDNMTP (Onos et al., 2016) and other goal-directed tasks (Horst and Laubach, 2012; Jung et al., 1998; Pratt and Mizumori, 2001; Totah et al., 2009, 2013) adopting a criterion of two consecutive bins at p < 0.01 provides a way to decrease the type I error rate (from random coincidence of activity in successive trials) while minimising any increase in the type II error rate. The requirement of coincident change in at least 20% of trials in a raster plot was adopted to prevent robust bursts of activity in a few trials from creating a false positive without creating a constraint that would eliminate spatially restricted firing patterns, which affect firing rates only when behavioural events occur in specific locations (Onos et al., 2016).
Criterion event-related responses were categorised as specific response types using definitions developed by Onos, et al. (2016) for the dDNMTP task (Table 1). Normalised population averages were calculated for each response type by converting averaged firing rates of individual neurons to z-scores for each 200 ms time bin of PETHs based on the overall firing rate of the cell throughout the recording session. To test the extent to which individual responses correspond with population averages, we calculated Pearson product-moment correlations between normalised averages for individual neurons with population averages. For action-related responses, correlations were calculated based on all points included in averaged population plots: 50 200 ms time bins centred on start, sample, delay, and choice lever presses for each of the action-related response types (movement 1, movement 2, lever press, base lever press, and preparatory). For outcome-related responses, correlations were also calculated for all points included in averaged population plots: 50 200 ms time bins centred on sample, correct choice, and incorrect choice lever presses for each of the outcome-related response types for which population responses were analysed (reinforcement anticipation, reinforcement excitation, post-reinforcement, and delay). Population responses were not analysed for error responses since only four examples were recorded.
Table 1.
Operational definitions of response types.
| Response type | Operational definition |
|---|---|
| Reinforcement anticipation | Increased activity 0.4 s prior to sample and choice persisting throughout reinforcement |
| Reinforcement excitation | Increased activity within 0.6 s after reinforcement begins and lasting throughout |
| Reinforcement suppression | Decreased activity within 0.6 s after reinforcement begins and lasting throughout |
| Post-reinforcement | Increased activity beginning after reinforcement ends |
| Error | Increased activity within 0.6 s after unreinforced errors, but not after reinforced sample or correct choice responses |
| Delay | Increased activity during sample reinforcement that persists until the delay response |
| Movement 1 | Increased activity during movement towards each lever press response |
| Movement 2 | Increased activity during movement towards sample and choice lever press responses |
| Lever press excitation | Increased activity during all lever press responses |
| Base lever press | Increased activity during start and delay lever presses |
| Lever press suppression | Decreased activity during all lever press responses |
| Preparatory | Increased activity during the inter-trial interval ending within 1.0 s before the start response |
To test for differences in the distribution of response types between dorsal and ventral mPFC, the locations of each cell with a given response type were mapped, based on results of histological analyses. The relative frequencies of different response types were then compared between dorsal and ventral mPFC, defined relative to a point 6.5 mm dorsal to the interaural line (3.5 mm ventral to Bregma), using the chi-square test of independence with standard residuals to identify sources of differences (SPSS statistics 24, IBM software). These analyses were restricted to response types with a minimum of 12 examples in mPFC to guarantee a minimum expected value of 5 for each cell of the analysis.
To determine whether mPFC neurons exhibit specialisation, we tested whether the extent of mixed selectivity observed in our data is less than would be predicted by random distribution of response types. We did this by calculating the 95% confidence intervals for the proportions of neurons with each response type in the overall population recorded and used these to estimate the likely number of neurons that should exhibit overlapping responses if they were distributed independently. We used the modified Wald method to compute confidence intervals of binomial proportions, p = X/n, as: where , with X is the number of examples observed and n is the number of isolated cells recorded (see Agresti and Coull, 1998). We then multiplied this interval by the number of neurons classified with other response types to determine the 95% confidence interval for the number of neurons expected to exhibit overlapping response types if response types are distributed randomly.
Spatial coding properties were analysed by determining the frequency of neuronal firing as a function of the position of the rat in the recording chamber. These place cell analyses (NeuroExplorer) examined neuronal activity in a 70 by 70 grid of bins covering the behavioural arena with a minimal time/bin of 0.2 s and minimum of three visits in the recording session. To identify areas of elevated activity, firing fields were mapped showing areas with a minimum of 9 contiguous bins with activity more than 3 standard deviations above the mean (see Figure 2 for an example). Neuronal responses were defined as spatially restricted when firing fields accounted for less than 50% of regions traversed by animals during correlated behavioural events. Spatially restricted and unrestricted fields were mapped anatomically and compared for dorsal and ventral regions of mPFC using methods described above for event-related responses.
Results
We recorded activity from 1335 units that met recording criteria for isolated neurons. Criterion event-related responses were observed for 458/ 1335 isolated units, of which 436 (95%) fit the definition for one and 9 (2%) the definitions for two of the response types described in Table 1. Results for 900 of these neurons were reported by Onos et al. (2016), including 293 (32%) exhibiting criterion event-related activity. Video tracking data were available for 355 cells with classified response types. Figure 2 shows an example of activity recorded from an isolated neuron, including raster and PETH results aligned with the delay lever press and spatial heat maps and firing fields representing the spatial distribution of its activity throughout the recording session.
Event-related activity
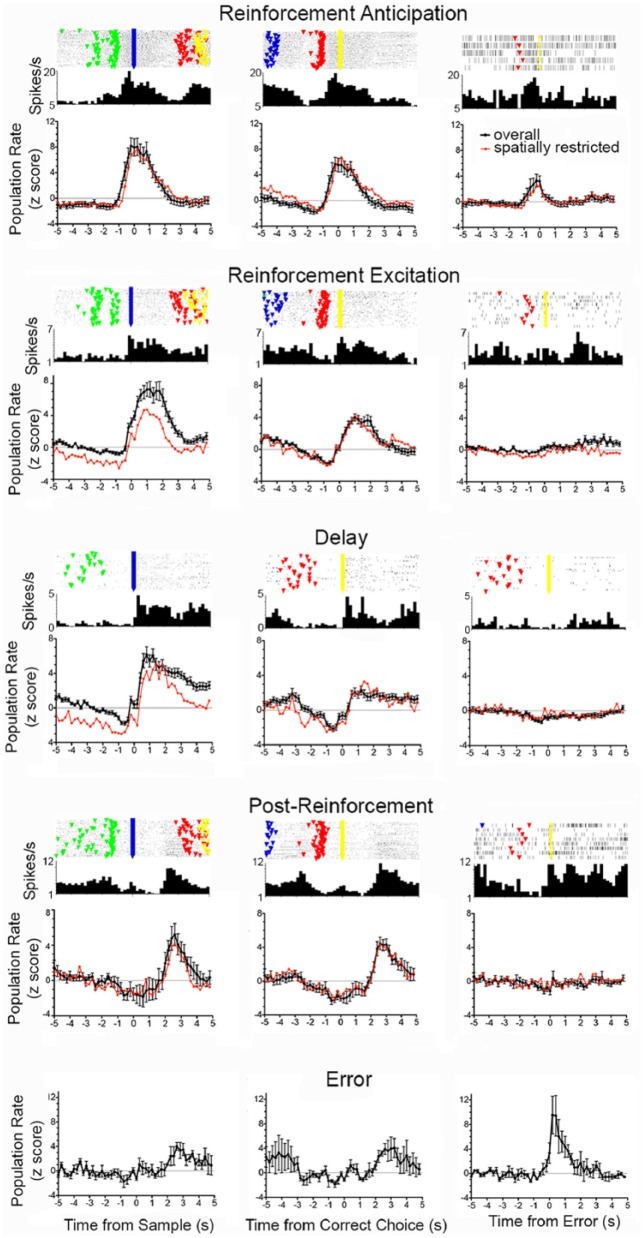
Responses sensitive to the delivery of reinforcement were observed for 208 of 458 (45%) of neurons that met the criteria for event-related activity. Each of these responded similarly when reinforcement was delivered following sample and correct choice responses and differentially when reinforcement was not delivered following incorrect choice responses. These included reinforcement anticipation (n = 50), reinforcement excitation (n = 63), reinforcement suppression (n = 8), post-reinforcement (n = 16), delay (n = 58), error (n = 4), and neurons exhibiting a combination of two response types (n = 9). Figure 3 shows normalised population responses averaging activity for five excitatory reinforcement-related response types along with PETH and raster plots from the neuron exhibiting the median fit to the population response (results are not included for reinforcement suppression or for neurons exhibiting a combination of two response types). For purposes of comparison, z = +2.0 was used to define the beginning and end of responses in normalised population analyses. By this measure, reinforcement anticipation began 0.6–0.8 s before sample and choice lever press responses and persisted until 1.6 s afterwards when reinforcement was delivered following sample or correct choice responses. Reinforcement excitation began later, coincident with reinforcement, lasting from 0 to 3.0 s after sample and from 0.2 to 2.4 s after correct choice responses. Delay responses began still later, lasting from 0.4 to 5.0 s following sample responses and from 0.8 to 1.4 s following correct choices. Error responses were observed form 0.0 to1.6 s following incorrect choices, but not following sample or correct choice responses. Post-reinforcement responses lasted from 2.2 to 3.4 s following sample and from 2.4 to 3.8 s following correct choice responses.
Figure 3.
Normalised population response aligned with reinforced sample and correct choice responses and unreinforced incorrect choices lever presses for reinforcement anticipation (n = 50), reinforcement excitation (n = 63), delay (n = 58), post-reinforcement (n = 16), and error (n = 4) responses. PETH and raster plots are shown for the neuron with the median correlation to the normalised population average. Normalised population averages are shown for the overall population (black, error bars represent standard error of the mean) and for neurons classified as spatially restricted (red). Event markers in raster plot represent start (green), sample (blue), delay (green), and choice (yellow) lever presses in each dDNMTP trial (with trial 1 at bottom).
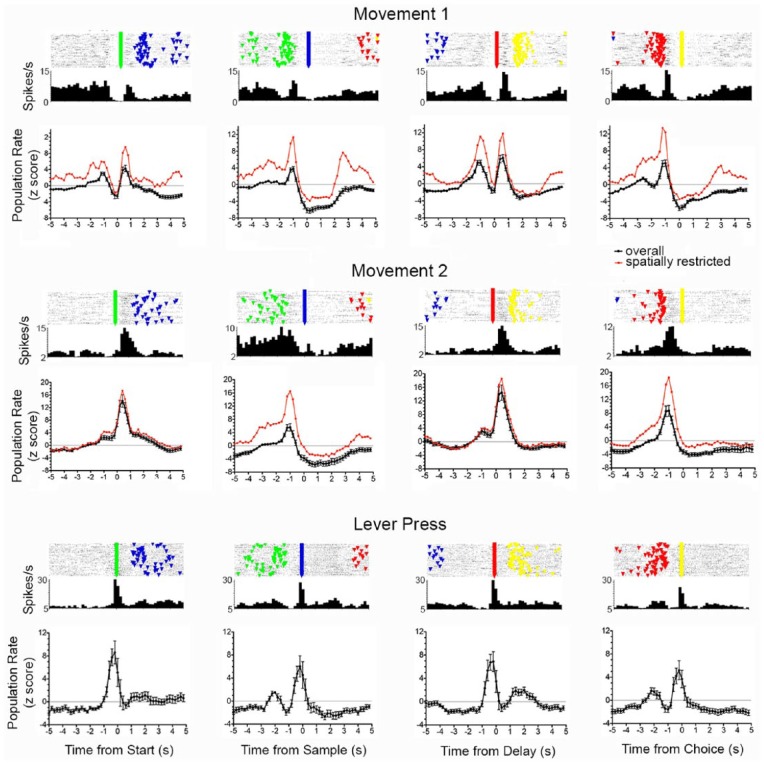
Firing rates were increased during periods of movement between levers for 131 (29%) of 458 neurons exhibiting criterion event-related activity. These included 97 with movement 1, 32 with movement 2, and 2 with a combination of two responses including movement 2. Figure 4 shows normalised population responses along with raster and PETH plots for neurons with median fits to movement 1 and 2 response types. These population plots are based on all neurons with movement 1 or 2 responses except for the two with combination responses. In normalised population analyses (Figure 4), movement 1 neurons fired during movements towards each lever press: 1.2–0.8 s before start, 1.2–0.8 s before sample, 1.4–0.4 s before delay, and 1.4–0.6 s before choice lever presses. Movement 2 responses were associated with elevated firing rates during movements from start to sample and from delay to choice lever presses (Figure 4). When aligned with start or delay responses, population responses showed brief periods of elevated activity before the start or delay presses that increased sharply following the lever press and decreased sharply 0.6 s later. When aligned with sample or choice, PETHs increased from 1.4 to 0.6 s before sample and from 1.6 to 0.4 s before choice lever presses. Both movement 1 and movement 2 responses were associated with periods of diminished activity while rats remained stationary consuming reinforcements following sample and correct choice responses. As noted by Onos et al. (2016), movement 2 responses showed directional specificity, activating one of two possible routes from each base lever (Figure 7(f)).
Figure 4.
Normalised population responses aligned with start, sample, delay, and choice responses for neurons exhibiting movement 1 (n = 97), movement 2 (n = 32), and lever press (n = 28) responses. PETH and raster plots are shown for the neuron with the median correlation to the normalised population average. Normalised population averages are shown for the overall population (black, error bars represent standard error of the mean) and for neurons classified as spatially restricted (red). Event markers in raster plot represent start (green), sample (blue), delay (green), and choice (yellow) lever presses in each dDNMTP trial (with trial 1 at bottom).
Figure 7.
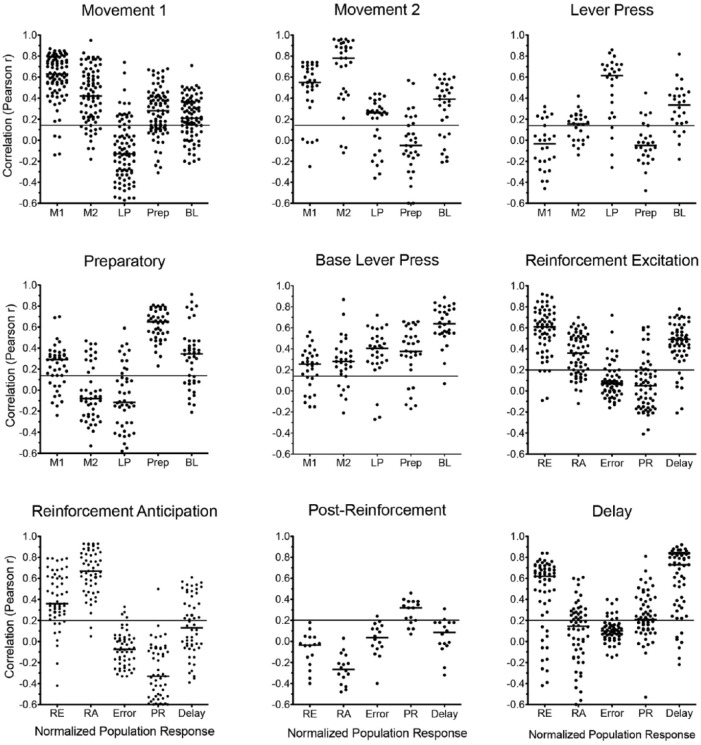
Pearson correlation coefficients between normalised individual and population responses. Neurons exhibiting action-related response types are correlated with population averages for each of the action-related response types: movement 1 (M1), movement 2 (M2), lever press excitation (LP), preparatory (Prep), and base lever press (BLP). Action-related correlations are based on 50 200 ms time bins centred on start, sample, delay, and choice responses (i.e. all bins included in averaged population plots). Neurons exhibiting outcome-related response types are correlated with population averages for each of the action-related response types: reinforcement excitation (RE), reinforcement anticipation (RA), error (E), post-reinforcement (PR), and delay (D). Results are not shown for neurons with error response types since only four examples were found. Outcome-related correlations are based on 50 200 ms time bins centred on sample, correct choice, and incorrect choice responses (i.e. all bins included in averaged population plots). The long horizontal line in each plot shows the critical value for the Pearson r (α = 0.05, two-tailed). The shorter horizontal lines show the median r for each correlation.
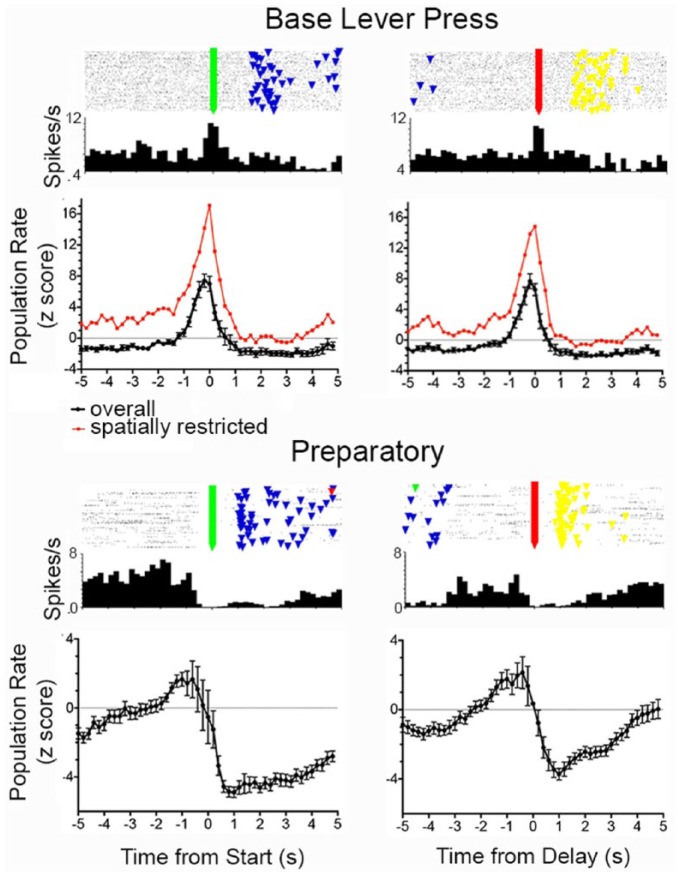
Firing rates were changed during lever press responses for 70 (15%) of 458 neurons with criterion event-related activity. These include 28 with excitation during each of the lever presses (Figure 4), 30 with excitation during base (start and delay) lever presses (Figure 5), 8 with suppressed activity during all four lever presses, and 6 showing lever press excitation combined with reinforcement excitation. Normalised population analyses included all neurons with excitatory lever press responses except the six exhibiting lever press excitation combined with reinforcement excitation (Figures 4 and 5). Analyses of lever press excitation revealed increased activity from 0.6 s before until 0.2 s after start, 0.6 s before to 0.4 s after sample, 0.8 s before until 0.2 s after delay, and 0.6 s before until 0.2 s after choice lever presses. Base lever press responses were associated with increased activity from 0.8 s before until 0.4 s after start and delay responses with no activity above the z = +2.0 threshold for sample or choice lever presses. Normalised population analyses of preparatory responses (N = 44) revealed a gradual ramping up of activity before start and delay responses (Figure 5), following by prolonged periods of suppressed activity persisting for more than 5.0 s after start and for 3.0 s after delay lever presses (Figure 5).
Figure 5.
Normalised population responses for neurons exhibiting preparatory and base lever press responses aligned with start and delay lever presses. PETH and raster plots are shown for the neuron with the median correlation to the normalised population average. Normalised population averages are shown for the overall population (black, error bars represent standard error of the mean) and for neurons classified as spatially restricted (red). Event markers in raster plot represent start (green), sample (blue), delay (green), and choice (yellow) lever presses in each dDNMTP trial (with trial 1 at bottom).
Normalised population activity (Figures 3–6) was averaged for 10 response types based on activity recorded from 422 (92%) of 458 neurons exhibiting criterion event-related responses. Data are not averaged for 14 neurons with suppressive responses, 9 with combination responses, and 13 that did not fit response types defined by Onos et al. (2016). Comparison of different response types reveals discrete populations of neurons with intermittent periods of elevated activity that span the duration of dDNMTP trials. Figure 6 shows normalised population functions for all 10 response types, plotting the five with action-related responses on one set of axes and the five outcome-related responses on another. Trials begin with elevated preparation and movement 1 activity, followed by elevated lever press and base lever press during the start response, movement 1 and 2 activity as rats move towards the sample lever, and lever press activity during the sample response. This sequence of action-related neuronal responses then repeats for the delay and choice responses. Outcome-related responses begin with reinforcement anticipation activity as rats move towards sample and choice levers. Delivery of reinforcement for sample and correct choice responses is then associated with reinforcement excitation firing within 0.2 s of reinforcement onset, delay response firing 0.4–0.6 s later, and then increased post-reinforcement and error response activity 1.0–1.2 s after the reinforcement event (two 0.1 s spurts of water, 1.0 s apart) ends. Errors, when water is not delivered with a choice lever press, are associated with an immediate decrease in reinforcement anticipation activity and increase in error response activity.
Figure 6.
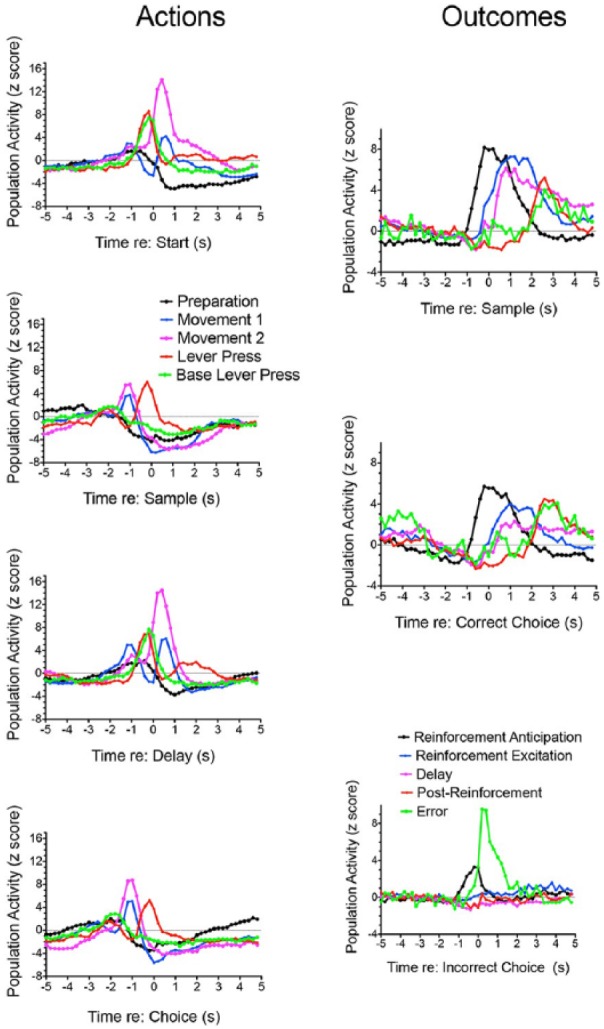
Normalised population responses for neurons exhibiting increased activity correlated with actions or outcomes. These are the same data presented in Figures 3–5 but plotted on common axes to show the timing of different response types related to actions (aligned with start, sample, delay, and choice responses) and outcomes (aligned with sample, correct choice, and incorrect choice responses).
Even though the operational definitions for different response types involve relatively few of the time bins included in normalised response functions (Figures 3–6), correlational analyses showed significant positive fits for 388/418 (93%) cells with population averages across all time bins of normalised functions (Figure 7), including: 29/30 base lever, 93/97 movement 1, 19/32 movement 1, 24/28 lever press, 44/44 preparatory, 48/50 reinforcement anticipation, 58/63 reinforcement excitation, 12/16 post-reinforcement, and 51/58 delay responses. For most neurons correlations with population, averages were substantially higher than critical values for statistical significance (Figure 7): median r = 0.63 for movement 1, 0.78 for movement 2, 0.615 for lever press, 0.64 for base lever press, 0.65 for preparatory, 0.67 for reinforcement anticipation, 0.61 for reinforcement excitation, 0.32 for post-reinforcement, and 0.73 for delay response types. Comparison of PETH and raster plots of neurons with median fits to population averages (Figures 3–5) revealed temporal patterns of activity consistent with averaged population responses for all response types examined.
Nine neurons exhibited a combination to two response types. Six showed a combination of lever press excitation and reinforcement excitation, two a combination of movement 2 and post-reinforcement responses, and one a combination of reinforcement anticipation and delay period activity. The finding of combination response types provides evidence of mixed selectivity in mPFC during dDNMTP. To test whether this degree of overlap is consistent with random distribution of response types across mPFC neurons (Lindsay et al., 2017; Rigotti et al., 2013), we used the modified Wald method to compute confidence intervals of binomial proportions for each response type (Agresti and Coull, 1998) and multiplied these intervals by the number of neurons classified with other response types to determine the 95% confidence interval for the number of neurons expected to exhibit overlapping response types if response types were distributed randomly across mPFC. The results of these analyses show that the number of cells with mixed selectivity fell below the 95% confidence interval for every response type (Table 1).
Spatial coding
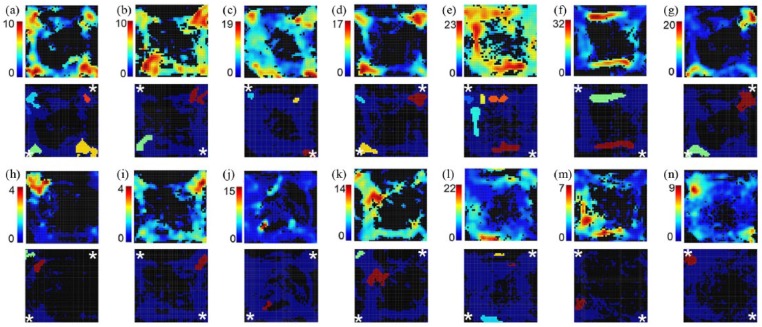
Figure 8 shows examples of spatial heat maps and firing fields for cell types most commonly associated context-specific responses. Spatial heat maps depict firing rate in a 70 by 70 grid of bins covering the behavioural arena with a minimal time/bin of 0.2 s and minimum of three visits in the recording session. Firing fields show areas where activity was elevated by at least 3 standard deviations for a minimum of 9 contiguous bins. Neurons were active in areas consistent with their associated event-related activity. Thus, reinforcement anticipation (Figure 8(a) and (h)) and reinforcement excitation (Figure 8(b) and (i)) were most active at locations where reinforcement was delivered, movement 1 (Figure 8(e) and (l)) and movement 2 (Figure 8(f) and (m)) along pathways connecting levers, and base lever presses (Figure 8(g) and (n)) at locations of base levers. A subset of neurons (N = 81) exhibited spatially restricted patterns of activation (Figure 8(h) and (n)) where firing fields revealed increased activity in 50% or less of areas associated with a behavioural event. Neurons were classed as spatially unrestricted (N = 274) when firing fields were found in more than 50% of regions associated with a behavioural (Figure 8(a) and (g)).
Figure 8.
Heat maps (above) and firing fields (below) for neurons classified as spatially unrestricted ((a)–(g)) and restricted ((h)–(n)). Scales next to heat maps show activity in spikes/s across a 70 by 70 grid representing the floor of the arena oriented with levers in the corners. The results here are for sessions trained with two alternative locations of base levers (marked by white asterisks on the firing field plots). Results are shown for reinforcement anticipation (a, h), reinforcement excitation (b, i), delay (c, j), post-reinforcement (d, k), movement 1 (e, l), movement 2 (f, m), and base lever press (g, n). Spatially unrestricted responses had firing fields throughout areas where rats were located during correlated behavioural events. Spatially restricted responses had firing fields in 50% or fewer of these areas.
To determine whether event-related activity differed in neurons with spatially restricted and unrestricted fields, we compared averaged normalised population activity for neurons with spatially restricted fields to overall population averages (red lines in Figures 3–5). The temporal patterns of activity for spatially restricted neurons were highly similar to overall population averages, although differences were observed in normalised rates of firing for some of the comparisons.
Histological analyses
Figure 9 shows maps of locations of neurons exhibiting the nine most common response types observed in this study projected on coronal section 3.2 mm anterior to Bregma in Paxinos and Watson (1998). There was variability in the anterior-posterior locations of and angle of tetrode tracks relative to the stereotaxic plane and so the location cells in this figure are approximate. For quantitative analyses, individual tracks were mapped to determine the dorsal-ventral depth of cells along mPFC. Each neuron is represented by a single dot in Figure 9. Where neurons overlapped these dots were displaced to adjacent locations to provide an indication of numerosity. Neurons lacking video tracking data are shown in black, neurons with spatially restricted fields in red, and neurons with spatially non-restricted fields in green. The maps show extensive overlap between locations of neurons with different response types with trends for some to be more frequent in dorsal mPFC and others in ventral mPFC. To compare dorsal and ventral distributions of event-related and spatial coding properties, mPFC was divided into areas dorsal and ventral to a line 6.5 mm dorsal to the interaural line (see Heidbreder and Groenewegen, 2003; Hoover and Vertes, 2007; Sesack et al., 1989; Vertes, 2004). For spatial coding analyses (restricted to neurons with video tracking results), this yielded a dorsal population of 170 and a ventral population of 185. For event-related analyses, there were 240 dorsal and 178 ventral neurons. Event-related analyses were restricted to neurons with response types with at least 12 exemplars (also shown in Figure 9) to avoid cells with expected frequencies less than 5. A chi-square test of independence revealed a significant difference in response types observed in dorsal and ventral areas, Pearson chi-square = 58.561, df = 8, two-tailed p < 0.001. Standard residuals showed greater proportions (z difference > 2) of preparatory, lever press excitation, base lever press, and movement 1 responses in dorsal mPFC and greater proportions of delay, reinforcement anticipation, and movement 2 responses in ventral mPFC (Figure 10). There was no significant difference in the proportion of spatially restricted responses between dorsal and ventral mPFC, Pearson chi-square = 0.313, df = 1, two-tailed p = 0.576.
Figure 9.
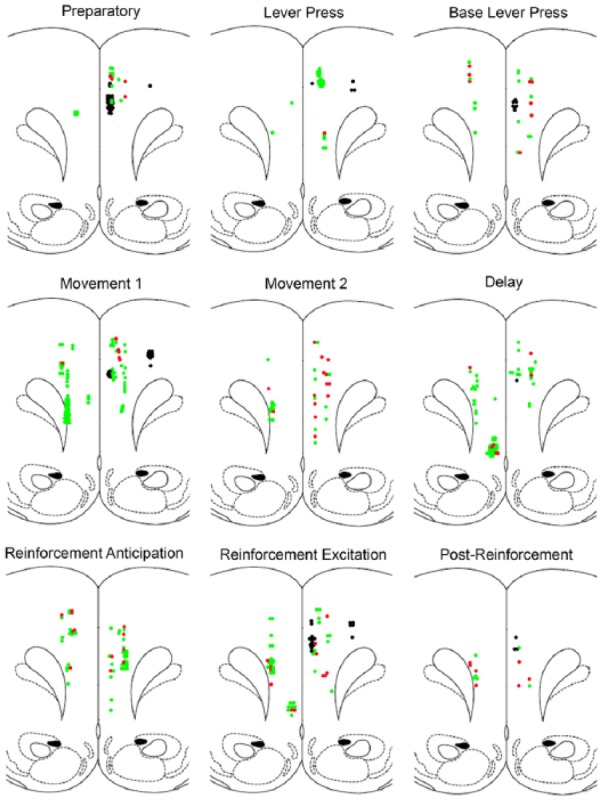
Location of cells with different response types. Results are shown for the nine most common response types, plotted on templates derived from Paxinos and Watson (1998) at 3.2 mm anterior to Bregma. Since the precise AP location and angle of tetrode tracks relative to the stereotaxic plane varied between animals, locations of cells in this figure are approximate. Results are not plotted for cells exhibiting combined response types. Where locations of cells overlapped, the points indicating location were moved slightly to the side to preserve a sense of numerosity. Cells lacking video tracking data are plotted in black. Cells classified as spatially unrestricted are shown in green and spatially restricted in red.
Figure 10.
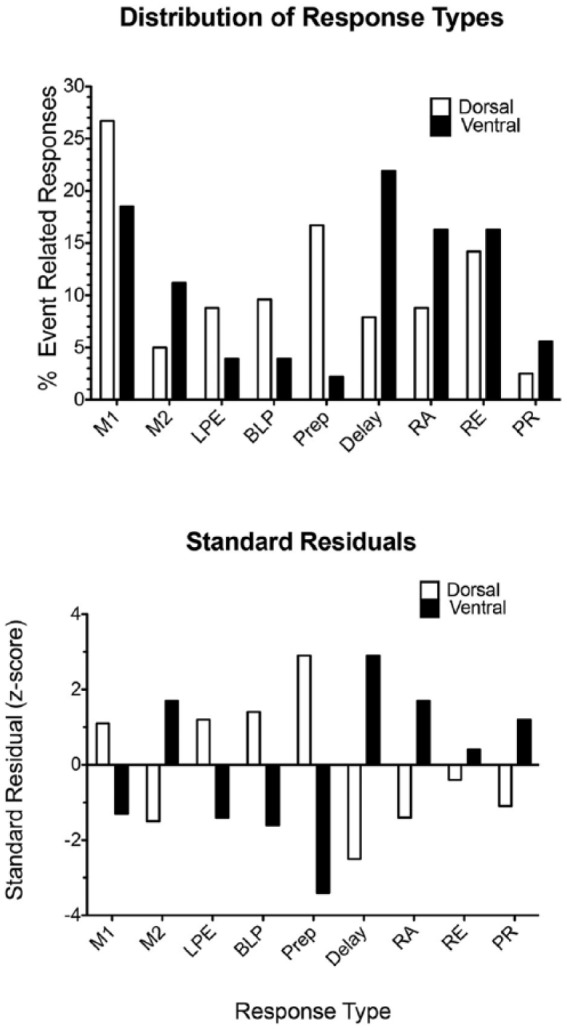
Histograms depicting the relative concentration of different response types in dorsal versus ventral medial prefrontal cortex (mPFC). The border between dorsal and ventral mPFC was operationally defined as 6.5 mm dorsal to the interaural line in Paxinos and Watson (1998). Standard residuals are plotted for each of the response types to indicate their contribution to the significant difference between dorsal and ventral areas in the chi-square analysis (see text for details). Cell types include movement 1 (M1), movement 2 (M2), lever press excitation (LPE), base lever press (BLP), preparatory (Prep), delay, reinforcement anticipation (RA), reinforcement excitation (RE), and post-reinforcement (PR).
Discussion
Lesion studies have implicated mPFC in goal-directed action selection and related cognitive and executive functions (Balleine and O’Doherty, 2010; Chudasama, 2011; Dalley et al., 2004; Kesner and Churchwell, 2011). To understand how neuronal activity gives rise to these functions, we recorded single unit activity in mPFC of rats performing dDNMTP. We identified distinct response types related to actions and outcomes that account for 445 (97%) of 458 neurons with criterion event-related responses and analysed the temporal structure of the most commonly observed response types (n = 16 to 97) as normalised peri-event population averages (Figures 3–5). Correlational analyses showed significant fits with population averages for 388 (93%) of 415 neurons included in population analyses. These analyses revealed a cascade of precisely timed population neuronal responses representing the temporal organisation of behavioural events that constitute dDNMTP trials (Figure 6). Anatomical analyses showed considerable overlap in the distribution of different response types across mPFC with a significant difference in the relative densities of different response types in ventral and dorsal areas (Figures 9 and 10). Our results are consistent with a fundamental role for mPFC in the flexible control of actions by response–outcome associations (Balleine and O’Doherty, 2010; Chudasama, 2011; Dalley et al., 2004; Heidbreder and Groenewegen, 2003; Hoover and Vertes, 2007; Kesner and Churchwell, 2011).
Event-related responses
Event-related activity was identified by criterion changes in PETH and raster plots and categorised as response types based on correlations with specific event markers (Table 1). Reinforcement-related responses were operationally defined by activity associated with sample, correct choice, and incorrect choice responses for 208 (45%) of 458 neurons with criterion event-related activity (Figure 3). These include responses beginning before reinforcement (reinforcement anticipation), coincident with reinforcement (reinforcement excitation), 0.4 s after reinforcement began (delay), and 1.0 s after reinforcement ended (post-reinforcement). Four examples of error responses were observed that began promptly with incorrect choices but not following sample or correct choice responses. Previous studies have described prefrontal activity in rats, monkeys, and humans consistent with the anticipation, excitation, delay, and error responses described here (Alexander and Brown, 2011; Horst and Laubach, 2012; Pratt and Mizumori, 2001; Rushworth et al., 2011), although previous treatments of delay-related activity have not emphasised their association with reinforcement. It is not clear if this is a unique feature of dDNMTP task or if the association of delay responses with reinforcement has been missed in previous analyses. To our knowledge, post-reinforcement responses have not been described for other tasks.
Action-related responses were observed for 245 (54%) of 458 neurons with criterion event-related activity: 131 that fire during movements between levers, 70 during lever press responses, and 44 during preparation prior to start and delay responses. Previous studies have revealed mPFC neurons that respond during periods of movement (Euston and McNaughton, 2006; Jung et al., 1998), operant responses like lever presses or nose pokes (Chang et al., 2002; Horst and Laubach, 2012; Hyman et al., 2012; Totah et al., 2013), and preparatory activity prior to the start of learned action sequences (Chang et al., 2002; Jung et al., 1998; Totah et al., 2009, 2013). Here normalised population analyses revealed distinct temporal patterns of excitation coincident with all periods of movement without directional specificity (movement 1), movements towards sample and choice responses with evidence of directional specificity (movement 2), during all lever press responses (lever press excitation), specifically during start and delay lever presses (base lever press), and prior to start and delay responses that began the sample and choice phases of dDNMTP (preparatory).
Comparison of normalised population results reveals a coordinated sequence of overlapping neuronal firing patterns that defines critical behavioural events and thus the temporal organisation of dDNMTP trials (Figure 6). This begins with preparatory and movement 1 activity before start responses; lever press and base lever press activity during the start response; movement 1 and 2 and then reinforcement anticipation as the rat travels towards the sample lever; lever press activity during the sample press; followed by reinforcement (and continued reinforcement anticipation), then delay and post-reinforcement activity. This same pattern then repeats as the rat performs the delay and choice responses of the dDNMTP trial. The validity of normalised population plots as a representation of single unit activity is supported by correlational analyses. Although the periods of activity that define response types are relatively brief, there were significant positive correlations between most individual neurons and population averages throughout the more lengthy periods of time represented by PETH analyses (5s before and after relevant lever press responses). The median correlation coefficient was greater than 0.6 for the eight most common response types (n = 28–97). The lower median coefficient observed for post-reinforcement responses (r = 0.32) may reflect the relatively small number of cells in this population (n = 16) or the relatively long period of time between the aligned event markers and the start of the response (2.2 s).
Anatomical mapping of neurons exhibiting different response types confirmed our earlier report of extensive overlap between different response types (Onos et al., 2016) and provided new evidence that response types were distributed differentially between dorsal and ventral regions of mPFC (Figures 9 and 10). Standard residual analyses indicated that the significant difference in the distribution of response types reflected a preponderance of preparatory, lever press, base lever press, and movement 1 responses in dorsal mPFC and delay, reinforcement anticipation, post-reinforcement, and movement 2 responses in ventral mPFC. Other than movement 2, this shows a greater concentration of reinforcement-related responses in ventral mPFC and action-related responses in dorsal mPFC. This trend is consistent with both the afferent and efferent connections of these areas (Condé et al., 1995; Heidbreder and Groenewegen, 2003; Hoover and Vertes, 2007; Sesack et al., 1989; Van Enden et al., 1992; Vertes, 2004) and functional effects of lesions that damage them (Balleine and O’Doherty, 2010; Chudasama, 2011; Dalley et al., 2004; Kesner and Churchwell, 2011).
Our results seem consistent with a relatively simple tuning scheme where discrete populations of neurons represent distinct task-relevant information about actions and outcomes sufficient to guide adaptive responding. The finding of discrete response types and the paucity of neurons exhibiting mixtures of response types (Table 2) seems inconsistent with prevalence of mixed selectivity encoding of multiple task-relevant features by single neurons (Lindsay et al., 2017; Rigotti et al., 2013). It is possible, of course, that mixed selectivity would be more prominent for a more complex task or for rats with less experience performing the dDNMTP task. In any event, these results must be taken as evidence that rodent mPFC contains discrete populations of neurons tuned to encode different types of task-relevant information. This possibility seems consistent with the distinct patterns of inputs to different regions of mPFC and evidence (above) that different response types are organised topographically from dorsal to ventral mPFC.
Table 2.
Expected and observed overlap of response types.
| Response type | Modified Wald 95% confidence interval | Expected overlap 95% confidence | Observed overlap |
|---|---|---|---|
| Reinforcement anticipation | 0.037 ± 0.010 | 10.7–18.5 | 1 |
| Reinforcement excitation | 0.049 ± 0.011 | 14.3–22.2 | 6 |
| Reinforcement suppression | 0.007 ± 0.004 | 1.4–4.8 | 0 |
| Post-reinforcement | 0.014 ± 0.006 | 3.4–8.6 | 2 |
| Error | 0.004 ± 0.004 | 0.5–3.1 | 0 |
| Delay | 0.042 ± 0.010 | 12.7–20.7 | 1 |
| Movement 1 | 0.069 ± 0.013 | 19.5–28.5 | 0 |
| Movement 2 | 0.025 ± 0.008 | 7.0–13.6 | 2 |
| Lever press excitation | 0.025 ± 0.008 | 7.0–13.6 | 6 |
| Base lever press | 0.022 ± 0.008 | 5.8–12.4 | 0 |
| Lever press suppression | 0.006 ± 0.004 | 0.8–4.4 | 0 |
| Preparatory | 0.032 ± 0.009 | 9.2–16.4 | 0 |
Spatial coding
To define areas of elevated activity objectively, we calculated firing fields for all criterion event-related responses for which video tracking data were available. Our results confirmed the more qualitative analyses of Onos et al. (2016) that a subset of mPFC neurons exhibit event-related responses in spatially restricted areas of the behavioural chamber: 23% (81/355) here compared to 15% (20/137) in Onos et al. (2016). The population analyses here also provided a more quantitative demonstration that event-related responses in spatially restricted cells showed temporal patterns of activity comparable to cells that responded over a larger area of the dDNMTP arena (Figures 3–5). Anatomical analyses showed that the distribution of neurons with spatially restricted fields was similar in dorsal and ventral regions of mPFC.
Conclusion
The population analyses reported here confirmed results of single unit analyses describing discrete response types that account for over 95% of neurons exhibiting behaviourally correlated responses in mPFC of rats performing the dDNMTP task (Onos et al., 2016). These analyses show a precisely timed cascade of population responses that define the temporal organisation of behavioural events that constitute dDNMTP trials, repeating the same sequence over the first (start/sample) and second (delay/choice) phases of the task (Figure 6). These findings suggest a fundamental role for mPFC representing actions and outcomes and organising temporal sequences of behavioural events that give rise to complex goal-directed behaviours like dDNMTP. A note of caution is due since these results represent activity observed during one particular task. Nonetheless, they provide evidence that for well-trained rats mPFC contains discrete populations of neurons that represent information about the temporal organisation of salient actions and outcomes. These results are consistent with evidence that mPFC plays a critical role in action-outcome contingency (Bradfield et al., 2015; Corbit and Balleine, 2003; De Wit et al., 2006; Luk and Wallace, 2009; Tran-Tu-Yen, 2009). Anatomical analyses show considerable overlap in mPFC of different response types, while revealing a tendency for dorsal areas to contain more neurons with action-related activity and ventral areas more neurons with responses related to action outcomes.
Footnotes
Declaration of conflicting interests: The author(s) declared no potential conflicts of interest with respect to the research, authorship, and/or publication of this article.
Funding: Supported by a Research Leveraging Initiative grant from the University of New Hampshire and R15-MH110876 from NIMH. We thank Leah Calderazzo, Emma Warren, Kristen Onos, Ben Wormwood, and Brett Gibson, for technical assistance.
ORCID iD: Robert G. Mair  https://orcid.org/0000-0002-5943-2276
References
- Agresti A, Coull BA. (1998) Approximate is better than ‘exact’ for interval estimation of binomial proportions. American Statistician 52(2): 119–126. [Google Scholar]
- Alexander WH, Brown JW. (2011) Medial prefrontal cortex as an action-outcome predictor. Nature Neuroscience 14(10): 1338–1344. [DOI] [PMC free article] [PubMed] [Google Scholar]
- Ashwell R, Ito R. (2014) Excitotoxic lesions of the infralimbic, but not prelimbic cortex facilitate reversal of appetitive discriminative context conditioning: The role of the infralimbic cortex in context generalization. Frontiers in Behavioral Neuroscience 8(1): 63. [DOI] [PMC free article] [PubMed] [Google Scholar]
- Balleine BW, O’Doherty JP. (2010) Human and rodent homologies in action control: Corticostriatal determinants of goal-directed and habitual action. Neuropsychopharmacology 35(1): 48–69. [DOI] [PMC free article] [PubMed] [Google Scholar]
- Birrell JM, Brown BJ. (2000) Medial frontal cortex mediates perceptual attentional set shifting in the rat. Journal of Neuroscience 20(11): 4320–4324. [DOI] [PMC free article] [PubMed] [Google Scholar]
- Boulougouris V, Dalley JW, Robbins TW. (2007) Effects of orbitofrontal, infralimbic and prelimbic cortical lesions on serial spatial reversal learning in the rat. Behavioural Brain Research 179(2): 219–228. [DOI] [PubMed] [Google Scholar]
- Bradfield LA, Dexfouli A, van Holstein M, et al. (2015) Medial orbitofrontal cortex mediates outcome retrieval in partially observable task situations. Neuron 88(6): 1268–1280. [DOI] [PubMed] [Google Scholar]
- Bussey TJ, Muir JL, Everitt BJ, et al. (1997) Triple dissociation of anterior cingulate, posterior cingulate, and medial frontal cortices on visual discrimination tasks using a touchscreen testing procedure for the rat. Behavioral Neuroscience 111(5): 920–936. [DOI] [PubMed] [Google Scholar]
- Chang JY, Chen L, Luo F, et al. (2002) Neuronal responses in the frontal cortico-basal ganglia system during delayed matching-to-sample task: Ensemble recording in freely moving rats. Experimental Brain Research 142(1): 67–80. [DOI] [PubMed] [Google Scholar]
- Chudasama Y. (2011) Animal models of prefrontal-executive function. Behavioral Neuroscience 125(3): 327–343. [DOI] [PubMed] [Google Scholar]
- Condé F, Maire-Lepoivre E, Audinat E, et al. (1995) Afferent connections of the medial frontal cortex of the rat. II. Cortical and subcortical afferents. Journal of Comparative Neurology 352(4): 567–593. [DOI] [PubMed] [Google Scholar]
- Corbit L, Balleine BW. (2003) The role of prelimbic cortex in instrumental conditioning. Behavioural Brain Research 146(1–2): 145–157. [DOI] [PubMed] [Google Scholar]
- Dalley JW, Cardinal RN, Robbins TW. (2004) Prefrontal executive and cognitive functions in rodents: Neural and neurochemical substrates. Neuroscience and Biobehavioral Reviews 28(7): 771–784. [DOI] [PubMed] [Google Scholar]
- De Wit S, Kosaki Y, Balleine BW, et al. (2006) Dorsomedial prefrontal cortex resolves response conflict in rats. Journal of Neuroscience 26(19): 5224–5229. [DOI] [PMC free article] [PubMed] [Google Scholar]
- Dias R, Aggleton JP. (2000) Effects of selective excitotoxic prefrontal lesions on acquisition of nonmatching- and matching-to-place in the T-maze in the rat: Differential involvement of the prelimbic-infralimbic and anterior cingulate cortices in providing behavioural flexibility. European Journal of Neuroscience 12(12): 4457–4466. [DOI] [PubMed] [Google Scholar]
- Euston DR, McNaughton BL. (2006) Apparent encoding of sequential context in rat medial prefrontal cortex is accounted for by behavioral variability. Journal of Neuroscience 26(51): 13143–13155. [DOI] [PMC free article] [PubMed] [Google Scholar]
- Heidbreder CA, Groenewegen H. (2003) The medial prefrontal cortex in the rat: Evidence for a dorso-ventral distinction based upon functional and anatomical characteristics. Neuroscience and Biobehavioral Reviews 27(6): 555–579. [DOI] [PubMed] [Google Scholar]
- Hoover WB, Vertes RP. (2007) Anatomical analysis of afferent projections to the medial prefrontal cortex in the rat. Brain Structure & Function 212(2): 149–179. [DOI] [PubMed] [Google Scholar]
- Horst NK, Laubach M. (2009) The role of rat dorsomedial prefrontal cortex in spatial working memory. Neuroscience 164(2): 444–456. [DOI] [PMC free article] [PubMed] [Google Scholar]
- Horst NK, Laubach M. (2012) Working with memory: Evidence for a role for the medial prefrontal cortex in performance monitoring during spatial delayed alternation. Journal of Neurophysiology 108(12): 3276–3288. [DOI] [PMC free article] [PubMed] [Google Scholar]
- Hyman JM, Ma L, Balaguer-Ballester E, et al. (2012) Contextual encoding by ensembles of medial prefrontal cortex neurons. Proceedings of the National Academy of Sciences of the United States of America 109(3): 5086–5091. [DOI] [PMC free article] [PubMed] [Google Scholar]
- Jung MW, Qin Y, McNaughton BL, et al. (1998) Firing characteristics of deep layer neurons in prefrontal cortex in rats performing spatial working memory tasks. Cerebral Cortex 8(5): 437–450. [DOI] [PubMed] [Google Scholar]
- Kesner RP, Churchwell JC. (2011) An analysis of rat prefrontal cortex in mediating executive function. Neurobiology of Learning and Memory 96(3): 417–431. [DOI] [PubMed] [Google Scholar]
- Lindsay GW, Rigotti M, Warden MR, et al. (2017) Hebbian learning in a random network captures selectivity properties of prefrontal cortex. Journal of Neuroscience 37(45): 1222–1217. [DOI] [PMC free article] [PubMed] [Google Scholar]
- Luk C-H, Wallace JD. (2009) Dynamic encoding responses by neurons in medial prefrontal cortex. Journal of Neuroscience 29(23): 7526–7539. [DOI] [PMC free article] [PubMed] [Google Scholar]
- Onos KD, Francoeur MJ, Wormwood BA, et al. (2016) Prefrontal neurons encode actions and outcomes in conjunction with spatial location in rats performing a dynamic delayed non-match to position task. PLoS ONE 11(2): e0149019. [DOI] [PMC free article] [PubMed] [Google Scholar]
- Paxinos G, Watson C. (1998) The Rat Brain in Stereotaxic Coordinates (4th edn). San Diego, CA: Academic Press. [Google Scholar]
- Porter MC, Burk JA, Mair RG. (2000) A comparison of the effects of hippocampal or prefrontal cortical lesions on three versions of delayed non-matching-to-sample based on positional or spatial cues. Behavioural Brain Research 109(1): 69–81. [DOI] [PubMed] [Google Scholar]
- Porter MC, Mair RG. (1997) The effects of frontal cortical lesions on remembering depend on the procedural demands of tasks performed in the radial arm maze. Behavioural Brain Research 87(2): 115–125. [DOI] [PubMed] [Google Scholar]
- Pratt WE, Mizumori SJY. (2001) Neurons in rat medial prefrontal cortex show anticipatory rate changes to predictable differential rewards in a spatial memory task. Behavioural Brain Research 123(2): 165–183. [DOI] [PubMed] [Google Scholar]
- Raggozzino ME, Detrick S, Kesner RP. (1999) Involvement of the prelimbic-infralimbic areas of the rodent prefrontal cortex in behavioral flexibility for place and response learning. Journal of Neuroscience 19(11): 4585–4594. [DOI] [PMC free article] [PubMed] [Google Scholar]
- Rigotti M, Barak O, Warden MR, et al. (2013) The importance of mixed selectivity in complex cognitive tasks. Nature 497(7451): 585–590. [DOI] [PMC free article] [PubMed] [Google Scholar]
- Rushworth MFS, Noonan MP, Boorman ED, et al. (2011) Frontal cortex and reward-guided learning and decision-making. Neuron 70(6): 1054–1069. [DOI] [PubMed] [Google Scholar]
- Schmitzer-Torbert N, Jackson J, Henze D, et al. (2005) Quantitative measures of cluster quality for use in extracellular recordings. Neuroscience 131(1): 1–11. [DOI] [PubMed] [Google Scholar]
- Seamans JK, Floresco SB, Phillips AG. (1995) Functional differences between the prelimbic and anterior cingulate regions of the rat prefrontal cortex. Behavioral Neuroscience 109(6): 1063–1073. [DOI] [PubMed] [Google Scholar]
- Sesack SR, Deutch AY, Roth RH, et al. (1989) Topographical organization of the efferent projections of the medial prefrontal cortex in the rat: An anterograde tract-tracing study with Phaseolus vulgaris leucoagglutinin. Journal of Comparative Neurology 290(2): 213–242. [DOI] [PubMed] [Google Scholar]
- Totah NKB, Jackson ME, Moghaddam B. (2013) Preparatory attention relies on dynamic interactions between prelimbic cortex and anterior cingulate cortex. Cerebral Cortex 23(3): 729–738. [DOI] [PMC free article] [PubMed] [Google Scholar]
- Totah NKB, Kim YB, Homayoun H, et al. (2009) Anterior cingulate neurons represent errors and preparatory attention within the same behavioral sequence. Journal of Neuroscience 29(20): 6418–6426. [DOI] [PMC free article] [PubMed] [Google Scholar]
- Tran-Tu-Yen DAS, Marchand AR, Papt J-R, et al. (2009) Transient role of the rat prelimbic cortex in goal-directed behaviour. European Journal of Neuroscience 30(3): 464–471. [DOI] [PubMed] [Google Scholar]
- Van Enden CG, Lamme VA, Uylings HB. (1992) Heterotopic cortical afferents to the medial prefrontal cortex in the rat. A combined retrograde and anterograde tracer study. European Journal of Neuroscience 4(1): 77–97. [DOI] [PubMed] [Google Scholar]
- Vertes RP. (2004) Differential projections of the infralimbic and prelimbic cortex in the rat. Synapse 51(1): 32–58. [DOI] [PubMed] [Google Scholar]
- Young HL, Stevens AA, Kivlahan EK, et al. (1996) A comparison of temporal decay in place memory tasks in rats with lesions affecting thalamus, frontal cortex, or the hippocampal system. Behavioral Neuroscience 110(6): 1244–1260. [DOI] [PubMed] [Google Scholar]


