Abstract
Spatial perception is an important part of a listener's experience and ability to function in everyday environments. However, the current understanding of how well listeners can locate sounds is based on measurements made using relatively simple stimuli and tasks. Here the authors investigated sound localization in a complex and realistic environment for listeners with normal and impaired hearing. A reverberant room containing a background of multiple talkers was simulated and presented to listeners in a loudspeaker-based virtual sound environment. The target was a short speech stimulus presented at various azimuths and distances relative to the listener. To ensure that the target stimulus was detectable to the listeners with hearing loss, masked thresholds were first measured on an individual basis and used to set the target level. Despite this compensation, listeners with hearing loss were less accurate at locating the target, showing increased front–back confusion rates and higher root-mean-square errors. Poorer localization was associated with poorer masked thresholds and with more severe low-frequency hearing loss. Localization accuracy in the multitalker background was lower than in quiet and also declined for more distant targets. However, individual accuracy in noise and quiet was strongly correlated.
I. INTRODUCTION
This study is part of a larger body of work aimed at developing laboratory-based hearing tests that better assess real-life hearing performance in listeners with hearing impairment (HI). The primary motivations are to understand why this population experiences such extreme difficulties in noisy listening situations relative to listeners with normal hearing (NH) as well as to enable more accurate and relevant measures of hearing-aid performance than are currently possible. Though real-world performance has typically been studied using questionnaires or field trials, laboratory tests offer a degree of control that is not possible with these other approaches. Our efforts in this area have focused on the perception of speech in multitalker environments, including measures of detection (Weller et al., 2016b), intelligibility (Best et al., 2015), and localization (Weller et al., 2016a).
In the current study, we revisited sound localization in realistic environments. Although spatial hearing has been identified as a problem for listeners with hearing loss in their daily lives (e.g., Noble et al., 1995; Gatehouse and Noble, 2004) and might be a particular issue for hearing-aid wearers (e.g., Byrne and Noble, 1998; Keidser et al., 2006; Van den Bogaert et al., 2006; Best et al., 2010; Mueller et al., 2012; Cubick et al., 2018), there have been very few attempts to assess spatial hearing under realistic conditions in the laboratory. Brungart and colleagues (Brungart et al., 2014) described an innovative task in which listeners were asked to identify and localize non-speech environmental sounds that were added or removed from a complex scene. Using this task, they found differences across listeners and conditions that were not always predictable from a more traditional localization task. In the context of multitalker speech mixtures, Weller et al. (2016a) proposed a new paradigm in which listeners were asked to estimate the location of two to six competing talkers in a simulated cafeteria environment. The results indicated that HI listeners were poorer than NH listeners both at estimating the number of talkers present and at localizing them in azimuth and in distance. However, the interpretation of the localization results was complicated by the fact that multiple responses were given and had to be mapped to the presented talkers. The resultant mapping was only an estimate and, as it was based on error minimization, it may have led to an underestimate of the errors in some cases. In the present study, we used a similarly complex multitalker environment, but combined it with a more traditional single-response localization task. Specifically, we examined the localization of a target word presented amidst competing talkers in a simulated cafeteria. Our experimental design was focused on localization accuracy in the horizontal dimension, but included targets at different distances from the listener.
Based on previous research using simpler stimuli, we expected to find effects of background noise and of the distance between the target and the listener. Localization performance in NH listeners is very good in quiet but declines in the presence of noise or competing talkers (Lorenzi et al., 1999b; Drullman and Bronkhorst, 2000; Kopčo et al., 2010) and with increasing distance/reverberation (Rychtáriková et al., 2009; Ihlefeld and Shinn-Cunningham, 2011). Moreover, localization in rooms is thought to be aided by the precedence effect (e.g., Litovsky et al., 1999), which is weakened in background noise (Chiang and Freyman, 1998; Freyman et al., 2014), and thus it is possible that reverberation effects would be exacerbated in noise.
We also predicted a detrimental effect of hearing loss on localization in this experiment. While there are many HI listeners for whom horizontal localization in quiet is in the normal range (e.g., Best et al., 2010; Best et al., 2011), accuracy appears to suffer when losses are asymmetric or unilateral and when the loss in the low to mid frequencies is very severe (e.g., Noble et al., 1994; Brungart et al., 2017). Only a few studies have examined localization in noise in HI listeners, and they reported a larger effect of noise than in NH listeners (Lorenzi et al., 1999a; Best et al., 2011). There are also very few studies examining effects of reverberation on localization accuracy in HI listeners. However, based on a study showing that the precedence effect is weakened in some HI listeners (Akeroyd and Guy, 2011), we expected that the reverberation in our environment might pose a particular problem for some listeners, especially for increasingly distant targets.
One particular challenge with measuring localization in the presence of noise and distractors is that the detectability of the target must be considered. In the study by Lorenzi et al. (1999b), who reported a decline in localization accuracy with signal-to-noise ratio (SNR), a decline in target detection was also reported. This leaves open the possibility that random responses to undetected targets may have corrupted the localization data. Two solutions to this problem have been considered. First, the localization task can incorporate a detection task, such that listeners only give a response if they detect the target (Kopčo et al., 2010; Best et al., 2011). Alternatively, the target and background levels can be carefully set to ensure that targets will be detectable for all of the target locations that will be included in the localization study. The feasibility of this approach was examined by Weller et al. (2016b), who measured masked detection thresholds for a target in a simulated cafeteria for a large range of target locations and listeners. Based on those data, a model for target detectability was derived with the idea that it could be used to set target levels for a localization experiment. In the current study, directly following up on this idea, we took into account masked thresholds for the target stimulus in the cafeteria environment, on an individual basis, when setting levels for the localization experiment.
II. METHODS
A. Participants
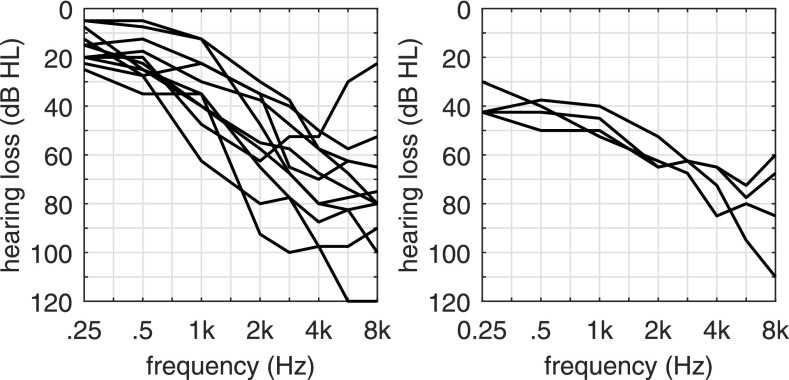
Eight listeners with normal hearing and 15 listeners with bilateral sensorineural hearing loss participated in the study. The NH listeners were screened to ensure that they had audiometric thresholds below 20 dB hearing level (HL) at standard audiometric frequencies. The HI listeners had symmetric losses, with no more than one threshold between 250 and 6000 Hz showing a difference between ears of more than 10 dB HL. The four-frequency (500, 1000, 2000, and 4000 Hz) average hearing loss (4FAHL) of the HI listeners ranged between 26.9 and 64.4 dB HL (mean 48.7), and the audiograms are shown in Fig. 1. The subjects with significant low-frequency hearing loss (LFHL, i.e., with average audiometric thresholds at 250, 500, and 1000 Hz of more than 40 dB HL) are shown in the right figure panel (N = 4), and the remaining subjects in the left figure panel (N = 11). The age range for the NH group was 27–39 yr (mean 31.3) and for the HI group was 54–91 yr (mean 73.7). Age and hearing loss were only weakly correlated in the HI participants (4FAHL: r = 0.46, p = 0.08; LFHL: r = 0.58, p = 0.02). All participants were paid a small gratuity for their participation. The treatment of participants was approved by the Australian Hearing Ethics Committee and conformed in all respects to the Australian government's National Statement on Ethical Conduct in Human Research.
FIG. 1.
Audiograms for the HI listeners, averaged over left and right ears. The left panel shows audiograms for the eleven subjects with a LFHL below 40 dB; the right panel highlights the four subjects with a more severe LFHL.
B. Stimuli
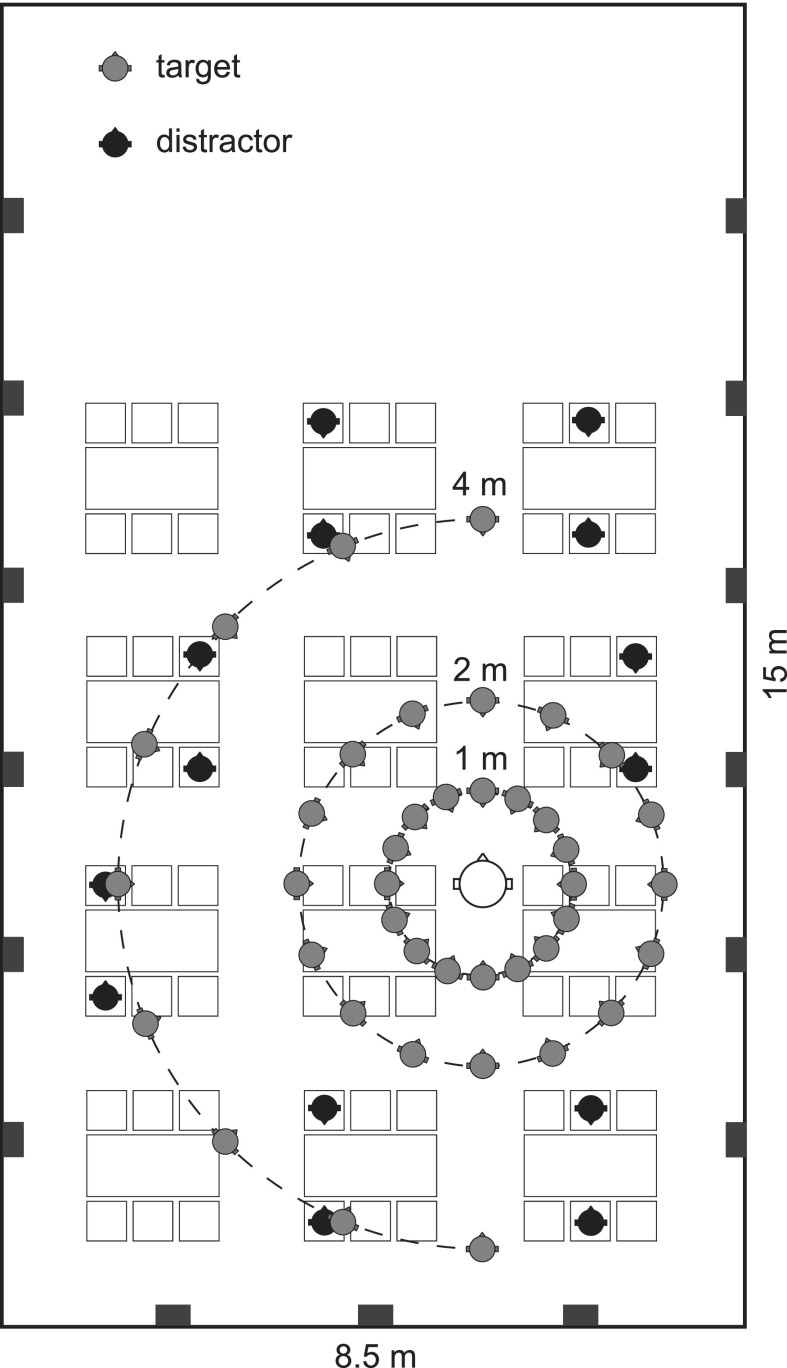
The cafeteria environment shown in Fig. 2 was simulated in ODEON software (Odeon A/S, Lyngby, Denmark) and played back to a listener via a spherical array of 41 loudspeakers inside an anechoic chamber using the LoRA toolbox (Favrot and Buchholz, 2010). The environment was similar to the one used in previous studies (Best et al., 2015; Weller et al., 2016a; Weller et al., 2016b), and included a kitchen area at one end of the room, and tables and padded chairs in the main area. The floor was simulated as 6-mm pile carpet on closed-cell foam and the ceiling as 25 mm of mineral wool suspended by 200 mm from a concrete ceiling. The walls were either built of brick or thick plasterboard, and contained large single-layer glass windows between exposed concrete beams. The dimensions of the cafeteria were 8 m × 15 m × 2.8 m (width × length × height) and the reverberation time (T60) was approximately 0.5 s for a sound source with the directivity of a human talker.
FIG. 2.
Schematic of the simulated room including the listener (large open head), distractors (black heads), and potential target locations (gray heads).
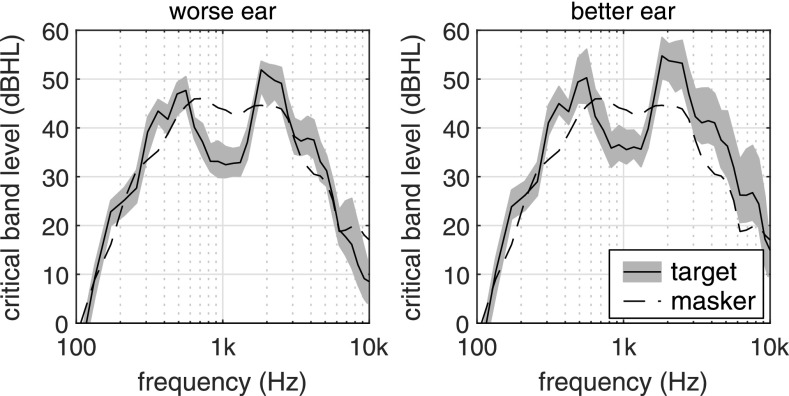
The background was identical to that used in Best et al. (2015) and Weller et al. (2016b). It consisted of seven pairs of talkers (mixture of male and female) engaged in scripted conversations on everyday topics. The 14 talkers were situated in different places within the simulated room with various distances and facing angles relative to the listener. The conversations were summed such that there were generally seven concurrent voices at any moment in time. The background was presented continuously throughout a block by looping segments of approximately 5 min at a fixed level of 65 dB sound pressure level (SPL) (measured in the center of the array). The direct-to-reverberant energy ratio (DRR) for the distractors measured with an omni-directional microphone at the listener's location ranged from −15.1 to −0.9 dB with a mean value of −7.2 dB. The long-term spectrum level of the combined distractor measured with a Bruel&Kjaer (Skodsborgvej 307, 2850 Naerum, Denmark) type 4128 C Head and Torso Simulator (HATS), evaluated within critical bands (Patterson et al., 1988), and averaged across ears, is shown in Fig. 3 (dashed lines). To simplify comparisons with the individual audiograms shown in Fig. 1, the spectrum levels were plotted relative to normal-hearing pure-tone thresholds (or audiometric “standard reference zero”) using Table I of ISO-389 (1997).
FIG. 3.
Critical band levels measured with a HATS at the location of the listener and plotted relative to normal-hearing pure-tone thresholds. The combined distractor level averaged across ears is shown by the dashed lines. The mean level (solid lines) and level range (grey shaded areas) of the 41 target stimuli are shown separately for the ear with the better (left panel) and worse (right panel) level, which, dependent on the target direction, can either refer to the left or right ear.
The target was the word “two” spoken by a female talker (as per Weller et al., 2016b), and was also simulated to be in the room, at different distances and azimuthal angles relative to the listening position (see below). The duration of the original target word was 0.59 s (1.62 s with reverberation). The average DRR calculated from the room impulse responses for the target source at 1, 2, and 4 m (averaged across azimuths) was 9.2 ± 0.9 dB, 1.4 ± 2.9 dB, and −3.8 ± 1.4 dB, respectively. The corresponding speech-weighted DRRs at the ears of the HATS inside the anechoic playback room were 0.4 ± 1.0 dB, −5.7 ± 2.5 dB, and −10.3 ± 1.6 dB at the worse ear and 4.6 ± 1.4 dB, −1.7 ± 2.8 dB, and −6.7 ± 1.4 dB at the better ear, respectively.
C. Procedures
The experiment was broken into two parts. In the first part, a masked detection threshold was measured for the target word at a single location in the simulated cafeteria. This threshold was then used to set the target level (and hence the SNR) for the second part of the experiment, in which localization accuracy was measured. Listeners were tested over one to two appointments of 2–2.5 h each.
For both parts of the experiment, listeners were seated on a chair with their head at the center of the loudspeaker array. They were instructed to keep their head oriented towards the front during stimulus presentation. Responses were given via a graphical user interface (GUI) presented on the touchscreen of an iPad, which was connected to the test computer via WiFi using the xDisplay software.
1. Masked thresholds
Masked thresholds were measured for the target word positioned at 0° azimuth and 2 m distance using the procedure described in Weller et al. (2016b). Briefly, an adaptive one-up, two-down staircase procedure estimated the 70.7%-correct point on the psychometric function (Levitt, 1971). The starting SNR was +5 dB and the initial step size was 8 dB, decreasing to 4 and 2 dB at the second and forth reversals. The track was terminated after 12 reversals, and the masked threshold was determined as the mean value of the SNR at the last eight reversals.
The task was a three-alternative forced choice. On each trial, three intervals were defined, one of which contained the target in addition to the continuous masker. The active interval was indicated to the subjects by a color change of three buttons on the GUI. After all three intervals had passed the subjects selected the interval in which they had detected the target stimulus by pressing the corresponding button. Feedback was provided after every trial by displaying a green “correct” or a red “false” message on the GUI. Two masked thresholds were measured per subject and averaged.
2. Localization experiment
Localization was measured for 16 target azimuths in the horizontal plane (evenly spaced by 22.5°) at a distance of 1 or 2 m, as well as for nine target azimuths at a distance of 4 m (the left hemifield only; see Fig. 2). This resulted in 41 possible target locations. Each location was tested five times in blocks of 41 trials, and the order of trials was randomized within each block and for each listener.
For both NH and HI listeners, localization was examined in quiet using a fixed target level of 65 dB SPL. This level was chosen to be ecologically relevant, representing a talker with a normal-to-raised vocal effort level for the target at 1 m, and a talker with a raised or loud vocal effort level for the targets at 2 and 4 m, respectively (ANSI, 1997, Table I). Note also that the target level refers to that of the entire reverberant signal, meaning that for distant sources the direct sound level was relatively lower because of a larger contribution of reverberant energy to the overall level. The average critical band level (and range) of the target stimuli measured with the HATS at the listener's location is shown in Fig. 3 relative to normal-hearing pure-tone thresholds. To focus on the most relevant part of the target speech, the levels were only calculated over the first 0.59 s of the reverberant target (i.e., the duration of the anechoic target).
Localization was also tested in the cafeteria noise at a pre-determined SNR. For NH listeners, this SNR was fixed at +1 dB (which was about 10 dB above masked threshold, see below). For HI listeners, the SNR was individually set to be 10 dB above their masked threshold. This approach was taken to roughly match the sensation levels experienced by the two groups in the noise condition. Note that, with respect to the spectra shown in Fig. 3, this individualization in the SNR amounts to a vertical shift in the target curve.
Responses were given by placing a marker on a circle representing the azimuthal plane (regardless of the presented distance). For guidance, the circle had tick marks every 11.25° and written labels every 45°. Every second tick coincided with the horizontal loudspeakers of the three dimensional (3 D) playback array, which were visible to the subjects.
Localization performance for each listener was summarized by calculating the root-mean-square (RMS) error as well as the number of confusions between the front and back/rear hemisphere. The RMS error was calculated according to
With N the number of considered target locations, ϕRef,i the physical azimuth angle of the target source with index i in radians, and ϕi the corresponding responded azimuth angle. Within the RMS error the front and rear hemisphere are basically folded onto each other to solely evaluate the lateral angular error. To evaluate the number of confusions between the front and rear hemisphere, front–back and back–front confusions were evaluated for all target sources except for physical azimuth angles of 67.5° ≤ ϕRef,i ≤ 112.5° and −112.5° ≤ ϕRef,i ≤ −67.5° (i.e., omitting the physical target sources at +90° and −90°).
III. RESULTS
A. Masked thresholds
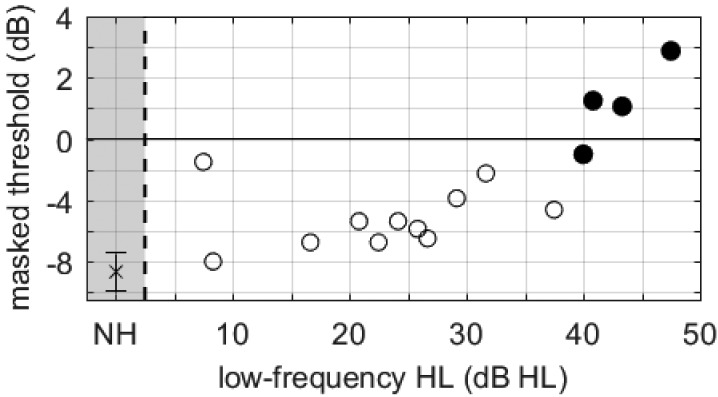
Masked thresholds for the NH listeners were relatively uniform, ranging from −9.5 to −6.4 dB. The average threshold was −8.7 dB (similar to that measured for a different cohort of listeners under similar conditions in Weller et al., 2016b). Masked thresholds varied more widely across HI listeners, ranging from −8.0 to +5.8 dB, with an average of −3.2 dB. The masked thresholds of the HI listeners were correlated with their LFHL (r = 0.73, p = 0.002). As shown in Fig. 4, it appears that LFHL had only a small effect on the masked threshold up to about 40 dB (open symbols; note that the subject with the lowest LFHL is an exception), but above 40 dB the effect increased rather drastically (filled symbols). The masked thresholds were only weakly correlated with the 4FAHL (r = 0.5, p = 0.06) and were uncorrelated with the high-frequency hearing loss averaged over audiometric thresholds at 2000, 3000, and 4000 Hz (r = 0.23, p = 0.42). This highlights the particular impact of the hearing loss at low frequencies on the masked thresholds.
FIG. 4.
Masked thresholds as a function of LFHL for each of the 15 HI listeners. Filled symbols indicate those four listeners with LFHL of 40 dB or greater. The mean threshold (and standard deviation) for the NH group is shown on the far left.
B. Localization experiment
1. Front–back confusions
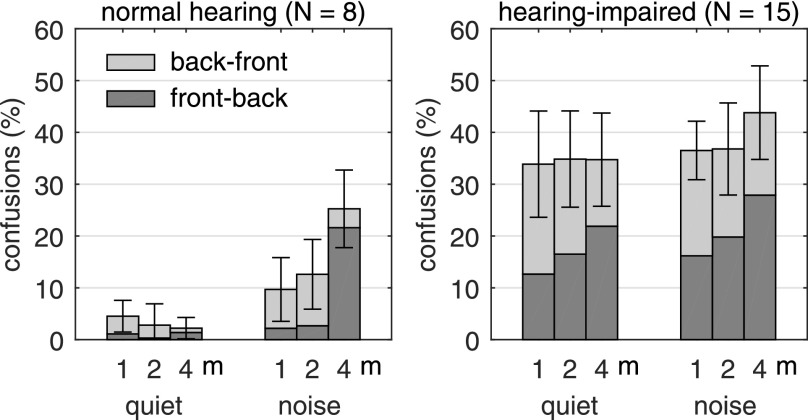
Figure 5 shows the average number of front–back and back–front confusions (as a percentage of total trials) for the NH group (left panel) and the HI group (right panel). The different clusters of bars correspond to quiet and noise condition as labelled, and the three bars in each cluster show data for the three distances. Each bar presents the total number of confusions, broken down into front–back (dark gray) and back–front confusions (light gray). Confusions were present for both groups in all conditions. The lowest confusion rate was for NH listeners in quiet (around 3% of trials) but this rate increased in background noise. In noise, confusion rates were similar for the two closest distances but there was a marked increase in confusions for sources at 4 m. The highest confusion rate in the NH group was around 25%. A linear mixed-effects model with subjects as random intercepts revealed a significant main effect of distance [F(2,35) = 9.8, p <0.001] and noise [F(1,35) = 88.1, p < 0.001] as well as a significant interaction [F(2,35) = 15.7, p < 0.001]. HI listeners showed a large number of confusions (>35%) with only slight variations across conditions. Only the effect of noise was significant [F(1,72) = 11.4, p = 0.001]. Two-sample t-tests revealed that the number of confusions was significantly larger in the HI group than for the NH group for all conditions (p < 0.01).
FIG. 5.
Mean front–back and back–front confusion rates as a percentage of total trials. Error bars indicate ±1 standard deviation.
2. Horizontal localization accuracy
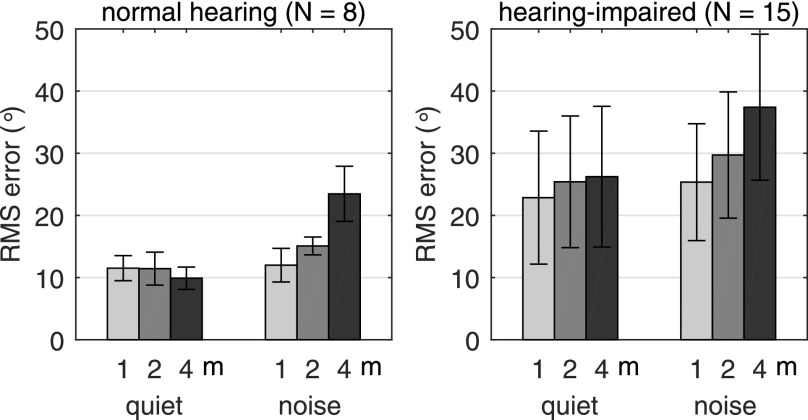
Figure 6 shows the average horizontal RMS error in degrees for the NH group (left panel) and the HI group (right panel) following the layout used in Fig. 5. The general pattern of the data was similar to that of the confusion data. Errors were lowest for the NH group listening in quiet (around 10°) and increased in background noise. In noise, there was a systematic effect of distance, with errors increasing with increasing distance. This was not the case in quiet. A linear mixed-effects model with subjects as random intercepts revealed significant main effects of distance [F(2,35) = 16.1, p < 0.001] and noise [F(1,35) = 66.5, p < 0.001] as well as a significant interaction [F(2,35) = 29.7, p < 0.001]. Multivariate t adjusted pair-wise comparisons showed that the RMS error in noise at a distance of 4 m was significantly different from all the other conditions (p < 0.001), but no significant differences were observed between any of the other conditions. The mean RMS error for HI listeners showed a similar pattern as for the NH listeners, with significant main effects of distance [F(2,70) = 18.3, p < 0.001] and noise [F(1,70)=32.9, p < 0.001] as well as a significant interaction [F(2,70) = 6.4, p = 0.003]. Again, pair-wise comparisons revealed that the only difference came from the RMS error in noise at a distance of 4 m. Two-sample t-tests revealed significantly higher RMS errors for the HI listeners than for the NH listeners in all conditions (p < 0.001).
FIG. 6.
Mean horizontal RMS errors and ±1 standard deviations.
A separate analysis of the RMS error for target sources in the front and back revealed an average RMS error that for the NH subjects was consistently larger (by about 8°) in the back (p < 0.05; paired t-test), except for the target in noise condition at 4 m where no difference was observed. For HI subjects, this difference was about 2°–3° for all conditions but only significant (p < 0.05; paired t-test) for two out of the six conditions.
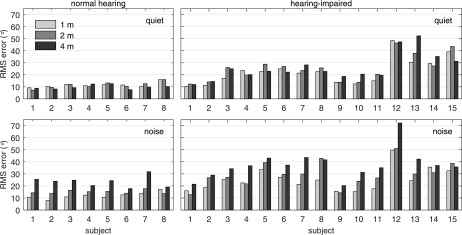
A closer inspection of the individual data revealed a subgroup of four HI listeners who showed particularly large RMS errors in quiet (>30°) (see Fig. 7, subjects 12–15). Even though these errors are still below guessing performance with an RMS error of 74°, subjects 12 and 13 seem to mainly distinguish between sources from left and right. These four subjects had the highest masked thresholds of the group of 15 (see Fig. 4), with thresholds ranging from −1 to +6 dB. These subjects also had the most severe LFHL (see Figs. 1 and 4). More broadly, across all 15 HI listeners, RMS errors in quiet were significantly correlated with masked thresholds (r = 0.60, p = 0.02) and LFHL (r = 0.72, p = 0.003). In noise, these correlations with masked thresholds (r = 0.20, p = 0.49) and with LFHL (r = 0.48, p = 0.07) were reduced. This was most likely due to the individual SNR adjustment that was applied in the localization task in noise, which was based on individual masked thresholds and effectively tested subjects with reduced LFHL (and poorer masked thresholds) at higher SNRs. However, the RMS errors in quiet and noise were strongly correlated (r = 0.84, p < 0.001).
FIG. 7.
Individual horizontal RMS errors. Hearing-impaired subjects are ordered according to their LFHL.
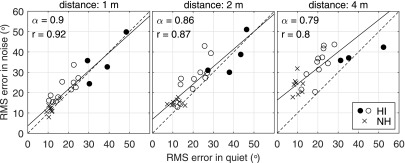
To further understand the effect of noise on the horizontal RMS error, Fig. 8 shows the individual RMS errors in noise versus quiet separately for the three distances. The correlation between the RMS error in noise and quiet was always highly significant (p < 0.001), but decreased slightly with increasing distance from r = 0.92 at 1 m to r = 0.80 at 4 m. At the same time, the slope of the regression line fitted to the data decreased. This reflects the fact that there was a detrimental effect of the noise on the RMS error that increased with increasing distance more for the better performing subjects than for the poorer performing subjects. This effect explains why the RMS error in noise is less correlated with LFHL than in quiet, and again may relate to the different SNRs provided to each listener.
FIG. 8.
Individual horizontal RMS errors in noise versus quiet for the three different distances. Note that for a distance of 4 m (right panel) the RMS error for subject 12 of 72.2° in noise (and 47.4° in quiet) is out of the shown range.
IV. DISCUSSION
A. Ensuring detectability when measuring sound localization
An important element of this experiment was the measurement of masked thresholds prior to measuring localization in noise. Given the wide variation in thresholds (especially in the HI group) this was critical for being able to ensure that the target stimuli were detectable, and thus that the localization data were not contaminated by random responses. One potential issue with our approach is that thresholds were only measured at a single reference position (0°, 2 m). However, our previous data in NH listeners (Weller et al., 2016b) showed that thresholds for other azimuths and distances increased by no more than 5 dB (this maximum value was reached for a location directly behind the listener at a distance of 4 m). Thus, we can be confident that the SNR delivered to the NH group (corresponding to a sensation level of 10 dB) was sufficient to ensure that all targets were detectable. While we do not have equivalent detection data for HI listeners, if we assume that thresholds would show similar variations as a function of distance and location, it follows that at 10 dB sensation level all targets should have been detectable. Informal reports from the listeners after localization testing suggested that this was the case.
B. Localization performance in NH listeners
The localization results obtained here in NH listeners agree broadly with data from previous studies that examined speech localization, giving some validity to our general approach. For example, Best et al. (2010) used nose-pointing to measure the localization of single words presented in an anechoic room for locations on a sphere surrounding the listener. In that study, mean lateral angle errors (equivalent to our RMS errors) were 8°, and mean front–back confusion rates were 5%. In a different study, Best et al. (2011) measured the localization of a target word that was presented alone or with four simultaneous distractor words in a quiet room. Although their range of locations was restricted to the frontal horizontal plane at a fixed distance, they reported RMS errors of 6.9° in quiet, which increased to 12.3° with the distractors. In the study of Weller et al. (2016a), when a single talker was presented in the simulated cafeteria, NH listeners achieved average RMS errors of 2°. This value increased to 10.6° when there were six concurrent talkers that had to be localized. Errors on this task were likely tempered by the fact that the target stimuli were ongoing monologues which participants could listen to for up to 45 s while being free to turn their head. Mueller et al. (2012) presented NH listeners with a target sound that was embedded in a spatially diffuse background relevant for the target sound (e.g., a voice in a cafeteria, a bird in a forest) at an SNR of 3 dB. Across four such environments they reported mean RMS errors of around 10° and front–back confusion rates of around 9%.
Few studies have measured horizontal localization systematically at different distances. One that we are aware of found an increase in RMS error as distance from the listener increased in the near-field (from 15 to 170 cm; Ihlefeld and Shinn-Cunningham, 2011). Interestingly, for the more distant ranges tested in this study, our NH listeners did not show an effect of distance in quiet, although there was an effect in noise. We suppose that this effect is related to the fact that the precedence effect, which is thought to support localization in reverberation, is disturbed in noise (Chiang and Freyman, 1998; Freyman et al., 2014). The effect of distance in noise may also have been exacerbated by changes in the degree of target detectability with distance (Weller et al., 2016b) even though all targets were above detection thresholds.
C. Localization performance in HI listeners
Localization accuracy was poorer overall in HI listeners than in NH listeners, and showed large individual differences. In quiet, front–back confusion rates were around 35% on average, which is somewhat higher than reported by Best et al. (2010) for speech presented under anechoic conditions (26%). RMS errors were also higher here than in that study (25° vs 14°) and much higher than in Weller et al. (2016a) for a single ongoing talker in a cafeteria setting (9°). One of our hypotheses, based on reports that the localization dominance is weaker in listeners with HI (Akeroyd and Guy, 2011) was that there would be a stronger effect of distance in the HI group. Contrary to this hypothesis, we observed similar trends for both groups, where there was an effect of distance in noise but not in quiet.
There was some evidence in our data that localization accuracy in quiet was related to low-frequency hearing thresholds, which is consistent with previous reports (e.g., Noble et al., 1994; Brungart et al., 2017). This relationship persisted, although was weaker, in the presence of noise. This result suggests that low-frequency hearing loss may disrupt the neural coding of interaural time differences, a low-frequency localization cue that is thought to be the primary cue for horizontal localization. Other studies that have directly measured sensitivity to this cue have shown effects of hearing loss, although the correlation with audiometric thresholds is generally not strong (e.g., Best and Swaminathan, 2019).
Another possibility is that differences in the audibility of the target stimulus contributed to differences in localization accuracy in this experiment. This possibility was perhaps greatest in the quiet condition, where the same target level was used for all listeners, and can be appreciated by comparing the critical band levels (in dBHL) of the target shown in Fig. 3 to the individual pure-tone audiograms (Fig. 1). Even though this comparison should be handled with care, it is clear that the subjects with a low-frequency HL of more than 40 dBHL could not hear a substantial portion of the target (and its associated spatial cues) at low frequencies. In contrast, low-frequency target audibility was not a major issue for the other subjects with more common sloping or high-frequency hearing losses. In noise, where masked detection is more of an issue than absolute detection, the use of an individualized SNR minimized but did not eliminate effects of audibility. This issue was also raised by Best et al. (2011), who checked for detectability of targets on a trial-by-trial basis. It is certainly possible that even if a portion of the target stimulus was detectable, other portions of the target that are potentially useful for localization may have been below threshold. In addition to audibility, it is also possible that the reduced spectral and temporal resolution commonly associated with hearing loss (Moore, 2007) may have further reduced access to portions of the target (and its associated spatial cues) in the fluctuating multitalker background. We note that this general issue of reduced audibility of spatial cues may generalize to real-world listening situations too, and could explain why HI listeners sometimes have trouble locating sounds that they can “hear.”
D. Applications of this approach
The primary goal of the current study, and its novel contribution, was to measure sound localization in a highly realistic environment containing competing talkers and reverberation. One interesting and surprising finding was that there were strong correlations between the data collected in the presence of the competing talkers and the data collected in quiet. This suggests that relevant information about a listener's real-world spatial abilities may be gleaned from a relatively simple experimental setup in which the listener locates a talker at different distances in a quiet but reverberant room. On the other hand, some features of the data (e.g., effects of distance) were only revealed in the presence of noise.
The fact that the data were obtained using a rather conventional single-source identification task was useful in that comparisons could be drawn to previous studies using simpler stimuli (see above). However, it can also be argued that this simple task is very limited in representing the way in which listeners use spatial hearing in their daily lives where sound localization is part of a much broader task of maintaining awareness of multiple sounds and navigating within the environment. Thus an approach like ours should be viewed as a complement to other approaches that measure spatial perception in realistic environments using different approaches. One of our own approaches, mentioned above, measures localization for multiple talkers simultaneously (Weller et al., 2016a). In another example, recent work by Paluch and colleagues (Paluch et al., 2015; Paluch et al., 2017; Paluch et al., 2018) analyses the communication behavior of listeners in simulated environments to uncover challenges related to spatial awareness. Together, these studies are providing convergent evidence that hearing loss is associated with disturbances to spatial perception in real-world environments. They also offer a means for measuring ecologically relevant changes in spatial perception with the provision of hearing aids or other assistive devices.
ACKNOWLEDGMENTS
The authors acknowledge the financial support of the HEARing CRC, established and supported under the Australian Government's Cooperative Research Centres Program. V.B. was also supported by NIH/NIDCD Grant No. DC015760. We are grateful to Gitte Keidser for many useful discussions and to Katrina Freeston for her help with audiology and data collection.
References
- 1. Akeroyd, M. A. , and Guy, F. H. (2011). “ The effect of hearing impairment on localization dominance for single-word stimuli,” J. Acoust. Soc. Am. 130, 312–323. 10.1121/1.3598466 [DOI] [PMC free article] [PubMed] [Google Scholar]
- 2.ANSI (1997). S3.5, American National Standard on Methods for Calculation of the Speech Intelligibility Index ( Acoustical Society of America, New York: ). [Google Scholar]
- 3. Best, V. , Carlile, S. , Kopčo, N. , and van Schaik, A. (2011). “ Localization in speech mixtures by listeners with hearing loss,” J. Acoust. Soc. Am. 129, EL210–EL215. 10.1121/1.3571534 [DOI] [PubMed] [Google Scholar]
- 4. Best, V. , Kalluri, S. , McLachlan, S. , Valentine, S. , Edwards, B. , and Carlile, S. (2010). “ A comparison of CIC and BTE hearing aids for three-dimensional localization of speech,” Int. J. Audiol. 49, 723–732. 10.3109/14992027.2010.484827 [DOI] [PubMed] [Google Scholar]
- 5. Best, V. , Keidser, G. , Buchholz, J. M. , and Freeston, K. (2015). “ An examination of speech reception thresholds measured in a simulated reverberant cafeteria environment,” Int. J. Audiol. 54, 682–690. 10.3109/14992027.2015.1028656 [DOI] [PMC free article] [PubMed] [Google Scholar]
- 6. Best, V. , and Swaminathan, J. (2019). “ Revisiting the detection of interaural time differences in listeners with hearing loss,” J. Acoustc. Soc. Am. 145, EL508–EL513. 10.1121/1.5111065 [DOI] [PMC free article] [PubMed] [Google Scholar]
- 7. Brungart, D. S. , Cohen, J. , Cord, M. , Zion, D. , and Kalluri, S. (2014). “ Assessment of auditory spatial awareness in complex listening environments,” J. Acoust. Soc. Am. 136, 1808–1820. 10.1121/1.4893932 [DOI] [PubMed] [Google Scholar]
- 8. Brungart, D. S. , Cohen, J. I. , Zion, D. , and Romigh, G. (2017). “ The localization of non-individualized virtual sounds by hearing impaired listeners,” J. Acoust. Soc. Am. 141, 2870–2881. 10.1121/1.4979462 [DOI] [PubMed] [Google Scholar]
- 9. Byrne, D. , and Noble, W. (1998). “ Optimizing sound localization with hearing aids,” Trends Amplif. 3, 51–73. 10.1177/108471389800300202 [DOI] [PMC free article] [PubMed] [Google Scholar]
- 10. Chiang, Y. C. , and Freyman, R. L. (1998). “ The influence of broadband noise on the precedence effect,” J. Acoust. Soc. Am. 104, 3039–3047. 10.1121/1.423885 [DOI] [PubMed] [Google Scholar]
- 11. Cubick, J. , Buchholz, J. M. , Best, V. , Lavandier, M. , and Dau, T. (2018). “ Listening through hearing aids affects spatial perception and speech intelligibility in normal-hearing listeners,” J. Acoust. Soc. Am. 144, 2896–2905. 10.1121/1.5078582 [DOI] [PMC free article] [PubMed] [Google Scholar]
- 12. Drullman, R. , and Bronkhorst, A. W. (2000). “ Multichannel speech intelligibility and talker recognition using monaural, binaural, and three-dimensional auditory presentation,” J. Acoust. Soc. Am. 107, 2224–2235. 10.1121/1.428503 [DOI] [PubMed] [Google Scholar]
- 13. Favrot, S. , and Buchholz, J. M. (2010). “ LoRA—A loudspeaker-based room auralization system,” Acust. Acta Acust. 96, 364–376. 10.3813/AAA.918285 [DOI] [Google Scholar]
- 14. Freyman, R. L. , Griffin, A. M. , and Zurek, P. M. (2014). “ Threshold of the precedence effect in noise,” J. Acoust. Soc. 135, 2923–2930. 10.1121/1.4869682 [DOI] [PMC free article] [PubMed] [Google Scholar]
- 15. Gatehouse, S. , and Noble, W. (2004). “ The speech, spatial and qualities of hearing scale (SSQ),” Int. J. Audiol. 43, 85–99. 10.1080/14992020400050014 [DOI] [PMC free article] [PubMed] [Google Scholar]
- 16. Ihlefeld, A. , and Shinn-Cunningham, B. G. (2011). “ Effect of source spectrum on sound localization in an everyday reverberant room,” J. Acoust. Soc. 130, 324–333. 10.1121/1.3596476 [DOI] [PMC free article] [PubMed] [Google Scholar]
- 17.ISO 389 (1997). 3rd ed “ Acoustics—Standard reference zero for the calibration of pure-tone air conduction audiometers” (International Organization for Standardization, Geneva, Switzerland).
- 18. Keidser, G. , Rohrseitz, K. , Dillon, H. , Hamacher, V. , Carter, L. , Rass, U. , and Convery, E. (2006). “ The effect of multi-channel wide dynamic range compression, noise reduction, and the directional microphone on horizontal localization performance in hearing aid wearers,” Int. J. Audiol. 45, 563–579. 10.1080/14992020600920804 [DOI] [PubMed] [Google Scholar]
- 19. Kopčo, N. , Best, V. , and Carlile, S. (2010). “ Speech localization in a multitalker mixture,” J. Acoust. Soc. Am. 127, 1450–1457. 10.1121/1.3290996 [DOI] [PMC free article] [PubMed] [Google Scholar]
- 20. Levitt, H. (1971). “ Transformed up-down methods in psychoacoustics,” J. Acoust. Soc. Am. 49, 467–477. 10.1121/1.1912375 [DOI] [PubMed] [Google Scholar]
- 21. Litovsky, R. Y. , Colburn, H. S. , Yost, W. A. , and Guzman, S. J. (1999). “ The precedence effect,” J. Acoust. Soc. Am. 106, 1633–1654. 10.1121/1.427914 [DOI] [PubMed] [Google Scholar]
- 22. Lorenzi, C. , Gatehouse, S. , and Lever, C. (1999a). “ Sound localization in noise in hearing-impaired listeners,” J. Acoust. Soc. Am. 105, 3454–3463. 10.1121/1.424672 [DOI] [PubMed] [Google Scholar]
- 23. Lorenzi, C. , Gatehouse, S. , and Lever, C. (1999b). “ Sound localization in noise in normal-hearing listeners,” J. Acoust. Soc. Am. 105, 1810–1820. 10.1121/1.426719 [DOI] [PubMed] [Google Scholar]
- 24. Moore, B. C. J. (2007). Cochlear Hearing Loss: Physiological, Psychological, and Technical Issues ( Wiley, Chichester, UK: ). [Google Scholar]
- 25. Mueller, M. F. , Kegel, A. , Schimmel, S. M. , Dillier, N. , and Hofbauer, M. (2012). “ Localization of virtual sound sources with bilateral hearing aids in realistic acoustical scenes,” J. Acoust. Soc. Am. 131, 4732–4742. 10.1121/1.4705292 [DOI] [PubMed] [Google Scholar]
- 26. Noble, W. , Byrne, D. , and Lepage, B. (1994). “ Effects on sound localization of configuration and type of hearing impairment,” J. Acoust. Soc. Am. 95, 992–1005. 10.1121/1.408404 [DOI] [PubMed] [Google Scholar]
- 27. Noble, W. , Ter-Horst, K. , and Byrne, D. (1995). “ Disabilities and handicaps associated with impaired auditory localization,” J. Am. Acad. Audiol. 6, 129–140. [PubMed] [Google Scholar]
- 28. Paluch, R. , Krueger, M. , Hendrikse, M. , Grimm, G. , Hohmann, V. , and Meis, M. (2018). “ Ethnographic research: The interrelation of spatial awareness, everyday life, laboratory environments, and effects of hearing aids,” in Proceedings of the 6th International Symposium on Auditory and Audiological Research, edited by Santurette S., Dau T., Christensen-Dalsgaard J., Tranebjærg L., Andersen T., and Poulsen T. ( Nyborg, Denmark: ), pp. 39–46. [Google Scholar]
- 29. Paluch, R. , Krüger, M. , Grimm, G. , and Meis, M. (2017). “ Moving from the field to the lab: Towards ecological validity of audio-visual simulations in the laboratory to meet individual behavior patterns and preferences,” in 20. Jahrestagung der Deutschen Gesellschaft für Audiologie ( Aalen, Deutschland: ). [Google Scholar]
- 30. Paluch, R. , Latzel, M. , and Meis, M. (2015). “ A new tool for subjective assessment of hearing aid performance: Analyses of interpersonal communication,” in Proceedings of the 5th Symposium on Auditory and Audiological Research, edited by Santurette S., Dau T., Dalsgaard J. C., Tranebjærg L., and Andersen T. ( Nyborg, Denmark: ), pp. 453–460. [Google Scholar]
- 31. Patterson, R. D. , Holdswort, J. , Nimmo-Smith, I. , and Rice, P. (1988). Svos final report: The auditory filterbank, Technical Report APU report 2341.
- 32. Rychtáriková, M. , Van den Bogaert, T. , Vermeir, G. , and Wouters, J. (2009). “ Binaural sound source localization in real and virtual rooms,” J. Audio Eng. Soc. 57, 205–220. [Google Scholar]
- 33. Van den Bogaert, T. , Klasen, T. J. , Moonen, M. , Van Deun, L. , and Wouters, J. (2006). “ Horizontal localization with bilateral hearing aids: Without is better than with,” J. Acoust. Soc. Am. 119, 515–526. 10.1121/1.2139653 [DOI] [PubMed] [Google Scholar]
- 34. Weller, T. , Best, V. , Buchholz, J. M. , and Young, T. (2016a). “ A method for assessing auditory spatial analysis in reverberant multitalker environments,” J. Am. Acad. Audiol. 27, 601–611. 10.3766/jaaa.15109 [DOI] [PubMed] [Google Scholar]
- 35. Weller, T. , Buchholz, J. M. , and Best, V. (2016b). “ Auditory masking of speech in reverberant multi-talker environments,” J. Acoust. Soc. Am. 139, 1303–1313. 10.1121/1.4944568 [DOI] [PubMed] [Google Scholar]


