

Abstract
Focal adhesion kinase (FAK) mediates vital cellular pathways during development. Despite its necessity, how FAK regulates and integrates with other signals during early embryogenesis remains poorly understood. We found that the loss of Fak1a impaired epiboly, convergent extension and hypoblast cell migration in zebrafish embryos. We also observed a clear disturbance in cortical actin at the blastoderm margin and distribution of yolk syncytial nuclei. In addition, we investigated a possible link between Fak1a and a well-known gastrulation regulator, Wnt5b, and revealed that the overexpression of fak1a or wnt5b could cross-rescue convergence defects induced by a wnt5b or fak1a antisense morpholino (MO), respectively. Wnt5b and Fak1a were shown to converge in regulating Rac1 and Cdc42, which could synergistically rescue wnt5b and fak1a morphant phenotypes. Furthermore, we generated several alleles of fak1a mutants using CRISPR/Cas9, but those mutants only revealed mild gastrulation defects. However, injection of a subthreshold level of the wnt5b MO induced severe gastrulation defects in fak1a mutants, which suggested that the upregulated expression of wnt5b might complement the loss of Fak1a. Collectively, we demonstrated that a functional interaction between Wnt and FAK signalling mediates gastrulation cell movements via the possible regulation of Rac1 and Cdc42 and subsequent actin dynamics.
Keywords: FAK, Wnt, gastrulation, cell migration, convergent extension, actin
1. Introduction
Vertebrate gastrulation is vital to establish germ layers and body axes by coordinated cell movements in zebrafish [1,2]. At mid-gastrulation, the prospective mesendoderm cells are internalized at the blastoderm margin to form the hypoblast [3,4]. Hypoblast cells migrate on the dorsal epiblast via tightly regulated cell–cell and cell–extracellular matrix (ECM) adhesions and move anteriorly to become mesendodermal layers. Meanwhile, ventral and lateral cells converge and extend anterior-dorsally to elongate and narrow the germ layers to establish the anterior–posterior body axis [5].
Focal adhesion kinase (FAK) is a non-receptor tyrosine kinase and is central to the regulation of cell movements and cell–ECM adhesions [6,7]. It is autophosphorylated upon activation by integrin, growth factor stimuli and/or G-protein-coupled signalling [8]. The phosphorylated FAK binds to activated Src to phosphorylate additional tyrosine residues on FAK and then recruits other proteins to modulate distinct signal transduction pathways involved in regulating multiple cellular functions such as cell adhesion, spreading and migration via cytoskeletal reorganization [9–11].
FAK is evolutionarily conserved in mammals and lower eukaryotic organisms [12]. It is highly expressed during embryogenesis in zebrafish [13], African clawed frog [14], chicken [15] and mouse [16]. FAK has a vital role in embryogenesis [17]. FAK-null mice die at embryonic day 8.5 with defects in the axial mesoderm and cardiovascular system [18,19]. These abnormalities are similar to those of fibronectin- and integrin-knockout mice that may be due to a disorganized cytoskeleton [20], impaired cellular migration and adhesion [21], or cessation of mesodermal cell proliferation during embryogenesis [22]. FAK is critical for epiboly, cell polarity and intercalation during embryogenesis in Xenopus laevis [23–25]. Other cell signalling pathways such as Wnt signalling are also involved in gastrulation [26]. How those different signals are coordinated during gastrulation remains unclear.
The non-canonical Wnt pathway, which mediates planar cell polarity (PCP) via Frizzled or the tyrosine kinase (Ryk)-related receptor, is a permissive cue for cell migration during development [27,28]. Non-canonical Wnt, wnt11 and wnt5b mutants are defective in cell migration during gastrulation in zebrafish [29,30]. Knockdown of wnt5a expression reduces focal adhesion dynamics by affecting FAK phosphorylation in cellular assays [31]. However, zebrafish wnt5a messenger RNA (mRNA) gradually decreases within 4 h post-fertilization (hpf). By contrast, another isoform of wnt5, wnt5b, is highly expressed at the margin of the epiblast during epiboly when fak is also expressed [32,33]. This implies a possible interaction between Fak and Wnt5b during gastrulation.
Two FAK paralogous genes, fak1a and fak1b, are identified in the zebrafish genome [34]. A comparative study showed that the fak1b locus is a duplicate of fak1a locus and both of them share syntenies with the site of the human FAK locus. High conservation of many important protein domains and 69% identity through the peptide sequence indicates partially overlapping functions of fak1a and fak1b [34]. Zebrafish Fak1a and Fak1b are highly similar to mammalian FAK (electronic supplementary material, figure S1). Using antisense morpholino (MO) oligonucleotides, we observed Fak1a MO caused severe gastrulation phenotypes than that of fak1b MO in zebrafish embryos. Primary amino acid sequence and phylogenetic analyses also showed Fak1a rather than Fak1b is more related to human FAK (electronic supplementary material, figure S2); thus, here we primarily focus on the role of Fak1a and its interaction with Wnt5b during gastrulation.
In this study, we show that the loss of Fak1a impairs gastrulation cell movements via regulation of actin dynamics in zebrafish. Fak1a was found to collaborate with Wnt5b in controlling Rac1 and Cdc42 activities to mediate gastrulation cell movements. We generated several fak1a zebrafish mutant alleles; however, those alleles only exhibited mild gastrulation defects. Interestingly, a subthreshold level of the wnt5b MO could induce a more severe gastrulation phenotype in the fak1a mutants. This suggests Wnt5b may compensate the loss of Fak1a in the mutants.
2. Material and methods
2.1. Cell culture and transfection
293T and FAK-null mouse embryonic fibroblast (FAK−/−) cells were maintained in a 5% CO2 incubator at 37°C in Dulbecco's modified Eagle's medium (DMEM) (Hyclone Laboratories, Logan, UT, USA) containing 10% fetal bovine serum (FBS) or 10% calf serum (Hyclone Laboratories), respectively. All cells were transfected with the desired reagent using Lipofectamine 2000™ (Invitrogen Life Technology, Carlsbad, CA, USA) according to the manufacturer's instructions.
2.2. Zebrafish fak cloning and expression vector construction
Coding sequences (CDSs) of fak1a and fak1b were amplified from total zebrafish complementary (c)DNAs by a reverse transcription–polymerase chain reaction (RT–PCR). Total RNAs of zebrafish were isolated by Trizol (Invitrogen) and reverse-transcribed using MMLV reverse transcriptase (Promega, Madison, WI, USA). Primers were designed according to reference RNA sequences (NM_131796.1 and NM_198819.1). The PCR was carried out at 95°C for 5 min followed by amplification at 95°C for 30 s; 58°C for 30 s; and 72°C for 30 s for 30 cycles with the proper primer set (electronic supplementary material, table S1). PCR products were cloned into the pGEM-T vector (Promega), sequenced and analysed. The correct fak1a CDS was subcloned into pEGFP, pKH3 or pCS2+ vectors for the overexpression experiments.
2.3. Immunofluorescence cell staining
Cells grown on a sterile cover glass were fixed in 4% paraformaldehyde (PFA) for 15 min. The cover glass was thoroughly washed with phosphate-buffered saline (PBS), blocked with 10% FBS and 0.3% Triton X-100, and then incubated overnight at 4°C with different primary antibodies against FAK, human influenza hemagglutinin (HA) and enhanced green fluorescent protein (EGFP; Santa Cruz Biotechnology, Santa Cruz, CA, USA). Samples were incubated with their corresponding secondary antibody and then stained by Hoechst 33258 dye (Sigma-Aldrich, St Louis, MO, USA) to reveal nuclei. Fluorescence signals were recorded with an epifluorescence microscope (Model IX71, Olympus, Japan) and analysed using Image-Pro Plus software (Media Cybernetics, Silver Spring, MD, USA).
2.4. 5-bromodeoxyuridine (BrdU) incorporation assays
Cells were serum-starved for 24 h in DMEM with 0.5% FBS to arrest them in G0 phase and then incubated for 24 h in DMEM containing 10% serum and 150 µM BrdU (Sigma). Cells were then washed with PBS, fixed in 4% PFA, permeabilized with 0.3% Triton X-100, digested with DNase I (New England Biolabs, Ipswich, MA, USA), blocked with 10% FBS, and processed for immunofluorescent staining with anti-BrdU (1 : 200, Sigma) and anti-GFP (1 : 200) antibodies, as described previously [35]. Cells counted in multiple fields were scored for BrdU-positive cells in three independent experiments.
2.5. Cell migration assay
Cell migration was measured in a 48-well chemotaxis Boyden chamber using 8 μm polyvinyl pyrrolidone-free polycarbonate membranes as described previously [18]. The membrane was placed over the bottom chamber, and cells were loaded in the upper well of a chamber. After 6 h, the membrane was stained with crystal violet. Finally, the number of stained cells was calculated from five randomly selected fields of each well under a microscope at 20× magnification.
2.6. Cell transplantation
For transplantation preparation, donor embryos were injected with 1% rhodamine dextran and 5 ng of standard control MO (StdMO) or fak1a tMO1, respectively. Cells from donor embryos were transplanted into untreated embryos and fak1a morphants separately at sphere stage as described previously [36]. Transplanted cells were further monitored and recorded by using a Leica DM5000 B microscope with a charge-coupled device (CCD) camera.
2.7. Immunoblotting
Cells were lysed in RIPA lysis buffer, and the protein concentration was determined by the Bradford assay (Bio-Rad, Hercules, CA, USA). Whole-cell lysates were mixed with an equal amount of 4× sodium dodecylsulfate (SDS) sample buffer, boiled and subjected to SDS–polyacrylamide gel electrophoresis (PAGE). Proteins were subsequently transferred onto a polyvinylidene difluoride membrane (Amersham, Buckinghamshire, UK) and subjected to immunostaining against designated antibodies. Antibodies against FAK (C-20) and actin were purchased from Santa Cruz Biotechnology. The α-pY397-FAK, α-pY861-FAK, α-pY576/577-FAK, paxillin and α-pY118-paxillin antibodies were from BD Transduction Laboratories (Palo Alto, CA, USA). The polyclonal α-extracellular signal-regulated kinase (ERK)1/2, α-pERK (pT202/pY204), α-p38 MAPK, α-phospho-p38 MAPK (Thr-180/Tyr-182), α-AKT and α-pS473-AKT antibodies were purchased from Cell Signaling (Danvers, MA, USA). The α-phosphate tyrosine (pY20, clone 4G10; Millipore, Bedford, MA, USA) and α-S732 phosphorylated FAK (Sigma) antibodies were also used in this study. Stained protein bands were detected using a Western-Light ECL kit (PerkinElmer, Waltham, MA, USA).
2.8. Zebrafish maintenance and embryo culture
AB zebrafish were maintained at 28.5°C on a 14 h light/10 h dark cycle. Embryos collected from natural mating were maintained and staged according to Kimmel et al. [37] as hours post-fertilization.
2.9. Microinjection
Reagents were diluted with Danieau's buffer and phenol red to desired concentrations. All reagents were injected at the 1-cell stage unless otherwise stated. Embryos were immobilized on a 1% agar plate, and an injection pipette was forced into the area adjacent to the blastomeres. A solution of the desired volume was injected using a Nanoliter injector (World Precision Instrument, Sarasota, FL, USA).
2.10. Rhodamine-phalloidin staining and confocal imaging analysis
Fixed embryos were washed with PBS, blocked with 10% FBS, treated with 0.3% Triton X-100 in PBS and then incubated with rhodamine-phalloidin (Invitrogen) overnight at 4°C. After washing with PBS, nuclei were labelled with 4′,6-diamidino-2-phenylindole (DAPI, Sigma) and mounted. Fluorescence signals were recorded with the Zeiss LSM780 Confocal Microscope Imaging System (Carl Zeiss, Jena, Germany). The z-stack analysed a total of 132 µm thickness with a 1.5 µm interval.
2.11. Whole-mount in situ hybridization
Embryos were fixed with fresh 4% paraformaldehyde (PFA) overnight and manually dechorionated. WISH was performed using DIG-labelled, SP6-RNA polymerase-made riboprobes according to a previous study [38]. Stained embryos were mounted in cellulose and observed under a stereomicroscope system (Mz75, Leica Microsystems). Photographs were taken using a digital camera (Coolpix 995, Nikon, Melville, NY, USA).
2.12. Measurement of degrees in convergence and extension
Convergent extension during gastrulation was assessed by measuring changes in the angles formed by respective expression patterns of marker genes [39,40]. Briefly, WISH against cathepsin L 1b (ctsl1b) and distal-less homeobox 3 (dlx3) were used to label prechordal plate and ectoderm borders, respectively, which formed a V-shaped pattern. We measured the angle of the V-shape to estimate the level of convergence. We also used WISH against ctsl1b and no tail (ntl) to mark the prechordal plate and presumptive notochord, respectively, to evaluate the dorsal axis extension in the bud stage. We enclosed each embryo within a rectangle, with the crossing of two diagonals being set to the exact middle of an embryo. A line was drawn from the anterior front of the prechordal plate to the centre of the embryo and then its centre was connected to the posterior ends of the tail bud. The angle towards the dorsal side was measured to estimate the length of the dorsal body axis, which was an indication of dorsal extension.
2.13. Time-lapse DIC imaging and analysis
Dechorionated embryos were mounted with 1% low-melting-point agar, and cell migration in the prechordal site and lateral site were recorded by the DIC system with the Leica DM5000B system under a 63× water immersion objective during gastrulation. The migration process was recorded at 10 s intervals for 10 min and analysed with Simple PCI Imagine System software (Compix, Sewickley, PA, USA) to track migration characteristics (migrating rate, velocity, cell protrusion numbers, tortuosity and direction of cell migration).
2.14. RacI and Cdc42 activation assay
The levels of activated RacI and Cdc42 were determined using the RacI and Cdc42 G-LISA Activation Assay kit (Cytoskeleton, Denver, CO, USA) according to the manufacturer's instructions. Embryos were cultured to the bud stage and dechorionated by proteinase. In total, 60 embryos were collected in a 1.5 ml pre-chilled tube and lysis buffer added. Embryos were homogenized using a 24-gauge needle, briefly centrifuged at 10 000g for 1 min, and then immediately immersed in liquid nitrogen. Protein lysates were applied to G-LISA plates using a RacI and Cdc42-specific antibody for detecting the captured active small G-protein according to the manufacturer's directions to determine the absorbance at 490 mm.
2.15. Generation of CRISPR/Cas9-mediated fak1a knockout fish
Three fak1a guiding (g)RNAs (see sequences in electronic supplementary material, table S2) were designed using the software on the CHOPCHOP website (https://chopchop.rc.fas.harvard.edu/). The gRNA template was synthesized according to a previous study [41], including annealing with two oligos and filled-in single-stranded DNA overhangs with T4 DNA polymerase (New England Biolabs, Ipswich, MA, USA). Double-stranded DNA was used as a template to synthesize gRNA by in vitro transcription using the MEGAscript T7 Transcription Kit (Ambion, Naugatuck, CT, USA). A zebrafish codon-optimized Cas9 pCS2+ plasmid (a kind gift from Dr Alex Schier, Harvard University) was linearized and in vitro-transcribed with the mMESSAGE mMACHINE SP6 kit. Cas9 mRNA (150 pg) and gRNA (50 pg) were co-injected into 1-cell-stage embryos and raised to adulthood as the F0 generation. F0 fish were crossed with wild-type (WT) fish to generate heterozygous F1 fish. F1 fish were genotyped. Briefly, tail fins were clipped and incubated in lysis buffer (0.4 mg ml−1 proteinase K in TE buffer) at 55°C for 2 h. Samples were inactivated at 85°C for 15 min and then purified to serve as PCR templates. DNA fragments with potential mutations were amplified by a PCR using the primer set, Fak1a E10 F/R (see sequences at electronic supplementary material, table S1), cloned by TA cloning and subjected to Sanger sequencing to identify potential mutant alleles. Heterozygous F1 fish with identical alleles were incrossed to generate F2 fish. At least four batches of offspring embryos from different founders were then raised to adulthood and further analysed by a PCR using the Fak1a E10 F/R primer pairs following by Hae III digestion. Stable F2 fish were maintained for breeding. F3 homozygous embryos were used for phenotypic observations and molecular analysis.
2.16. Hae III mutagenesis assay and sequencing
The genomic DNA from adult tail fins or embryos was extracted by TE buffer with 0.2 mg ml−1 proteinase K, incubated at 55°C for 2 h, and inactivated at 85°C for 10 min. A 513 bp DNA fragment was amplified by a PCR using primers as shown in electronic supplementary material, table S1. PCR products were cleaned using a PCR clean-up kit (Qiagen, Hilden, Germany) and digested with Hae III (New England Biolabs, Ipswich, MA, USA) for 2 h at 37°C. Digested products were examined by electrophoresis in a 1% agarose gel.
2.17. Statistical analysis
All datasets are presented as the mean ± s.e.m. Results were further analysed by a one-way analysis of variance and post-tested using Tukey's multiple-comparison tests or Student's t-test.
3. Results
3.1. Zebrafish Fak1a is a functional conserved homologue of human FAK
FAK is a critical factor for cell proliferation, motility and migration [42–45]. To determine whether zebrafish Fak has conserved properties, we subcloned zebrafish fak1a and its dominant-negative form, frnk1a (see the FAK domain structure in electronic supplementary material, figure S3) into a human influenza hemagglutinin (HA)-tagged pKH3 or a pEGFP-C3 vector. We successfully overexpressed them independently in 293T cells as shown by western blotting against HA or GFP (figure 1a) and found that fak1a and frnk1a were co-localized with paxillin in focal contacts (figure 1b). Cell proliferation was significantly enhanced in fak1a-overexpressing cells, but not in frnk1a-overexpressing or control pEGFP-transfected cells (figure 1c; p < 0.001). Similarly, cell transmigration activity was higher in fak1a-overexpressing cells (figure 1d; p < 0.001). These results suggest that zebrafish Fak1a is functionally conserved compared to other FAK orthologues.
Figure 1.

Zebrafish Fak1a is functionally conserved with mammalian FAKs. (a) Zebrafish Fak1a and Frnk1a were successfully expressed in 293T cells as characterized by immunoblotting (IB) using anti-HA (left) and anti-green fluorescent protein (GFP) antibodies (right). (b) Zebrafish Fak1a and Frnk1a with an HA tag were expressed in FAK−/− MEF cells as revealed by HA immunostaining shown in green (left column). They were present in focal contacts (boxed), and an enlarged image is shown at the top right corner of the respective panel. Focal contacts and cell nuclei were visualized by Paxillin (second column) and DAPI staining (third column), respectively. Merged images for Fak, Paxillin and DAPI staining are presented in the right column with enlarged insets for the boxed regions to better show the co-localization of Fak and paxillin in focal contacts. Cells were transfected with pEGFP-C3 vector only, fak1a or frnk1a to examine cell proliferation (c) and cell migration (d) as determined by a BrdU incorporation assay and Bodyen chamber migration assay, respectively (n = 3; ***p < 0.001). Detailed protocols are described in ‘Material and methods'.
To examine whether key phosphorylation sites are conserved in zebrafish Fak1a, the HA-tagged fak1a and frnk1a were overexpressed in FAK−/− cells, immunoprecipitated and immunoblotted. As expected, we found that Fak1a, but not Frnk1a, was autophosphorylated at Y397 (electronic supplementary material, figure S4A). The phosphorylation of Fak1a, but not Frnk1a, was notably enhanced at Y397, Y576/577, S732 and Y861 as it was in chicken orthologues, thereby demonstrating that these sites are biochemically conserved on Fak1a (electronic supplementary material, figure S4B).
3.2. Fak1a and fak1b are maternally and ubiquitously expressed in zebrafish embryos
To determine the bona fide expression pattern of fak1a during zebrafish embryogenesis, fak1a mRNA was detected by whole-mount in situ hybridization (WISH) analysis. Results showed that fak1a mRNA was maternally expressed during the 1-cell stage and ubiquitously expressed through blastulation and gastrulation (electronic supplementary material, figure S5A). In addition, fak1a mRNA and protein were detected by RT–PCR (electronic supplementary material, figure S5B) or immunoblotting (electronic supplementary material, figure S5C), respectively. We observed that fak1a mRNA and protein were constantly expressed in embryos from 30% epiboly to 17-somite stages. Furthermore, we also examined the expression patterns of another fak isoform, fak1b. fak1b was constantly expressed from 1-cell stage to 5 days post-fertilization by RT–PCR analysis (electronic supplementary material, figure S6A). Spatially, like fak1a, it was ubiquitously expressed during early embryogenesis and localized to the anterior head region at later development by WISH analysis (electronic supplementary material, figure S6B).
3.3. Loss of Fak1a causes gastrulation defects
To assess the developmental role of Fak1a, we microinjected 1-cell-stage zebrafish embryos with or without an antisense translation blocking MO (tMO1) targeting fak1a. The Fak1a protein was significantly reduced to approximately 30% in fak1a tMO1-injected embryos compared to untreated ones (figure 2b). MO-injected embryos are called morphants hereafter. In fak1a morphants, embryos displayed a cylinder-like shape compared to the normal ball-like form. The progression of epiboly in these morphants was notably slower during gastrulation. The progression of epiboly was either delayed and eventually reached 100% epiboly (epiboly delay), or arrested. The movements of the deep cell layer (DCL) and enveloping layer (EVL) were asynchronous (figure 2c). Overall, we found 47% and 18% of fak1a tMO1 morphants had delayed and arrested epiboly, respectively (figure 2d). Among the arrested embryos, 87% of them did not reach 100% epiboly at 16 hpf. This was not due to the toxicity of the MO, since no epiboly defect was observed in embryos injected with 10 ng of the N-25 control MO (electronic supplementary material, figure S7). To further test the specificity of the phenotype, fak1a mRNA lacking the target site of the fak1a tMO1 was prepared and injected with or without fak1a tMO1. Relatively lower percentages (approx. 30%) epiboly defective embryos were observed in embryos injected with 125 pg fak1a mRNA, but it significantly rescued the epiboly defect when co-injected with the fak1a tMO1 (figure 2c, left). The injection of fak1a mRNA at a higher dose (250 pg) further reduced the epiboly defects observed in fak1a morphants (electronic supplementary material, figure S7). The rescued embryos appeared mostly normal compared to control embryos (electronic supplementary material, figure S8). In addition, we also found dose-dependent epiboly defects in embryos injected with dominant-negative frnk1a mRNA (figure 2c, right). Furthermore, we investigated how the loss of fak1a affecting its downstream effectors and found that the levels of phosphorylation of paxillin, p38 mitogen-activated protein kinase (p38) and Akt were all reduced in fak1a morphants (figure 2d).
Figure 2.

Zebrafish fak1a morphants reveal severe gastrulation defects. (a) Zebrafish embryos were treated or untreated with a fak1a translation blocking morpholino (fak1a tMO1) and immunoblotted (IB) against Fak1a and β-actin (loading control). The intensities of Fak1a bands were normalized to that of β-actin. The relative knockdown levels of Fak1a in treated embryos are shown by comparing band intensity to that of untreated embryos (right panel, n = 3; **p < 0.01). (b) The epiboly progression of fak1a tMO1-treated embryos was either delayed (ii) or arrested (iii) compared to the normal standard control MO-injected embryos (i) at 10 hpf as presented in bright-field images. Black and red arrows point to the running fronts of the enveloping layer and deep cell layer, respectively. All images have the animal pole (A) placed at the top and the dorsal to the right (D). (c) Embryos were treated as indicated and classified into different categories as indicated, and percentages of embryos in each category are shown (n = 3, **p < 0.01; ***p < 0.001). The total number of embryos used in each treatment is shown at the bottom of each bar. (d) Proteins of embryos injected with or without 2.5/5 ng fak1a tMO1 were extracted and immunoblotted using indicated antibodies. β-Actin was used as a loading control.
To ensure the MO-induced epiboly defects are specific to the loss of Fak1a, we designed and tested a second translational blocking fak1a MO (tMO2), which does not overlap the tMO1 target site, and found the fak1a tMO2 also caused 70% delayed and 5% arrested epiboly (electronic supplementary material, figure S9A, B). Effects of the fak1a tMO2 were also dose-dependent and could be rescued by the co-injection of fak1a mRNA (electronic supplementary material, figure S9C). Lastly, the standard control MO (figure 2c) and a random control MO (N-25) (data not shown) were both tested at up to 10 ng per embryo with no notable effect on epiboly or gastrulation. Therefore, untreated embryos were used as controls hereafter unless otherwise specified. Furthermore, the fak1a tMO1 was relatively more effective, thus we used it for the rest of the experiments.
3.4. Loss of Fak1a causes reduction in cortical actin fibres and uneven distribution of YSL nuclei
Filamentous (F)-actin forms a ring-like structure at the leading edge of the EVL, where it links the EVL and the yolk cell to provide the pulling force for blastoderm during epiboly [46] and is pivotal for gastrulation [36,47]. Thus, we examined the organization of F-actin of 75%-epiboly-stage embryos by probing with rhodamine-phalloidin. In addition, we also counter-stained cell nuclei by 4′,6-diamidino-2-phenylindole (DAPI) and Fak1a by immunostaining. Immunostaining showed the ubiquitous presence of Fak1a in blastodisc and YSL in control embryos, but the Fak1a staining was dramatically reduced in fak1a tMO1 morphants (figure 3a). This further confirmed the efficacy of knockdown effect by the fak1a tMO1. The staining also clearly marked the EVL and DCL as indicated by arrows. In control embryos, the EVL and the DCL migrated coherently with a 92.8 ± 14.3 µm gap in between. By contrast, the gap was significantly increased to 243.6 ± 33.3 µm in fak1a tMO1 morphants (figure 3b). Only about 20% of embryos with a gap smaller than 100 µm that indicates epiboly was significantly disturbed in most tMO1 morphants (figure 3c, p < 0.001). Furthermore, by examining the region flanking the margin of the EVL at a higher magnification, we found that F-actin fibres were not tightly distributed in fak1a tMO1 morphants compared to control embryos. Rough and uneven blastoderm margins were observed in fak1a morphants. This suggests that the loose actin network may lead to un-synchronized movements of the EVL and DCL in fak1a tMO1 morphants.
Figure 3.

Loss of Fak1a perturbs the synchronized migration of enveloping and deep cell layers and the F-actin network. (a) Embryos untreated or injected with 5 ng of a fak1a translation blocking morpholino (tMO1) were fixed at 8 hpf and subjected to F-actin/DAPI staining and Fak1a immunohistochemistry. Embryos were examined and photographed for the whole embryo image (upper) or a region flanking the yolk syncytial at a higher magnification (lower) under confocal microscopy. Representative photographs of different channels and merged images are shown. White arrowheads point to actin rings. Yellow and green arrowheads point to the running fronts of the enveloping (EVL) and deep cell layers (DCL), respectively. (b) Graphic demonstration of the average gap between EVL and DCL in untreated and fak1a tMO1-treated embryos (n = 3; n = 30, **p < 0.01). (c) The EVL/DCL gap smaller than 100 µm were considered normal, and the percentages of normal embryos are presented (n = 3; n = 30, ***p < 0.001). (d) The actin bundles (marked by white asterisks) between the actin ring and vegetal actin cap were clearly reduced in fak1a morphants, and the numbers of actin bundles are quantified in the right panel (n = 3; n = 10, ***p < 0.001). Disorganized YSL nuclei (yellow asterisks) were also observed in fak1a morphants (see DAPI staining and merged images). As indicated by the arrows in the top right corner, all images have the animal pole (a) placed at the top and the dorsal to the right (d).
To reveal the formation of the junction between the blastoderm and actin cap, we further examined the structure of F-actin in 60%-epiboly-stage embryos. YSL nuclei were evenly scattered at the EVL margin in untreated embryos, but unevenly distributed in fak1a morphants (figure 3d, blue nuclei labelled by yellow asterisks). Uneven blastoderm margin and distribution of F-actin were also found in fak1a tMO1 morphants. We also observed previously reported actin-based structures, called actin bundles, in the vegetal cortex of the yolk cell that connect the vegetal cortex with the external yolk syncytial nuclei (eYSN) in a vegetal-to-animal direction (indicated by asterisks in figure 3d; Li et al. [48]). A significant loss of actin bundles along with a loose connection of the actin ring to the cap was seen in fak1a morphants. These data indicate that Fak1a is critical to the arrangement of cortical actin during epiboly.
3.5. Loss of Fak1a causes convergence and extension defect
We further analysed whether the loss of Fak1a causes convergent extension defects in the bud-stage embryos by WISH analysis. cathepsin L 1b (ctsl1b) and distal-less homeobox 3 (dlx3) were used to label the prechordal plate and ectoderm borders, respectively. Staining gave rise to a V-shaped pattern as shown in figure 4a (left column), and the angle of the V-shape was measured to estimate the level of convergence in all embryos. The average angles of convergence were dose-dependently increased from 77.8° in untreated to 104° in 0–5 ng fak1a tMO1-injected embryos (figure 4b, left panel). The dose-dependent convergence defect was also observed in tMO2 morphants (electronic supplementary material, figure S9D).
Figure 4.

Loss of Fak1a causes abnormal convergence and extension movements. (a) Embryos injected with a designated amount of a fak1a translation blocking morpholino (tMO1) were subjected to WISH against indicated genes at the bud stage. Representative WISH staining photographs against ctsl1b/dlx3 or ctsl1b/ntl are presented for untreated and fak1a tMO1-treated embryos (fak1a tMO1). ctsl1b, dix3 and ntl staining were used to label the prechordal plate (pcp), ectodermal borders (ecb) and notochord (nt)/tail bud (tb), respectively. For simplicity, tissues are labelled in untreated embryos only. To reveal dorsal convergence, embryos were probed with ctsl1b/dlx3 as shown in the anterior view (left). A round prechordal plate is in the middle with two ectodermal borders forming a V-shape. Lines were drawn along the ectodermal borders that matched the prechordal plates. The V-shape formed an angle as indicated by A° and A′° in untreated and fak1a tMO1-treated embryos, respectively. To reveal the dorsal extension, embryos were probed with ctsl1b/ntl as shown in the lateral view with the dorsal to the right (right). Lines were drawn from the anterior front of the prechordal plate and the posterior end of the tail bud to the centre of the embryo forming an angle towards the dorsal as indicated by B° and B′° in untreated and fak1a tMO1-treated embryos, respectively. (b) The relative convergence and extension defects were quantified by calculating the ratios of A′°/A° (left panel) and B′°/B° (middle panel), respectively. The normality of anterolateral migration of the prechordal plate was examined by signals of ctsl1b and dlx3 in embryos injected with a designated amount of the fak1a tMO1 (right panel). n = 3, *p < 0.05, **p < 0.01, ***p < 0.001, n.s., not significant. (c) Embryos were injected with different amounts of the fak1a tMO1, cultured to the 8-somite stage, photographed (live embryo) or fixed, and subjected to WISH against ctsl1b/myo D. Representative dorsal view photographs are shown in (c), and statistical comparisons of embryos with normal somites are presented in (d). As described in (c,d), the anterior and posterior extensions of the dorsal axes were examined. Representative lateral-view photographs with the anterior to the left are shown in (e), and statistical comparisons of embryos with normal dorsal axis extension are presented in (f).
To evaluate the dorsal axis extension, we used WISH against ctsl1b and no tail (ntl) to mark the prechordal plate and presumptive notochord, respectively. We drew a line from the anterior front of the prechordal plate to the centre of an embryo (see the determination of centre in Material and Methods), and then connected it to the posterior end of the tail bud (figure 4a, right column). The angle towards the dorsal was used to estimate the length of the dorsal body axis, which reflects the degree of dorsal extension. The average angles of extension were 239.2°–182.4° in 0–5 ng fak1a tMO1-injected embryos. fak1a tMO1 morphants showed significantly reduced angles compared to those in control embryos, implying an inhibition of extension (figure 4b, middle graph; p < 0.01). A similar defect in extension was also observed in tMO2 morphants (electronic supplementary material, figure S9D).
In control embryos, individual ctsl1b-expressing cells consolidated and coordinately moved anterior to the frontal edge of the neural plate (expressing dlx3) as the tissue advanced beyond the animal pole. In fak1a morphants, the ctsl1b-expressing cells failed to form a consolidated group and abnormally dispersed anteriorly–posteriorly (figure 4a, right column). Mesendodermal cells did not acquire the coordinated crescent shape anterior to the neural plate by the tail bud stage and exhibited a more diffused dlx3 expression. These phenomena illustrate that Fak1a is required for anterior movement and consolidation of the polster along with the simultaneous convergence and extension of posterior tissues.
We also observed an expanded somite width and a shortened body axis in fak1a morphants at the 6-somite stage. The tail rudiment of fak1a morphants was either less extended or stalled at the vegetal pole (figure 4c,e, left). These phenotypes are typical defects of convergence and extension, so we fixed both untreated embryos and fak1a morphants for WISH against myogenic differentiation 1 (myod) and ctsl1b to reveal somites and the prechordal plate, respectively (figure 4c,e, right column). The percentage of embryos with a normal somite width and body axis dose-dependently decreased in fak1a morphants (figure 4d,f). This further confirms the deteriorating effect on the convergent extension in the absence of fak1a.
3.6. No synergy exists between fak1a and fak1b in regulating gastrulation
To examine the role of another zebrafish Fak, Fak1b, during gastrulation, we applied two MOs, fak1b tMO1 and fak1b tMO2 in zebrafish embryos. In general, both fak1b MOs caused dose-dependent epiboly delay and arrest. The inhibition of fak1b tMO2 was much weaker compared to that of fak1b tMO1 (electronic supplementary material, figure S10A,B). In addition, both fak1b MOs resulted in significant convergent extension defects (electronic supplementary material, figure S10C,D).
To investigate the synergy of Fak1a and Fak1b during gastrulation, we co-injected fak1a tMO1 and fak1b tMO1 at two different subthreshold dosages into embryos. The injections of both MOs at 1.25 ng and 2.5 ng only showed additive defects during gastrulation (electronic supplementary material, figure S11). These results suggested no synergy existed between fak1a and fak1b in regulating gastrulation.
3.7. Loss of Fak1a impedes the migration of hypoblast cells during gastrulation
fak1a MO-induced gastrulation defects were plausibly caused by disturbance of cell migration. To examine cell migration in vivo, we performed a time-lapse mobility assay on the running fronts of involuting prechordal plate cells (electronic supplementary material, movies S1 and S2) and convergent lateral cells (electronic supplementary material, movies S3 and S4) during the 75–90% epiboly stage. Cell migration of prechordal plate cells and lateral cells were both inhibited in fak1a morphants (fak1a tMO1) compared to those in random control MO N-25-injected embryos. We recorded and quantified the migration rate, migration velocity, protrusion number and direction of tracked cells using Simple PCI software (figure 5a). To plot the trace of each migrating cell, the origin (o′) was defined as the location of a cell at the beginning of the recording. The anterior of the embryo (a′) or animal pole (a) is indicated by an arrow on the y-axis in each plot. The arrow of the x-axis is perpendicular to the anterior axis in the prechordal cell tracking plot or points to the dorsal side in the lateral cell tracking plot. Each arrow represents the migration route of one cell. The arrow points towards the direction of movement and the length of the arrow is the distance of cell migration (figure 5b). The direction of cell migration was determined by measuring the angle between the y-axis and each migrating trace (figure 5b). Quantitative data are shown in figure 5c. Cells migrated more unidirectionally at the mean converged angles of 14.7° and 44.7° in prechordal cells and lateral cells, respectively. By contrast, fak1a morphant cells displayed uncoordinated movements at the mean converged angles of 26.7° and 82.7° in prechordal cells and lateral cells, respectively. The migration velocity (the distance between the origin and the end of the trace (DOE) divided by time) of prechordal cells of fak1a morphants (0.28 µm s−1) was significantly slower than in control embryos (0.44 µm s−1). Similar results were also observed in the migration of lateral cells (fak1a morphants: 0.37 µm s−1, control embryos: 0.51 µm s−1; figure 5d, left; p < 0.01). A significant difference was also shown in the prechordal cell migration rate (length of the migrating trace (LMT) divided by time) in fak1a morphants (0.1 µm s−1) and controls (0.44 µm s−1; p < 0.001), but no effect was seen on lateral cells (figure 5d, middle left). Tortuosity (LMT/DOE) was not affected in prechordal cells but was reduced in lateral cells of fak1a morphants (morphants: 2.37, control embryos: 3.6) (figure 5d, middle right). These observations clearly demonstrate the inhibition of cell migration during gastrulation by fak1a tMO1.
Figure 5.

Loss of Fak1a perturbs hypoblast cell migration. Embryos were injected with 5 ng of a random control morpholino (MO) N-25 (control) or fak1a translation blocking MO (tMO1), immobilized and monitored under differential interference microscopy. Time-lapse movies were taken for 10 min during the 75–90% epiboly stage to reveal the involuting cell migration of the anterior prechordal plate or convergent movement of lateral cells (see electronic supplementary material, movies S1–S4). (a) Representative snapshots of the prechordal plate or lateral cells at the end of representative recordings are shown. More than six cells were selected from an embryo to be traced in each movie, and their migrating routes are depicted by a rainbow line representing the recording time at 0–10 min. a′, anterior; a, animal pole. These experiments were repeated at least three times. (b) The moving direction (arrow direction) and migration distance (arrow length) of each traced cell are represented by an arrow. The origin (o′) of the coordinate plane stands for the starting point of each cell. a′, anterior; a, animal pole; d, dorsal side. (c) The polarity of each cell was measured as described in Results, and the analysis showed a significant loss in the polarity of the prechordal and lateral cell migration in fak1a tMO1-treated embryos (n ≥ 3; n ≥ 36). (d) The migration velocity, migration rate, tortuosity (route/distance) and protrusion persistence of each recording were analysed with Simple PCI software, and comparisons between groups are shown. n.s., not significant, *p < 0.05; **p < 0.01, ***p < 0.001.
We further compared cell protrusions between control embryos and fak1a morphants and found that the average numbers of newly generated protrusions of fak1a morphants were significantly lower than those of control embryos in both cell groups (figure 5d, right; prechordal cells: morphant (6.26), control (8.67), p < 0.05; lateral cells: morphant (5.7), control (8.89), p < 0.01). These data suggest that Fak1a is required for proper cell protrusions to drive effective cell movements during gastrulation.
3.8. FAK1a autonomously mediates cell protrusions, but non-cell autonomously regulates the directions of cell movement during gastrulation
To assess cell-autonomy of Fak1a function in mediating migration of lateral hypoblast cells, we performed cell transplantation experiments by injecting rhodamine dextran into donor embryos as a cell tracer. Rhodamine-labelled fluorescent blastomeres from StdMO or fak1a morphants were transplanted to non-fluorescent host embryos treated without or with fak1a tMO1, examined under epifluorescence microscopy and recorded for 30 min. The extensions of cell body were designated as protrusions and the direction and numbers of these protrusions were measured at each cells. Under microscopy, cells from a StdMO morphant showed highly protrusive activities (4.1 ± 0.9 protrusions, n = 39) with well-formed protrusions when transplanted into an untreated host embryo (‘STD > UT’, arrow, figure 6a; electronic supplementary material, movie S5). Cell protrusions remained active in those cells transplanted to a fak1a morphant host (‘STD > MO’, arrows, figure 6b; electronic supplementary material, movie S6). Moreover, protrusions were active in cells from a fak1a morphant transplanted into an untreated host (‘MO > UT’, figure 6c; electronic supplementary material, movie S7) compared to a reduced number of protrusions in a fak1a morphant host (‘MO > MO’, figure 6d; electronic supplementary material, movie S8).
Figure 6.

Fak1a functions non-cell-autonomously to regulate cell migration during gastrulation. (a–d) Rhodamine-labelled blastomeres were transplanted from embryos injected with 5 ng of StdMO (Std) or tMO1 (MO) with rhodamine dextran to untreated hosts (UT) or tMO1 morphant hosts (MO). Host embryos were then imaged (animal pole on the top and vegetal pole at the bottom) under epifluorescence microscopy, recorded and representative snapshots are shown in (a) STD > UT: StdMO-treated cells in an untreated host. (b) STD > MO: StdMO-treated cells in a tMO1 morphant. (c) MO > UT: tMO1-treated cells in an untreated host. (d) MO > MO: tMO1-treated cells in a tMO1 morphant. Arrows indicate the representative cellular protrusions in each embryo. (e) The average protrusion numbers per embryo were counted from each recording and shown. The total number of embryos used for each treatment is shown on the bottom of each bar. Values between groups with a significant difference (p < 0.05) are denoted by different letters. (f) The transplanted cells were traced and their curvillinear velocity (Vcl) and strait line velocity (Vcl) were calculated and shown. Values between groups with a significant difference (p < 0.05) are denoted by different letters. (g) The distribution of protrusions formed from donor cells transplanted to host is shown. The centre of a cell is regarded as the centroid of the rose diagram. A rose diagram is divided into eight equally parts with designated angles. The 0°, 90° and 180° points to the animal pore, dorsal side and vegetal pore, respectively. The percentages of protrusion per cell were calculated and plotted on rose diagrams. The effective protrusions were marked in red and the ineffective ones are marked in dark. Y-axis for the rose diagrams represents the percentage of protrusions in each direction bin. (h) The percentage of effective protrusions per cell in each group were shown (n = 3, *p < 0.05).
To quantify the protrusion activity, we examined how many protrusions were formed in 30 min in five randomly selected cells for each embryo examined. The STD > UT group had 4.1 ± 0.9 protrusions (n = 39) and the STD > MO group had 4.8 ± 0.5 protrusions (n = 28); the MO > UT group had 4.5 ± 0.0 (n = 22) and the MO–MO group had 2.8 ± 0.3 (n = 54). Only the MO > MO treatment showed significant less protrusion numbers compared to the other treatments (p < 0.05) (figure 6e). The STD > UT cells travelled faster and longer than those STD > MO cells (figure 6f). The curvilinear velocity (Vcl, curvilinear distance/time) of STD > UT cells was 0.038 ± 0.004 μm s−1 (n = 59), but was only 0.025 ± 0.003 µm s−1 (n = 48) for the STD > MO cells (p < 0.05). The MO > UT cells travelled with a faster speed and a longer distance in Vcl (0.034 ± 0.005 µm s−1, n = 55) compared to those MO > MO cells (0.024 ± 0.002 µm s−1, n = 77). Moreover, the STD > UT and MO > UT cells migrated straighter as shown by a higher straight-line velocity (Vsl, straight-line distance/time, figure 6f), which were 0.020 ± 0.002 µm s−1 (n = 59) and 0.010 ± 0.002 µm s−1 (n = 48), respectively. By contrast, STD > MO (n = 55) and MO > MO (n = 77) cells migrated less linearly with a Vsl of 0.0178 ± 0.002 µm s−1 and 0.010 ± 0.001 µm s−1, respectively, compared to cells in the UT hosts. It appeared that zebrafish Fak1a mediates gastrulation cell migration non-cell autonomously. However, it was puzzling that the number of protrusions formed in the STD > MO cells was not different from that of STD > UT cells (figure 6e). We reasoned that the directionality of protrusion might be different between groups. To determine the directionality of protrusions, the centre of a cell was considered as to be the centroid of the rose diagram. A rose diagram was divided into eight equal pies with designated angles. The 0°, 90° and 180° referred to animal pore, dorsal side and vegetal pore, respectively. The percentage of protrusions for all cells fell into each pie was plotted on a rose diagram (figure 6g). Under the STD > UT condition, the majority (75%) of cells protruded towards the expected dorsal side and vegetable pole (DV, in red, between 45° and 180°), which we considered them as ‘effective protrusion’, with less than 25% protrusions extended towards the opposite direction (in black, between 0° and 225°), which were non-effective protrusions. The average percentages of effective protrusion were as following: STD > UT (74.6%), STD > MO (45.7%), MO > UT (61.5%) and MO > MO (55.8%) (figure 6g). We further analysed the percentages of effective protrusion per cell. Similarly, transplanted cells from either StdMO or fak1a morphants tended to have higher percentages of effective protrusions in untreated hosts than that of fak1a morphants hosts (figure 6h). These data clearly demonstrated that the directionality of protrusion was notably affected in the fak1a morphant but not in the untreated hosts. Thus, it suggests that zebrafish FAK1a mediates the direction of gastrulation cell migration in a non-cell-autonomous manner.
3.9. No synergy between Wnt5b and Fak1a signalling during gastrulation
Zebrafish wnt5b/pipetail (ppt) mutants exhibit similar convergence and extension defects [29,49] as that observed in fak1a morphants. The knockdown of wnt5a expression reduced focal adhesion dynamics by affecting FAK phosphorylation in cellular assays [50]. We suspected that Fak1a may interact with the Wnt5b-mediated signalling pathway during gastrulation. Hence, we tested whether fak1a overexpression can rescue the convergence and extension defects of ppt mutants. About 25% of embryos from a standard cross of heterozygous ppt mutants showed convergence and extension defects with a shortened body length and a spade tail compared to normal larvae at 48 hpf (figure 7a). The phenotypes in ppt mutants injected with fak1a mRNA were reduced to 2% (figure 7b, left; p < 0.001). Rescued ppt mutants had significantly longer trunks (averaging 1.55 mm; p < 0.001) than uninjected siblings (1.33 mm), while WT embryos had an average trunk length of 1.63 mm (figure 7b, right; p < 0.001). Homozygous Wnt mutants are embryonic lethal and the use of heterozygous mutants only produce a quarter of homozygous mutant embryos which cannot be identified until the appearance of phenotypes that is not practical for intensive analyses. Thus, we knocked down wnt5b by a specific MO, which had been shown to induce gastrulation defects independent of p53 (electronic supplementary material, figure S12) [51]. We observed approximately 75% of embryos had epiboly arrest and delay phenotypes, which were not observed in ppt mutants and presumably due to the presence of maternal Wnt5b and the co-injection of fak1a mRNA significantly rescued epiboly defects in wnt5b morphants (figure 7c). The higher penetrance of wnt5b MO-induced phenotypes allowed us to further examine the interaction of FAK and Wnt5b during gastrulation. The co-injection of fak1a mRNA significantly rescued the epiboly defects in wnt5b morphants (figure 7c). To test the synergistic effect between Wnt5b and Fak1a, we co-injected subthreshold dosages of wnt5b and fak1a MOs, but found no synergistic increase in convergent extension defects (electronic supplementary material, figure S13). This suggests that Wnt5b and Fak1a might not operate through the same genetic pathway to mediate convergent extension.
Figure 7.

Overexpression of fak1a rescues gastrulation defects in wnt5b-deficient embryos. (a) Wild-type or wnt5b/ppt mutant embryos were untreated or injected with fak1a mRNA, cultured until 48 h post-fertilization (hpf), and photographed. The percentages of embryos with dead, pipetail or normal phenotypes were calculated and shown (right). The total number of embryos used for each treatment is shown at the bottom of each bar. (b) The average trunk lengths among the three groups were compared (n = 3, **p < 0.01, ***p < 0.001). (c) Embryos were injected with 3.75 ng wnt5b morpholino (MO) without (control) or with 200 pg fak1a mRNA and photographed at 10 hpf. wnt5b MO-injected embryos showed different degrees of epiboly defects, which was rescued by a fak1a mRNA co-injection. Representative photographs are shown at the top and quantitative analysis shown at the bottom. (d) Embryos were injected with designated MOs, cultured to the bud stage, lysed and subjected to a qPCR to determine fak1a or wnt5b expression. (e) Embryos were injected with a designated amount of the wnt5b MO, collected at the bud stage and subjected to immunoblotting against indicated antibodies specific to focal adhesion kinase (FA) (C-20) and different FAK phosphorylation sites. β-actin served as an internal control.
To further elucidate the plausible interaction between Wnt5b and Fak1a, we examined wnt5b and fak1a expressions in embryos injected with the fak1a or wnt5b MO. At the mRNA level, fak1a expression was significantly reduced in wnt5b morphants. By contrast, wnt5b expression was increased in fak1a morphants (figure 7d). Both immunoblotting (figure 7e) and IHC analyses (electronic supplementary material, figure S14) showed downregulation of the Fak1a protein in wnt5b morphants. Unfortunately, we were unable to examine the protein level of Wnt5b due to the lack of a specific antibody.
Furthermore, both fak1a and wnt5b mRNAs could reciprocally rescue the convergence defects of their respective morphants (figure 8) and wnt5b mRNA could partially rescue epiboly arrest of fak1a morphants (electronic supplementary material, figure S15). wnt5b morphants showed no significant extension defect at the dosage tested (7.5 ng MO per embryo). By contrast, fak1a morphants had extension defects, but they could not be rescued by co-injecting wnt5b mRNA.
Figure 8.

Fak1a and Wnt5b reciprocally rescue convergence defects in wnt5b and fak1a MO-injected embryos, respectively. (a,b) Embryos were untreated, injected with 7.5 ng of the wnt5b MO only or co-injected with both 7.5 ng of the wnt5b MO and 200 pg of fak1a mRNA. (c,d) Embryos were untreated, injected with 5 ng of the fak1a tMO1 only, or co-injected with both 5 ng of the fak1a tMO1 and 10 pg of wnt5b mRNA. Embryos were then cultured to the bud stage and subjected to WISH against ctsl1b, dlx3 and ntl to analyse convergence and extension as described in figure 4. Representative photographs are shown in (a) and (c), and quantitative analyses are shown in (b) and (d) (n = 3, **p < 0.01, ***p < 0.001).
Collectively, the lack of synergy between Fak1a and Wnt5b suggests that they might not work via the same genetic pathway. However, the cross-rescue effect between them implies that they might converge at downstream factors to mediate gastrulation.
3.10. Wnt5b integrates Fak1a to mediate gastrulation via modulating Rac1 and Cdc42
Both FAK and Wnt signalling pathways are well known for their roles in cytoskeleton regulation. RhoA, Cdc42 and Rac1 are key mediators for actin dynamics during gastrulation in zebrafish [39,52–55]. Thus, we hypothesized that Wnt5b and Fak1a signalling may converge to modulate small GTPase activities during gastrulation. Due to the possible antagonism between RhoA and Rac1 in coordinating F-actin organization [49,50], here we only tested whether rac1 or cdc42 mRNA could rescue wnt5b and fak1a morphant phenotypes. rac1 and cdc42 independently rescued both fak1a and wnt5b morphant phenotypes at certain dosages (electronic supplementary material, figure S16). Co-injection of 2.5 pg per embryo rac1 or cdc42 mRNA restored the percentage of normal embryos to about 30% and 45% in fak morphants, respectively (electronic supplementary material, figure S16B,D). Similarly, co-injection of 10 pg rac1 or 2.5 pg cdc42 mRNA per embryo also increased the percentage of normal embryos to about 40% and 55% in wnt5b morphants, respectively (electronic supplementary material, figure S16A,C). However, the rescue was not complete nor dose-dependent. It indicated that a good balance of different small GTPase activities may be necessary for gastrulation. Therefore, we injected subthreshold levels of rac1 and cdc42 mRNA to examine a possible synergistic rescue effect in both fak1a and wnt5b morphants. The injection of at 1.25 pg rac1 or cdc42 mRNA by themselves had minimum effects on gastrulation in WT embryos (electronic supplementary material, figure S16E) and had limited rescue effects in fak1a or wnt5b morphants. However, we observed synergistic rescue with the combination of rac1 and cdc42 to restore the percentage of normal embryos of wnt5b morphants from 22 to about 50%, which was notably higher than those of rac1-injected (35%) or cdc42-injected (38%) embryos (figure 9a; see a group photo in electronic supplementary material, figure S17A). An even more significant synergistic rescue was observed in fak1a morphants, from 7 to 45% of normal embryos in double rescue compared to 11 and 14% in embryos co-injected with rac1 or cdc42 mRNA only (figure 9b; see a group photo in electronic supplementary material, figure S17A). To better understand whether expression or activity level is perturbed in fak1a and wnt5b morphants, we performed qPCR and activity assays on both morphants. The expression level of cdc42 was significantly reduced in wnt5b morphants but not in fak1a morphants. However, expression levels of rac1 were reduced in both fak1a and wnt5b morphants (figure 9c). We next measured the activities of Cdc42 and Rac1 in fak1a and wnt5b morphants by detecting the GTP-bound form of small GTPase. The Cdc42 activity was significantly lower in both fak1a and wnt5b morphants. By contrast, although Rac1 activity was also lower in both fak1a and wnt5b morphants, the reduction in wnt5b morphants was not significant (figure 9d). Collectively, these results suggested that both Cdc42 and Rac1 act downstream of Wnt5b and Fak1a during gastrulation. Lastly, we tested whether rac1 and cdc42 mRNA could rescue the loss of F-actin bundles, and found that the co-injection of rac1 and cdc42 mRNA significantly restored the number of actin bundles in fak1a morphants (figure 9e).
Figure 9.

Wnt5b and Fak1a modulate Rac1 and Cdc42 to control cell migration during gastrulation. (a,b) Embryos were untreated or injected with 7.5 ng of the wnt5b MO, 5 ng of fak1a or 1.25 pg of rac1 and cdc42 mRNA. Embryos were cultured to the bud stage and classified into normal, mild/severe convergent extension (mild/severe C/E) defects, and epiboly arrest categories. The percentages of embryos in different categories are shown. Numbers of embryos observed are given at the bottom of each bar. n = 3. Values between groups with a significant difference (p < 0.05) are denoted by different letters. (c) Embryos injected with the wnt5b or fak1a MO were collected at the bud stage to measure the expression of cdc42 or rac1 by a qPCR, respectively. Ef1α served as an internal control. (d) Embryos were treated as in (c) and lysed to measure the activities of Cdc42 and Rac1 by an ELISA activity assay (n = 3, *p < 0.05). (e) Embryos were treated with fak1a MO with or without rac1 and cdc42 mRNA, stained and examined as described in figure 3d. The actin bundles between the actin ring and cap are indicated by asterisks. The numbers of actin bundles in each treatment were presented in the right bar graph (n = 3, *p < 0.05, ***p < 0.001).
3.11. CRISPR/Cas9-mediated fak1a knockout causes a compensatory rise in wnt5b expression
To examine the function of fak1a in vivo, we generated fak1a mutants by a clustering of regularly interspaced short palindromic repeats (CRISPR)/Cas9-mediated technique [56]. We designed two gRNAs targeting exon 3 and one gRNA targeting exon 10 of fak1a (see sequences in electronic supplementary material, table S2). Genotyping analysis revealed that the one targeting exon 10 (fak1a E10-1) successfully caused the insertion or deletion (indels) in F0 embryos (figure 10a). We obtained seven deletion and four insertion mutant alleles as shown in electronic supplementary material, table S3. Among F2 mutant alleles, we validated a 5 bp deletion mutant allele, fak1a Δ5, by Sanger sequencing (figure 10b). The fak1a Δ5 mutant allele has an early stop codon just before the PAM site. The sense strand of the fak1a Δ5 allele is shown in figure 10a (lower strand). The translated sequence of fak1a Δ5 allele encodes a truncated protein of 274 amino acids without a kinase domain, a p130CAS (CAS)-binding site, a CRAF-binding site or a focal adhesion-targeting (FAT) domain (figure 10c).
Figure 10.

CRISPR/Cas9-mediated deletion of Fak1a results in mild gastrulation defects due to compensatory wnt5b expression. (a) The fak1a gene structure is shown with indicated exons in blue boxes. The target sites of a primer pair (F, forward primer; R, reverse primer) for amplifying a mutation detection 513-bp PCR fragment are indicated by arrows. The sense strand of wild-type fak1a is shown (upper strand). Exon 10 contains a PAM site shown in red. A gRNA target site of the exon 10 PAM site is labelled in blue. The Hae III site is shown in orange. The resulting sense strand of the fak1a Δ5 allele is shown (lower strand) with the translated amino acid in grey. (b) Partial chromatograms are shown for the wild-type and fak1a Δ5 alleles. Deleted nucleotides are indicated by asterisks. (c) Illustration of wild-type FAK1a and Fak1a Δ5 mutant proteins. The gRNA target site is indicated by an arrow. The mutant protein contains F1, F2 and a partial F3 domain that encodes 274 amino acids. (d) Hae III restriction digestion analysis. Genomic DNAs from tail fins of wild-type (+/+), heterozygous (+/−) or homozygous (−/−) fak1a were isolated and amplified by PCR using the fak1a forward and reverse primers indicated in A. The amplicons were digested, run in agarose gels and stained. A representative gel image is shown indicating selective molecular weight markers and sources of genomic DNAs. (e) Three different batches of wild-type and fak1a Δ5 mutant embryos were lysed and subjected to immunoblotting against a Fak c-terminal antibody. 293T cell lysate was used as a positive control, and zebrafish Rpl7a was an internal control. (f) Embryos were subjected to WISH against ctsl1b/dlx3 and ctsl1b/ntl to analyse convergence and extension as described in figure 4. In the scatterplot, each dot represents relative convergence, and the extension defect of each embryo underwent different treatments (n = 4). (g) Wild-type embryos and fak1a Δ5 MZ mutant embryos were injected with or without a designated subthreshold amount of the wnt5b MO, cultured to the bud stage, and the resultant gastrulation defects were classified into normal, mild convergence and extension (C/E) defects, severe C/E defects and epiboly arrest as shown in representative photographs (side view, dorsal up, anterior to the left). The calculated percentages of embryos are shown for each class. The numbers of embryos observed are given at the bottom of each bar. n = 3. Values between groups with a significant difference (p < 0.05) are denoted by different letters.
A 5 bp deletion of the fak1a Δ5 allele results in the deletion of an Hae III restriction site, -GGCC-, that allowed us to separate fish with different fak1a genomic backgrounds (WT, heterozygous and homozygous) with an Hae III restriction digestion assay as indicated in figure 10a. In WT embryos (+/+), the 513 bp band (asterisk) was cleaved by Hae III into two bands of 321 and 193 bp (arrows). In heterozygous mutants (+/−), weaker 321 and 193 bp bands were present due to digestion by Hae III, and the 513 bp band remained intact because of the loss of the Hae III site in the mutated strands. In clear contrast, homozygous mutant (−/−) alleles showed only the uncut 513 bp band due to the lack of an Hae III site (figure 10d). fak1a Δ5 F2 homozygous mutants were then identified and incrossed to produce maternal zygotic (MZ) mutants, which contained a null allele as evidenced by the absence of Fak1a protein by immunoblotting (figure 10e).
Unexpectedly, only a portion (25%) of these embryos showed mild gastrulation defects at the bud stage but eventually grew normally at later stages (electronic supplementary material, figure S18). Similar results could be seen with two other mutant alleles, fak1a Δ5b and fak1a Δ7 (electronic supplementary material, figure S18A). fak1a Δ5 mutant embryos tended to have divergent and larger convergent angles but shorter extension angles compared to WT embryos. fak1a tMO1 morphants appeared to have larger convergent and shorter extension angles compared to fak1a Δ5 mutant embryos. However, the effects of fak1a tMO1 were alleviated when injected into fak1a Δ5 mutant embryos (figure 10f). These results suggest that fak1a Δ5 mutant embryos have notably reduced sensitivity to the fak1a tMO1. It further demonstrates the specificity of the fak1a MO. Moreover, the injection of cas9 mRNA and fak1a gRNA into F0 embryos also resulted in gastrulation defects in about 50% of embryos, which could be rescued by co-injecting fak1a mRNA (electronic supplementary material, figure S19). Together, these data suggest that gastrulation defects observed in different contexts are all due to the specific loss of fak1a.
The lack of severe gastrulation defects observed in fak1a mutants might have resulted from gene complementation and/or compensation. One of the possible candidate genes, which might exert a complementation effect on fak1a, is its close relative, fak1b [34]. Because of the possibility that the expression of fak1b might complement the loss of Fak1a for gastrulation cell movements, we injected the fak1b MO into fak1a Δ5 mutant embryos but observed no further deterioration of gastrulation defects compared to WT embryos injected with the fak1b MO (electronic supplementary material, figure S20). We further examined changes in the gene expression of fak1b in WT embryos, morphants and mutants and found no significant change until 9 hpf, in which fak1b expression increased in both fak1a tMO1 morphants and fak1a Δ5 mutants (electronic supplementary material, figure S21A). This suggests that the increase in fak1b expression might not explain the phenotypic difference observed between fak1a morphants and mutants.
Lastly, we injected a subthreshold dosage of the wnt5b MO at 1.875 ng, which by itself caused mild gastrulation defects in a small percentage of WT embryos, into fak1a Δ5 mutants and found a significant increase in the severe convergent extension defect and even epiboly arrest. The defects were only slightly higher when injected with 3.75 ng of the wnt5b MO (figure 10g). This indicates that an increase in wnt5b expression might occur to compensate for the loss of fak1a in fak1a Δ5 mutants.
4. Discussion
Despite its necessity, how FAK functions during early embryogenesis remains poorly understood. Here, we demonstrate that zebrafish Fak1a is chemically conserved with mammalian FAK and functions cooperatively with Wnt5b to regulate Rac1 and Cdc42 activities for the modulation of actin dynamics during gastrulation cell movements.
Embryos devoid of Fak1a showed abnormal epibolic movement and convergent extension. It is known that the YSL is crucial for the initiation and process of epiboly in teleosts [57,58]. By coordinating through microtubule arrays, the YSL pulls the tightly associated EVL towards the vegetal pore during epiboly [59]. In addition, actin dynamics are critical for epibolic movement. A punctuate actin band within the YSL also contributes to the progression of epiboly [46,60]. The activation of FAK can trigger F-actin remodelling and repositioning during cell migration [61]. Here, we observed that the F-actin network is severely distorted in fak1a morphants by an abnormal, uneven distribution of yolk syncytial nuclei and epiboly defects. By contrast, we found no notable differences in the perinuclear microtubule network or longitudinal microtubule arrays within the yolk syncytial layer between control embryos and fak1a morphants (see electronic supplementary material, figure S22). This further suggests an essential role of Fak1a in mediating actin dynamics, organization and YSL behaviour for gastrulation cell movements.
The deep cells of fak1a morphants showed significant retarded cell migration and reduced numbers of protrusion that have also been reported in mammalian cells [8,62]. These abnormalities might be due to the disturbance of FAK downstream signalling. One of the FAK downstream signalling molecules is mitogen-activated protein kinase (MAPK). Zebrafish defective in p38 or its downstream effector, MAPK-activated protein kinase 2 (MAPKAPK2), also have a disorganized F-actin network and epiboly defects [63]. Biochemically, we provide evidence to show that the reduced phosphorylation of p38, paxillin and Akt occurs in fak1a morphants, which are all pivotal factors controlling cell mobility and migration [39,64]. Collectively, Fak1a signalling is mechanistically conserved in mediating gastrulation cell migration in zebrafish.
Our MO-based loss-of-function assay clearly demonstrated the necessity of fak1a for gastrulation cell movements. However, only mild gastrulation defects were observed in fak1a MZ mutants. This suggests that possible secondary effects might occur in fak1a morphants. We performed the necessary MO-specificity control experiments, including using two MOs targeting non-overlapping sites, RNA rescue and co-injection of a p53 MO (data not shown), and all data supported the specific activity of the fak1a MO. A partial gastrulation defect was seen by overexpressing the dominant-negative frnk. In addition, cas9 mRNA and fak1a gRNA induced gastrulation defects, which were also partially rescued by fak1a mRNA. The injection of fak1a mRNA also caused mild gastrulation defects. Furthermore, the convergent extension defects induced by the fak1a tMO1 were notably mild in fak1a mutant embryos compared to WT embryos, further strengthening the specificity of tMO1-induced gastrulation defects. These results support that perturbation of fak1a indeed interferes with gastrulation.
The lack of a phenotype is often observed in chemical-induced zebrafish mutants [65]. Gene compensation reported in CRISPR/Cas9-induced mutants suggests it may be a common feature in zebrafish gene knockouts [66–69]. By contrast, genetic compensation does not occur in morphants, so the corresponding phenotypes can be observed. If one only trusts the phenotypes observed in genetic mutants, the important and valid phenotypes seen in the MO-based experiments may be overlooked. To settle this issue, guidelines for the use of MO in zebrafish were reported in PLoS Genetics [70] authored by a group of leading zebrafish experts. Our work exactly followed the guidelines to observe the lack of response for tMO1 in a fak1a null MZ mutant and the identification of the compensatory factor Wnt5b. We found that the injection of wnt5b MO at a subthreshold level recapitulated gastrulation defects in fak1a Δ5 mutants, suggesting that a compensatory increase in wnt5b may mask gastrulation phenotypes in fak1a Δ5 mutants. This further supports a possible integration of Fak1a and Wnt5b signalling; however, we cannot exclude the involvement of other compensatory genes. A large-scale transcriptomic analysis would be required to unravel the causative gene(s).
The non-canonical Wnt5b pathway is known to modulate cell movements during embryogenesis [29,31]. Wnt5b may mediate the binding of Dishevelled and adenomatous polyposis coli (APC) to focal contacts to activate FAK at the leading edge of cells during migration [31,71]. We observed that fak1a mRNA rescued the wnt5b morphant phenotype and the expression, protein level and phosphorylation of C-terminal tyrosine were all downregulated in wnt5b morphants, suggesting that Wnt5b may act upstream of Fak1a. Interestingly, we also discovered that wnt5b expression increased in fak1a morphants, suggesting that the loss of fak1a might induce the compensatory expression of wnt5b to replenish reduced downstream signalling. However, no synergistic effect on gastrulation was observed in fak1a and wnt5b double-knockdown morphants, revealing that Fak1a and Wnt5b may not work via the same signalling pathway as previously described. Instead, Wnt5b and Fak1a might act in parallel and converging at a common downstream signalling pathway, such as small GTPases.
The small GTPases Rac1 and Cdc42 are known downstream effectors of both FAK and Wnt5 signalling [72–75]. Wnt5b is involved in non-canonical PCP and the Wnt/calcium pathway. An activated receptor recruits dishevelled and forms a complex with Daam1. The complex then binds with Rac1 to regulate actin dynamics. Wnt5b also regulates calcium release from the endoplasmic reticulum, and the increased intracellular calcium and diacylglycerol can activate Cdc42 through protein kinase C [76]. On the other hand, FAK can directly bind to p130cas to coordinate the activation of RAC1 [77]. FAK can also influence the functions of Cdc42 through the binding and phosphorylation of the Cdc42 effector Wiskott–Aldrich syndrome protein, N-WASP [78]. wnt5b is expressed at the margin of the EVL [79], and fak1a is ubiquitously expressed in the early embryo stage. It is possible that Wnt5b may integrate with the FAK signal to mediate the actin cytoskeleton and promote cell migration in a co-localized region. We discovered lower expression levels and activities of Rac1 and Cdc42 in both wnt5b and fak1a morphants, suggesting that they may thus relay signals from both FAK and Wnt5b to modulate actin dynamics during gastrulation. This was evidenced by the synergistic rescue of both fak1a and wnt5b morphants by Rac1 and Cdc42. Herein, we demonstrate for the first time the missing functional link between Wnt and FAK signalling to mediate gastrulation cell movements (epiboly and convergence) via the precise regulation of Rac1 and Cdc42 activities and subsequent actin dynamics.
The convergence of Wnt and FAK signalling suggests that they may collaborate to regulate the same cellular processes such as convergence and extension during gastrulation. Convergence and extension were once thought to be bundled processes driven by cellular intercalation [4]. Analysis of different gastrulation mutants later revealed that convergence and extension can be linked or separately regulated. Convergence and extension are both affected in knypek/glypican6 [80] and trilobite/strabismus [81,82] mutants. By contrast, convergence and extension is inhibited in bmp [83] and has2 [84] mutants, respectively. Convergence relies on the active cell migration of individual or groups of cells without cell rearrangement, while extension depends on cell intercalation [84]. Our data support this notion by showing that FAK affected both convergence and extension, while Wnt5b influenced only convergence. This further strengthens the idea that Wnt5b only affects cell migration, while Fak1a affects both migration and intercalation, despite their regulation of common GTPase targets.
We propose a working model to show the interaction of Wnt5b and Fak1a during gastrulation (figure 11). Conventionally, Wnt5b works via Dishevelled/Daam1 or calcium (not shown) to activate Rac1/Cdc42 and subsequent actin-dependent cell migration during gastrulation. Here, we further demonstrate that Wnt5b can work in parallel with Fak1a or activate Fak1a signalling to modulate Rac/Cadc42 and downstream signalling. During gastrulation, convergence is mainly regulated by Fak1a-mediated cell migration. On the other hand, extension, which requires cell intercalation, is mediated by Wnt5b and Fak1a signalling. In the Fak1a mutants, the inhibition of gastrulation should occur like that of fak1a morphants because of the reduction in Rac1 and Cdc42 activities. However, only a mild gastrulation defect was observed in mutants due to compensatory increases in wnt5b expression and presumably elevated Rac1 and Cdc42 activities via a Fak1a-independent conventional pathway. Overall, we provide strong evidence to support that Wnt integrates with FAK to fine-tune Rac1 and Cdc42 activities for the differential regulation of convergence extension during gastrulation.
Figure 11.
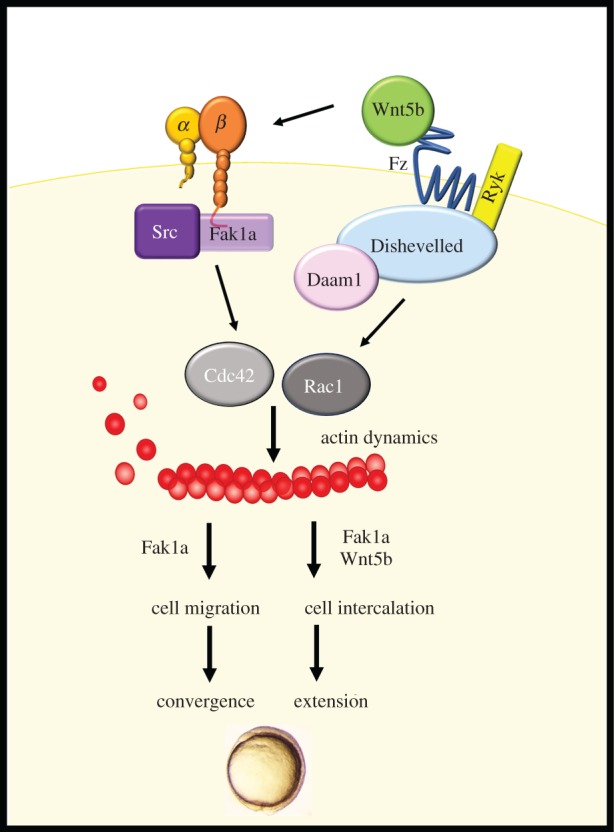
Wnt5b integrates with Fak1a to mediate cell movements during gastrulation. Gastrulation cell migration is controlled by the Wnt5b pathway to activate calcium and Dsh/Daam1. Herein, we identified that Wnt5b can also integrate with FAK signalling, and both Wnt5b and Fak1a then activate small GTPase Rac1 and Cdc42 to mediate actin dynamics during gastrulation. Convergent is mainly mediated by Fak1a-mediated cell migration and extension is exerted by cell intercalation, which requires both Fak1a and Wnt5b.
Supplementary Material
Supplementary Material
Supplementary Material
Supplementary Material
Supplementary Material
Supplementary Material
Supplementary Material
Supplementary Material
Supplementary Material
Acknowledgements
We thank Taiwan Zebrafish core facility for providing technical guidance and plasmids. We thank Ms Yi-Chun Chuang in Technology Commons in National Taiwan University for excellent technical assistance with confocal microscopy. The authors would also like to express great appreciation to the staffs of the zebrafish Core at National Taiwan University for providing assistance in fish maintenance. We also appreciate the generous supply of CRISPR-related plasmids and protocols from Alex Schier (Harvard University).
Ethics
All animal handling procedures were approved by the use of laboratory animal committee at National Taiwan University, Taipei, Taiwan (IACUC Approval ID: 97 Animal Use document No. 55).
Data accessibility
This article has no additional data.
Authors' contributions
All authors except Y.-L.T. conceived and designed the experiments. I.-C.H., T.-M.C., J.-P.L. and Y.-L.T performed experiments and analysed data. I.-C.H., T.-M.C., J.-P.L., T.-L.S and S.-J.L. wrote the manuscript. T.-L.S. and S.-J.L. directed the project. All authors read and edited the manuscript.
Competing interests
We declare we have no competing interests.
Funding
This work was supported by the Ministry of Science and Technology, Taiwan (grant no. NSC-98-2311-B-002-006-MY3 to S.-J.L. and grant nos NSC-96-2311-B-002-023-MY3 and NSC-99-2320-B-002-079-MY3 to T.-L.S.) and National Taiwan University (grant nos NTU CESRP-10R70602A5 and NTU ERP-10R80600 to S.-J.L and Frontier and Long-Term Research Grant no. 10R70821 to T.-L.S.).
References
- 1.Solnica-Krezel L. 2005. Conserved patterns of cell movements during vertebrate gastrulation. Curr. Biol. 15, R213–R228. ( 10.1016/j.cub.2005.03.016) [DOI] [PubMed] [Google Scholar]
- 2.Solnica-Krezel L, Cooper MS. 2002. Cellular and genetic mechanisms of convergence and extension. Results Probl. Cell Differ. 40, 136–165. ( 10.1007/978-3-540-46041-1_8) [DOI] [PubMed] [Google Scholar]
- 3.Heisenberg CP, Tada M. 2002. Zebrafish gastrulation movements: bridging cell and developmental biology. Semin. Cell Dev. Biol. 13, 471–479. ( 10.1016/S1084952102001003) [DOI] [PubMed] [Google Scholar]
- 4.Warga RM, Kimmel CB. 1990. Cell movements during epiboly and gastrulation in zebrafish. Development 108, 569–580. [DOI] [PubMed] [Google Scholar]
- 5.Roszko I, Sawada A, Solnica-Krezel L. 2009. Regulation of convergence and extension movements during vertebrate gastrulation by the Wnt/PCP pathway. Semin. Cell Dev. Biol. 20, 986–997. ( 10.1016/j.semcdb.2009.09.004) [DOI] [PMC free article] [PubMed] [Google Scholar]
- 6.Mitra SK, Schlaepfer DD. 2006. Integrin-regulated FAK-Src signaling in normal and cancer cells. Curr. Opin. Cell Biol. 18, 516–523. ( 10.1016/j.ceb.2006.08.011) [DOI] [PubMed] [Google Scholar]
- 7.Schaller MD, Borgman CA, Cobb BS, Vines RR, Reynolds AB, Parsons JT. 1992. pp125FAK a structurally distinctive protein-tyrosine kinase associated with focal adhesions. Proc. Natl Acad. Sci. USA 89, 5192–5196. ( 10.1073/pnas.89.11.5192) [DOI] [PMC free article] [PubMed] [Google Scholar]
- 8.Mitra SK, Hanson DA, Schlaepfer DD. 2005. Focal adhesion kinase: in command and control of cell motility. Nat. Rev. Mol. Cell Biol. 6, 56–68. ( 10.1038/nrm1549) [DOI] [PubMed] [Google Scholar]
- 9.Frame MC, Patel H, Serrels B, Lietha D, Eck MJ. 2010. The FERM domain: organizing the structure and function of FAK. Nat. Rev. Mol. Cell Biol. 11, 802–814. ( 10.1038/nrm2996) [DOI] [PubMed] [Google Scholar]
- 10.Ridley AJ, Schwartz MA, Burridge K, Firtel RA, Ginsberg MH, Borisy G, Parsons JT, Horwitz AR. 2003. Cell migration: integrating signals from front to back. Science 302, 1704–1709. ( 10.1126/science.1092053) [DOI] [PubMed] [Google Scholar]
- 11.Schlaepfer DD, Mitra SK. 2004. Multiple connections link FAK to cell motility and invasion. Curr. Opin. Genet. Dev. 14, 92–101. ( 10.1016/j.gde.2003.12.002) [DOI] [PubMed] [Google Scholar]
- 12.Fox GL, Rebay I, Hynes RO. 1999. Expression of DFak56, a Drosophila homolog of vertebrate focal adhesion kinase, supports a role in cell migration in vivo. Proc. Natl Acad. Sci. USA 96, 14 978–14 983. ( 10.1073/pnas.96.26.14978) [DOI] [PMC free article] [PubMed] [Google Scholar]
- 13.Henry CA, Crawford BD, Yan YL, Postlethwait J, Cooper MS, Hille MB. 2001. Roles for zebrafish focal adhesion kinase in notochord and somite morphogenesis. Dev. Biol. 240, 474–487. ( 10.1006/dbio.2001.0467) [DOI] [PubMed] [Google Scholar]
- 14.Baker LP, Daggett DF, Peng HB. 1994. Concentration of pp125 focal adhesion kinase (FAK) at the myotendinous junction. J. Cell Sci. 107, 1485–1497. [DOI] [PubMed] [Google Scholar]
- 15.Ridyard MS, Sanders EJ. 2001. Inhibition of focal adhesion kinase expression correlates with changes in the cytoskeleton but not apoptosis in primary cultures of chick embryo cells. Cell Biol. Int. 25, 215–226. ( 10.1006/cbir.2000.0634) [DOI] [PubMed] [Google Scholar]
- 16.Shiokawa S, Yoshimura Y, Nagamatsu S, Sawa H, Hanashi H, Sakai K, Noguchi K, Nakamura Y. 1998. Functional role of focal adhesion kinase in the process of implantation. Mol. Hum. Reprod. 4, 907–914. ( 10.1093/molehr/4.9.907) [DOI] [PubMed] [Google Scholar]
- 17.Chatzizacharias NA, Kouraklis GP, Theocharis SE. 2010. The role of focal adhesion kinase in early development. Histol. Histopathol. 25, 1039–1055. [DOI] [PubMed] [Google Scholar]
- 18.Shen TL, Park AY, Alcaraz A, Peng X, Jang I, Koni P, Flavell RA, Gu H, Guan JL. 2005. Conditional knockout of focal adhesion kinase in endothelial cells reveals its role in angiogenesis and vascular development in late embryogenesis. J. Cell Biol. 169, 941–952. ( 10.1083/jcb.200411155) [DOI] [PMC free article] [PubMed] [Google Scholar]
- 19.Ilic D, et al. 1995. Reduced cell motility and enhanced focal adhesion contact formation in cells from FAK-deficient mice. Nature 377, 539–544. ( 10.1038/377539a0) [DOI] [PubMed] [Google Scholar]
- 20.Furuta Y, Ilic D, Kanazawa S, Takeda N, Yamamoto T, Aizawa S. 1995. Mesodermal defect in late phase of gastrulation by a targeted mutation of focal adhesion kinase, FAK. Oncogene 11, 1989–1995. [PubMed] [Google Scholar]
- 21.Webb DJ, Donais K, Whitmore LA, Thomas SM, Turner CE, Parsons JT, Horwitz AF. 2004. FAK-Src signalling through paxillin, ERK and MLCK regulates adhesion disassembly. Nat. Cell Biol. 6, 154–161. ( 10.1038/ncb1094) [DOI] [PubMed] [Google Scholar]
- 22.Lim ST, et al. 2008. Nuclear FAK promotes cell proliferation and survival through FERM-enhanced p53 degradation. Mol. Cell. 29, 9–22. ( 10.1016/j.molcel.2007.11.031) [DOI] [PMC free article] [PubMed] [Google Scholar]
- 23.Petridou NI, Stylianou P, Christodoulou N, Rhoads D, Guan JL, Skourides PA. 2012. Activation of endogenous FAK via expression of its amino terminal domain in Xenopus embryos. PLoS ONE 7, e42577 ( 10.1371/journal.pone.0042577) [DOI] [PMC free article] [PubMed] [Google Scholar]
- 24.Bjerke MA, Dzamba BJ, Wang C, DeSimone DW. 2014. FAK is required for tension-dependent organization of collective cell movements in Xenopus mesendoderm. Dev. Biol. 394, 340–356. ( 10.1016/j.ydbio.2014.07.023) [DOI] [PMC free article] [PubMed] [Google Scholar]
- 25.Petridou NI, Stylianou P, Skourides PA. 2013. A dominant-negative provides new insights into FAK regulation and function in early embryonic morphogenesis. Development 140, 4266–4276. ( 10.1242/dev.096073) [DOI] [PubMed] [Google Scholar]
- 26.Heisenberg CP, Solnica-Krezel L. 2008. Back and forth between cell fate specification and movement during vertebrate gastrulation. Curr. Opin. Genet. Dev. 18, 311–316. ( 10.1016/j.gde.2008.07.011) [DOI] [PMC free article] [PubMed] [Google Scholar]
- 27.Bowerman B. 2008. Cell signaling. Wnt moves beyond the canon. Science 320, 327–328. ( 10.1126/science.1157590) [DOI] [PMC free article] [PubMed] [Google Scholar]
- 28.Yang Y, Mlodzik M. 2015. Wnt-Frizzled/planar cell polarity signaling: cellular orientation by facing the wind (Wnt). Annu. Rev. Cell. Dev. Biol. 31, 623–646. ( 10.1146/annurev-cellbio-100814-125315) [DOI] [PMC free article] [PubMed] [Google Scholar]
- 29.Kilian B, Mansukoski H, Barbosa FC, Ulrich F, Tada M, Heisenberg CP. 2003. The role of Ppt/Wnt5 in regulating cell shape and movement during zebrafish gastrulation. Mech. Dev. 120, 467–476. ( 10.1016/S0925-4773(03)00004-2) [DOI] [PubMed] [Google Scholar]
- 30.Ulrich F, et al. 2003. Slb/Wnt11 controls hypoblast cell migration and morphogenesis at the onset of zebrafish gastrulation. Development 130, 5375–5384. ( 10.1242/dev.00758) [DOI] [PMC free article] [PubMed] [Google Scholar]
- 31.Matsumoto S, Fumoto K, Okamoto T, Kaibuchi K, Kikuchi A. 2010. Binding of APC and dishevelled mediates Wnt5a-regulated focal adhesion dynamics in migrating cells. EMBO J. 29, 1192–1204. ( 10.1038/emboj.2010.26) [DOI] [PMC free article] [PubMed] [Google Scholar]
- 32.Lu FI, Thisse C, Thisse B. 2011. Identification and mechanism of regulation of the zebrafish dorsal determinant. Proc. Natl Acad. Sci. USA 108, 15 876–15 880. ( 10.1073/pnas.1106801108) [DOI] [PMC free article] [PubMed] [Google Scholar]
- 33.Pei W, Feldman B. 2009. Identification of common and unique modifiers of zebrafish midline bifurcation and cyclopia. Dev. Biol. 326, 201–211. ( 10.1016/j.ydbio.2008.11.008) [DOI] [PMC free article] [PubMed] [Google Scholar]
- 34.Crawford BD, Henry CA, Clason TA, Becker AL, Hille MB. 2003. Activity and distribution of paxillin, focal adhesion kinase, and cadherin indicate cooperative roles during zebrafish morphogenesis. Mol. Biol. Cell 14, 3065–3081. ( 10.1091/mbc.e02-08-0537) [DOI] [PMC free article] [PubMed] [Google Scholar]
- 35.Lai IR, Chu PY, Lin HS, Liou JY, Jan YJ, Lee JC, Shen TL. 2010. Phosphorylation of focal adhesion kinase at Tyr397 in gastric carcinomas and its clinical significance. Am. J. Pathol. 177, 1629–1637. ( 10.2353/ajpath.2010.100172) [DOI] [PMC free article] [PubMed] [Google Scholar]
- 36.Lai SL, Chan TH, Lin MJ, Huang WP, Lou SW, Lee SJ. 2008. Diaphanous-related formin 2 and profilin I are required for gastrulation cell movements. PLoS ONE 3, e3439 ( 10.1371/journal.pone.0003439) [DOI] [PMC free article] [PubMed] [Google Scholar]
- 37.Kimmel CB, Ballard WW, Kimmel SR, Ullmann B, Schilling TF. 1995. Stages of embryonic-development of the zebrafish. Dev. Dynam. 203, 253–310. ( 10.1002/aja.1002030302) [DOI] [PubMed] [Google Scholar]
- 38.Thisse C, Thisse B, Schilling TF, Postlethwait JH. 1993. Structure of the zebrafish snail1 gene and its expression in wild-type, spadetail and no tail mutant embryos. Development 119, 1203–1215. [DOI] [PubMed] [Google Scholar]
- 39.Yeh CM, Liu YC, Chang CJ, Lai SL, Hsiao CD, Lee SJ. 2011. Ptenb mediates gastrulation cell movements via Cdc42/AKT1 in zebrafish. PLoS ONE 6, e18702 ( 10.1371/journal.pone.0018702) [DOI] [PMC free article] [PubMed] [Google Scholar]
- 40.Lin CW, Yen ST, Chang HT, Chen SJ, Lai SL, Liu YC, Chan TH, Liao WL, Lee SJ. 2010. Loss of cofilin 1 disturbs actin dynamics, adhesion between enveloping and deep cell layers and cell movements during gastrulation in zebrafish. PLoS ONE 5, e15331 ( 10.1371/journal.pone.0015331) [DOI] [PMC free article] [PubMed] [Google Scholar]
- 41.Reyon D, Tsai SQ, Khayter C, Foden JA, Sander JD, Joung JK. 2012. FLASH assembly of TALENs for high-throughput genome editing. Nat. Biotechnol. 30, 460–465. ( 10.1038/nbt.2170) [DOI] [PMC free article] [PubMed] [Google Scholar]
- 42.Cary LA, Han DC, Polte TR, Hanks SK, Guan JL. 1998. Identification of p130Cas as a mediator of focal adhesion kinase-promoted cell migration. J. Cell Biol. 140, 211–221. ( 10.1083/jcb.140.1.211) [DOI] [PMC free article] [PubMed] [Google Scholar]
- 43.Richardson A, Parsons T. 1996. A mechanism for regulation of the adhesion-associated proteintyrosine kinase pp125FAK. Nature 380, 538–540. ( 10.1038/380538a0) [DOI] [PubMed] [Google Scholar]
- 44.Zhao J, Bian ZC, Yee K, Chen BP, Chien S, Guan JL. 2003. Identification of transcription factor KLF8 as a downstream target of focal adhesion kinase in its regulation of cyclin D1 and cell cycle progression. Mol. Cell. 11, 1503–1515. ( 10.1016/S1097-2765(03)00179-5) [DOI] [PubMed] [Google Scholar]
- 45.Zhao JH, Reiske H, Guan JL. 1998. Regulation of the cell cycle by focal adhesion kinase. J. Cell Biol. 143, 1997–2008. ( 10.1083/jcb.143.7.1997) [DOI] [PMC free article] [PubMed] [Google Scholar]
- 46.Carvalho L, Heisenberg CP. 2010. The yolk syncytial layer in early zebrafish development. Trends Cell Biol. 20, 586–592. ( 10.1016/j.tcb.2010.06.009) [DOI] [PubMed] [Google Scholar]
- 47.Koppen M, Fernandez BG, Carvalho L, Jacinto A, Heisenberg CP. 2006. Coordinated cell-shape changes control epithelial movement in zebrafish and Drosophila. Development 133, 2671–2681. ( 10.1242/dev.02439) [DOI] [PubMed] [Google Scholar]
- 48.Li YL, Shao M, Shi DL. 2017. Rac1 signalling coordinates epiboly movement by differential regulation of actin cytoskeleton in zebrafish. Biochem. Biophys. Res. Commun. 490, 1059–1065. [DOI] [PubMed] [Google Scholar]
- 49.Westfall TA, Brimeyer R, Twedt J, Gladon J, Olberding A, Furutani-Seiki M, Slusarski DC. 2003. Wnt-5/pipetail functions in vertebrate axis formation as a negative regulator of Wnt/beta-catenin activity. J. Cell Biol. 162, 889–898. ( 10.1083/jcb.200303107) [DOI] [PMC free article] [PubMed] [Google Scholar]
- 50.Doherty JT, Conlon FL, Mack CP, Taylor JM. 2010. Focal adhesion kinase is essential for cardiac looping and multichamber heart formation. Genesis 48, 492–504. ( 10.1002/dvg.20650) [DOI] [PMC free article] [PubMed] [Google Scholar]
- 51.Lele Z, Bakkers J, Hammerschmidt M. 2001. Morpholino phenocopies of the swirl, snailhouse, somitabun, minifin, silberblick, and pipetail mutations. Genesis 30, 190–194. ( 10.1002/gene.1063) [DOI] [PubMed] [Google Scholar]
- 52.Zhu S, Low BC. 2012. Using zebrafish for studying Rho GTPases signaling in vivo. Methods Mol. Biol. 827, 321–337. ( 10.1007/978-1-61779-442-1_21) [DOI] [PubMed] [Google Scholar]
- 53.Zhu S, Liu L, Korzh V, Gong Z, Low BC. 2006. RhoA acts downstream of Wnt5 and Wnt11 to regulate convergence and extension movements by involving effectors Rho kinase and Diaphanous: use of zebrafish as an in vivo model for GTPase signaling. Cell. Signal. 18, 359–372. ( 10.1016/j.cellsig.2005.05.019) [DOI] [PubMed] [Google Scholar]
- 54.Lai SL, Chang CN, Wang PJ, Lee SJ. 2005. Rho mediates cytokinesis and epiboly via ROCK in zebrafish. Mol. Reprod. Dev. 71, 186–196. ( 10.1002/mrd.20290) [DOI] [PubMed] [Google Scholar]
- 55.Hsu CL, et al. 2012. Cdc42 GTPase and Rac1 GTPase act downstream of p120 catenin and require GTP exchange during gastrulation of zebrafish mesoderm. Dev. Dyn. 241, 1545–1561. ( 10.1002/dvdy.23847) [DOI] [PubMed] [Google Scholar]
- 56.Talbot JC, Amacher SL. 2014. A streamlined CRISPR pipeline to reliably generate zebrafish frameshifting alleles. Zebrafish 11, 583–585. ( 10.1089/zeb.2014.1047) [DOI] [PMC free article] [PubMed] [Google Scholar]
- 57.Zhang T, et al. 2011. ApoA-II directs morphogenetic movements of zebrafish embryo by preventing chromosome fusion during nuclear division in yolk syncytial layer. J. Biol. Chem. 286, 9514–9525. ( 10.1074/jbc.M110.134908) [DOI] [PMC free article] [PubMed] [Google Scholar]
- 58.Rohde LA, Heisenberg CP. 2007. Zebrafish gastrulation: cell movements, signals, and mechanisms. Int. Rev. Cytol. 261, 159–192. ( 10.1016/S0074-7696(07)61004-3) [DOI] [PubMed] [Google Scholar]
- 59.Solnica-Krezel L, Driever W. 1994. Microtubule arrays of the zebrafish yolk cell: organization and function during epiboly. Development 120, 2443–2455. [DOI] [PubMed] [Google Scholar]
- 60.Cheng JC, Miller AL, Webb SE. 2004. Organization and function of microfilaments during late epiboly in zebrafish embryos. Dev. Dyn. 231, 313–323. ( 10.1002/dvdy.20144) [DOI] [PubMed] [Google Scholar]
- 61.Hammerschmidt M, Wedlich D. 2008. Regulated adhesion as a driving force of gastrulation movements. Development 135, 3625–3641. ( 10.1242/dev.015701) [DOI] [PubMed] [Google Scholar]
- 62.Enomoto A, et al. 2005. Akt/PKB regulates actin organization and cell motility via Girdin/APE. Dev. cell. 9, 389–402. ( 10.1016/j.devcel.2005.08.001) [DOI] [PubMed] [Google Scholar]
- 63.Holloway BA, Gomez de la Torre Canny S, Ye Y, Slusarski DC, Freisinger CM, Dosch R, Chou MM, Wagner DS, Mullins MC. 2009. A novel role for MAPKAPK2 in morphogenesis during zebrafish development. PLoS Genet. 5, e1000413. [DOI] [PMC free article] [PubMed] [Google Scholar]
- 64.Yoshizuka N, et al. 2012. A novel function of p38-regulated/activated kinase in endothelial cell migration and tumor angiogenesis. Mol. Cell. Biol. 32, 606–618. ( 10.1128/MCB.06301-11) [DOI] [PMC free article] [PubMed] [Google Scholar]
- 65.Kettleborough RN, et al. 2013. A systematic genome-wide analysis of zebrafish protein-coding gene function. Nature 496, 494–497. ( 10.1038/nature11992) [DOI] [PMC free article] [PubMed] [Google Scholar]
- 66.Zhang P, Bai Y, Lu L, Li Y, Duan C. 2016. An oxygen-insensitive Hif-3alpha isoform inhibits Wnt signaling by destabilizing the nuclear beta-catenin complex. eLife 5, e08996. [DOI] [PMC free article] [PubMed] [Google Scholar]
- 67.Spicer OS, Wong TT, Zmora N, Zohar Y. 2016. Targeted mutagenesis of the hypophysiotropic Gnrh3 in zebrafish (Danio rerio) reveals no effects on reproductive performance. PLoS ONE 11, e0158141 ( 10.1371/journal.pone.0158141) [DOI] [PMC free article] [PubMed] [Google Scholar]
- 68.Rossi A, Kontarakis Z, Gerri C, Nolte H, Holper S, Kruger M, Stainier DY. 2015. Genetic compensation induced by deleterious mutations but not gene knockdowns. Nature 524, 230–233. ( 10.1038/nature14580) [DOI] [PubMed] [Google Scholar]
- 69.Lin MJ, Lee SJ. 2016. Stathmin-like 4 is critical for the maintenance of neural progenitor cells in dorsal midbrain of zebrafish larvae. Sci. Rep. 6, 36188 ( 10.1038/srep36188) [DOI] [PMC free article] [PubMed] [Google Scholar]
- 70.Stainier DYR, et al. 2017. Guidelines for morpholino use in zebrafish. PLoS Genet. 13, e1007000 ( 10.1371/journal.pgen.1007000) [DOI] [PMC free article] [PubMed] [Google Scholar]
- 71.Kurayoshi M, Oue N, Yamamoto H, Kishida M, Inoue A, Asahara T, Yasui W, Kikuchi A. 2006. Expression of Wnt-5a is correlated with aggressiveness of gastric cancer by stimulating cell migration and invasion. Cancer Res. 66, 10 439–10 448. ( 10.1158/0008-5472.CAN-06-2359) [DOI] [PubMed] [Google Scholar]
- 72.Takeshita A, Iwai S, Morita Y, Niki-Yonekawa A, Hamada M, Yura Y. 2014. Wnt5b promotes the cell motility essential for metastasis of oral squamous cell carcinoma through active Cdc42 and RhoA. Int. J. Oncol. 44, 59–68. ( 10.3892/ijo.2013.2172) [DOI] [PubMed] [Google Scholar]
- 73.Zhu Y, et al. 2013. Rab35 is required for Wnt5a/Dvl2-induced Rac1 activation and cell migration in MCF-7 breast cancer cells. Cell. Signal. 25, 1075–1085. ( 10.1016/j.cellsig.2013.01.015) [DOI] [PubMed] [Google Scholar]
- 74.Myers JP, Robles E, Ducharme-Smith A, Gomez TM. 2012. Focal adhesion kinase modulates Cdc42 activity downstream of positive and negative axon guidance cues. J. Cell Sci. 125(Pt 12), 2918–2929. ( 10.1242/jcs.100107) [DOI] [PMC free article] [PubMed] [Google Scholar]
- 75.Chang F, Lemmon CA, Park D, Romer LH. 2007. FAK potentiates Rac1 activation and localization to matrix adhesion sites: a role for betaPIX. Mol. Biol. Cell 18, 253–264. ( 10.1091/mbc.e06-03-0207) [DOI] [PMC free article] [PubMed] [Google Scholar]
- 76.Komiya Y, Habas R. 2008. Wnt signal transduction pathways. Organogenesis 4, 68–75. ( 10.4161/org.4.2.5851) [DOI] [PMC free article] [PubMed] [Google Scholar]
- 77.Hanks SK, Ryzhova L, Shin NY, Brabek J. 2003. Focal adhesion kinase signaling activities and their implications in the control of cell survival and motility. Front. Biosci. 8, d982–d996. ( 10.2741/1114) [DOI] [PubMed] [Google Scholar]
- 78.Wu X, Suetsugu S, Cooper LA, Takenawa T, Guan JL. 2004. Focal adhesion kinase regulation of N-WASP subcellular localization and function. J. Biol. Chem. 279, 9565–9576. ( 10.1074/jbc.M310739200) [DOI] [PubMed] [Google Scholar]
- 79.Oteiza P, et al. 2010. Planar cell polarity signalling regulates cell adhesion properties in progenitors of the zebrafish laterality organ. Development 137, 3459–3468. ( 10.1242/dev.049981) [DOI] [PubMed] [Google Scholar]
- 80.Topczewska JM, Topczewski J, Solnica-Krezel L, Hogan BL. 2001. Sequence and expression of zebrafish foxc1a and foxc1b, encoding conserved forkhead/winged helix transcription factors. Mech. Dev. 100, 343–347. ( 10.1016/S0925-4773(00)00534-7) [DOI] [PubMed] [Google Scholar]
- 81.Jessen JR, Topczewski J, Bingham S, Sepich DS, Marlow F, Chandrasekhar A, Solnica-Krezel L. 2002. Zebrafish trilobite identifies new roles for Strabismus in gastrulation and neuronal movements. Nat. Cell Biol. 4, 610–615. ( 10.1038/ncb828) [DOI] [PMC free article] [PubMed] [Google Scholar]
- 82.Park M, Moon RT. 2002. The planar cell-polarity gene stbm regulates cell behaviour and cell fate in vertebrate embryos. Nat. Cell Biol. 4, 20–25. ( 10.1038/ncb716) [DOI] [PubMed] [Google Scholar]
- 83.Myers DC, Sepich DS, Solnica-Krezel L. 2002. Bmp activity gradient regulates convergent extension during zebrafish gastrulation. Dev. Biol. 243, 81–98. ( 10.1006/dbio.2001.0523) [DOI] [PubMed] [Google Scholar]
- 84.Bakkers J, Kramer C, Pothof J, Quaedvlieg NE, Spaink HP, Hammerschmidt M. 2004. Has2 is required upstream of Rac1 to govern dorsal migration of lateral cells during zebrafish gastrulation. Development 131, 525–537. ( 10.1242/dev.00954) [DOI] [PubMed] [Google Scholar]
Associated Data
This section collects any data citations, data availability statements, or supplementary materials included in this article.
Supplementary Materials
Data Availability Statement
This article has no additional data.