Abstract
Purpose:
Obesity has emerged as one of the biggest health crisis and is the leading cause of death and disabilities around the world. BMI trends suggest that majority of the increase in T2D is resulting from the increased prevalence of obesity. In fact, 85.2% of people with T2D are overweight or obese. The highest prevalence for obesity is seen in non-Hispanic, African American women (56.6%). T2D is classified as an inflammatory disease because of elevated, circulating pro-inflammatory cytokines and acute-phase inflammatory proteins. This study was designed to determine how high HbA1c and serum glucose correlate with circulatory cytokine levels in obese, African American women.
Methods:
We investigated cytokine/chemokine serum levels using a multiplex assay. Then we used Pairwise Pearson Correlation Test to determine the relationship between clinical metabolic parameters and cytokine/chemokine serum levels.
Results:
The results indicated that participants with elevated HbA1c exhibited an up regulation of IL-3, IL-4, IL-7, TNF-α, IFN-α2 and CX3CL1 serum levels compared to participants with normal HbA1c. These cytokines were also correlated with several clinical metabolic parameters.
Conclusions:
The results suggest that IL-3, IL-4, IL-7, TNF-α, IFN-α2 and CX3CL1 serum levels may contribute to the development and onset of type 2 diabetes.
Keywords: African American, interleukins, diabetes, HbA1c, cardiovascular disease, obesity
Introduction
Obesity has emerged as one of the biggest health crisis and is the leading cause of death and disabilities around the world [1]. If these trends persist, it is estimated that by 2030, 86.3% of adults will be overweight or obese and 51.1% obese by the year 2048 [2]. Obesity increases faster in adults than adolescents and faster in females than males. The highest prevalence for obesity is seen in non-Hispanic, African American women (56.6%) [3]. When considering obesity alone, African American women has the highest rate of increase (0.88% annually) compared with other ethnic groups. BMI trends suggest that majority of the increase in the prevalence of type 2 diabetes (T2D) is resulting from the increased prevalence of obesity. In fact, 85.2% of people with T2D are overweight or obese [4]. Using obesity measures alone, African American women have the greatest risk for developing T2D. It is estimated that 1 in 3 Americans will have T2D by 2050 [5]. The economic burden linked to diagnosed and undiagnosed T2D, gestational diabetes mellitus, and prediabetes surpassed $322 billion in 2012, which is a 48% increase from that of 2007 in the United States alone [6].
Obesity, a chronic disease characterized by the enlargement of adipose tissue and inflammatory components, is highly correlated to the development of several metabolic diseases [7]. Individuals with abdominal obesity, who have accumulated visceral adipose tissue (VAT), have an increased risk of developing insulin resistance or metabolic syndrome. Studies have shown the crucial role of VAT in obesity inflammation [8]. These conditions precede the development of T2D and are highly correlated with NAFLD [9,10]. Increased levels of cholesterol are associated with obesity, cardiovascular disease (CVD) and atherosclerosis. Immune responses to these conditions are mediated by chemokines, which lead to the innate immune response characterized by the production of cytokines.
T2D is caused by defects in insulin secretion, insulin action, or both, in responses to high circulating levels of glucose. This results in insufficient hepatic and peripheral glucose clearance. T2D is classified as an inflammatory disease because of elevated, circulating pro-inflammatory cytokines and acute-phase inflammatory proteins response [11,12]. The primary purpose of inflammation is to restore tissue homeostasis. However, when the degree or interval of inflammation is excessive, inflammation may lead to tissue injury [13]. In diabetes, the presence of chronic, low-grade inflammation increases the risk of cardiovascular and kidney complications [14].
Inflammatory cytokines have been involved in the development of diabetic complications, including diabetic kidney disease (DKD) [14–19]. Mounting incidences of obesity and T2D have made DKD the most prominent cause of chronic kidney disease and end-stage renal disease in the world. Despite pharmacological interventions, which include glycemic control and inhibitors of the renin-angiotensin system, DKD is responsible for approximately half of all cases of end-stage renal disease in the US [20]. In DKD, dendritic cells and macrophages have both been reported to infiltrate the kidneys and increased expression of adhesion molecules, cytokines and chemokines [21–23]. This correlates with clinical and histological measures of DKD in both animal models and human kidneys [24,25].
Interleukins (IL) are regulatory proteins, capable of obstructing and accelerating inflammatory processes. Interleukins are responsible for cellular growth, differentiation, functional cell- surface receptor expression, and cellular effector function [26]. Interleukins may be the most widely produced biomarkers; however, there is considerable ambiguity regarding their clinical value. Many interleukins are pleiotropic and are capable of acting on different cell types. They also possess paradoxical effects; an interleukin may have protective properties in one system and destructive properties in another system [26].
Inflammation is prevalent in obesity due to the expansion of VAT, which leads to insulin resistance and T2D. Inflammatory cytokines also play a major role in the progression of T2D and diabetic complications. This study was designed to determine how high HbA1c and serum glucose correlates with circulatory cytokine levels in obese, African American women. African American women are the most at risk population for T2D and would benefit greatly from this study. The cytokines and chemokines selected for this study are prominent in inflammation. To eliminate obesity as a confounding factor of cytokine levels, both the control and experimental groups were obese. We also investigated the relationship between cytokine levels and clinical metabolic parameters. Herein, we present data showing cytokine and chemokine serum levels are significantly higher in participants with high HbA1c in comparison to control group. In addition, several clinical metabolic parameters are correlated with these key inflammatory cytokines.
Methods
Study Population
A total of 68 whole blood samples were collected from African American women: 34 obese, normal HbA1c and 34 obese, high HbA1c participants. We define normal HbA1c as ≤ 6.5 and high HbA1c as >7.0. The participants also completed a survey about their health status and lifestyle. All participants were over the age of 40 and located in a rural northeastern county in North Carolina. Participants in both groups were on medications to regulate hypertension, cholesterol and T2D. Participants were fasting during blood collection. Blood samples were processed and serum was collected and immediately frozen at −80 °C until use.
After serum collection we discovered two participants that identified as non-diabetic, actually had HbA1c levels above 7.0. There were 14 participants with a previous self-reported diagnosis of T2D that had HbA1c levels lower than 6.5. We classified the control group as participants with HbA1c ≤ 6.5 and participants with HbA1c >7.0 were classified as the experimental group, regardless of self-reported diabetic status. This investigation was designed to determine the impact of current circulating glucose on current serum cytokine levels. We cased matched the participants in this study based on age and BMI. We also made sure that every pair has at least a 2% difference in HbA1c. Men were excluded from the study due to low participation and a desire to eliminate sex as a potential confounding variable. Informed written consent was obtained for all participants and the right to privacy was observed according to the North Carolina Central University Institutional Review Board approved protocol.
Cytokine/Chemokine Quantification
A total of 30 chemokines and cytokines were quantified using panel MILLIPLEX MAP Human Cytokine/Chemokine Magnetic Bead Panel-30 Plex-Immunology Multiplex Assay (Milliplex map kit, HCYTMAG-60 K; Millipore, USA) following the manufacturer’s instructions. Analyte quantification from the reactions were obtained using Luminex Technologies and Luminex Xponent managed the data output. Milliplex analyst software (Version 5.1 Flex; Darmstadt, Germany) was used to determine the analyte concentration (pg/mL) using mean fluorescence intensity (MFI).
Participant Metabolic Parameter Quantification
Clinical metabolic parameters were determined using standard commercial kits administered by Laboratory Corporation of America.
Statistical analysis
The data from each assay were expressed as mean ± SEM values. The experimental and control groups were compared using unpaired t-test. The relationship between cytokines and clinical metabolic parameters was assessed by Pearson’s correlation coefficient (r). Graph-Pad Prism software (Version 6.05; San Diego, CA, USA) was used for statistical analysis and graphical representation of the data. P-values for each assessment that are ≤0.05, were noted as statistically significant.
Results
Increased cytokine/chemokine levels in individuals with high HbA1c
Cytokine expression plays a role in glucose metabolism. We quantified 30 cytokine/chemokine levels in serum of 34 obese, normal HbA1c participants and 34 obese, high HbA1c participants. The basic demographic and clinical metabolic parameters of the participants are shown in Table I. There is no significant difference in age or BMI between the two groups. There is a significant difference in HbA1c (p<0.0001) and fasting glucose levels in the serum (p<0.0001). We also observed a significant difference in circulating VLDL cholesterol (p =0.005), triglycerides (p =0.019) and sodium (p=0.008) between the two groups. There was no significant difference between the other parameters measured.
Table I.
Participant Characteristics
| All (mean± SEM) |
Normal HbA1c (mean± SEM) N=34 |
High HbA1c (mean± SEM) N=34 |
P-value | |
|---|---|---|---|---|
| Age (years) | 60.54 ±1.06 | 60.88 ±1.51 | 60.21 ± 1.52 | 0.753 |
| BMI (kg/m2) | 35.73 ±0.96 | 34.72 ±1.56 | 36.74 ±1.13 | 0.299 |
| HbAlc (%) | 7.76 ±0.26 | 5.94 ± 0.05 | 9.58 ±0.28 | <0.0001 |
| Glucose Serum (mg/dL) | 142.4 ±9.66 | 101.4 ±3.30 | 183.4 ±16.31 | <0.0001 |
| Total Cholesterol (mg/dL) | 179.20 ±5.01 | 178.6 ±6.58 | 179.9 ±7.66 | 0.896 |
| HDL Cholesterol (mg/dL) | 55.13 ±2.52 | 59.85 ±4.41 | 50.41 ±2.24 | 0.062 |
| LDL Cholesterol (mg/dL) | 99.24 ±3.92 | 100.9 ±5.61 | 97.58 ±5.54 | 0.689 |
| VLDL Cholesterol (mg/dL) | 22.30 ±1.64 | 17.85 ±1.71 | 26.88 ±2.61 | 0.005 |
| Triglycerides (mmol/L) | 123.60 ±14.54 | 89.24 ±8.49 | 157.9 ±26.73 | 0.019 |
| Creatinine (mg/dL) | 0.89 ±0.04 | 0.81 ±0.02 | 0.96 ±0.07 | 0.076 |
| BUN/Creatinine (Ratio) | 17.38 ±0.69 | 17.44 ±1.09 | 17.32 ±0.86 | 0.933 |
| Sodium (mmol/L) | 140.20 ±0.34 | 141.1 ± 0.38 | 139.4 ±0.51 | 0.008 |
| Calcium (mg/dL) | 9.48± 0.05 | 4.09 ±0.06 | 4.27 ±0.09 | 0.849 |
| Potassium (mmol/L) | 4.18±0.05 | 9.49 ±0.08 | 9.47 ±0.06 | 0.092 |
| *C-Reactive protein | 6.38±1.08 | 4.94 ± 1.05 | 8.45 ±2.101 | 0.149 |
N=23 for normal HbA1c and N=16 for high HbA1c
Several cytokines are known to be involved in systemic inflammatory and metabolic disorders including T2D. However, the type of cytokines that may contribute to higher incidence and circulatory levels in obese, African American women with high HbA1c remains ambiguous. We therefore, determined serum levels of several cytokines/chemokines in participants with normal and high HbA1c. The data shows cytokine/chemokine levels that are significantly different between the experimental and control group. Using Luminex technology, we were able to determine that the serum levels of IL-3 (P=0.0007), IL-4 (P=0.0126), IL-7 (P=0.0012), TNF-α (P=0.0005), IFN-α2 (P=0.0079) and CX3CL1 (P=0.0069) were significantly higher in obese, African American women with high HbA1c compared to control (Figure 1). The number of individuals fluctuate because the minimum detection level for each analyte varies. Minimum detection levels can be found in Table SI. In previous studies, IL-1, IL-6, IL-8, IL-10 has been noted as key regulators of obesity and T2D. We observed no significant difference in IL-1, IL-6, IL-8, IL-10 between the control and experimental group in this study (Table II). Values for the rest of the cytokines can be found in Table SII.
Figure 1:
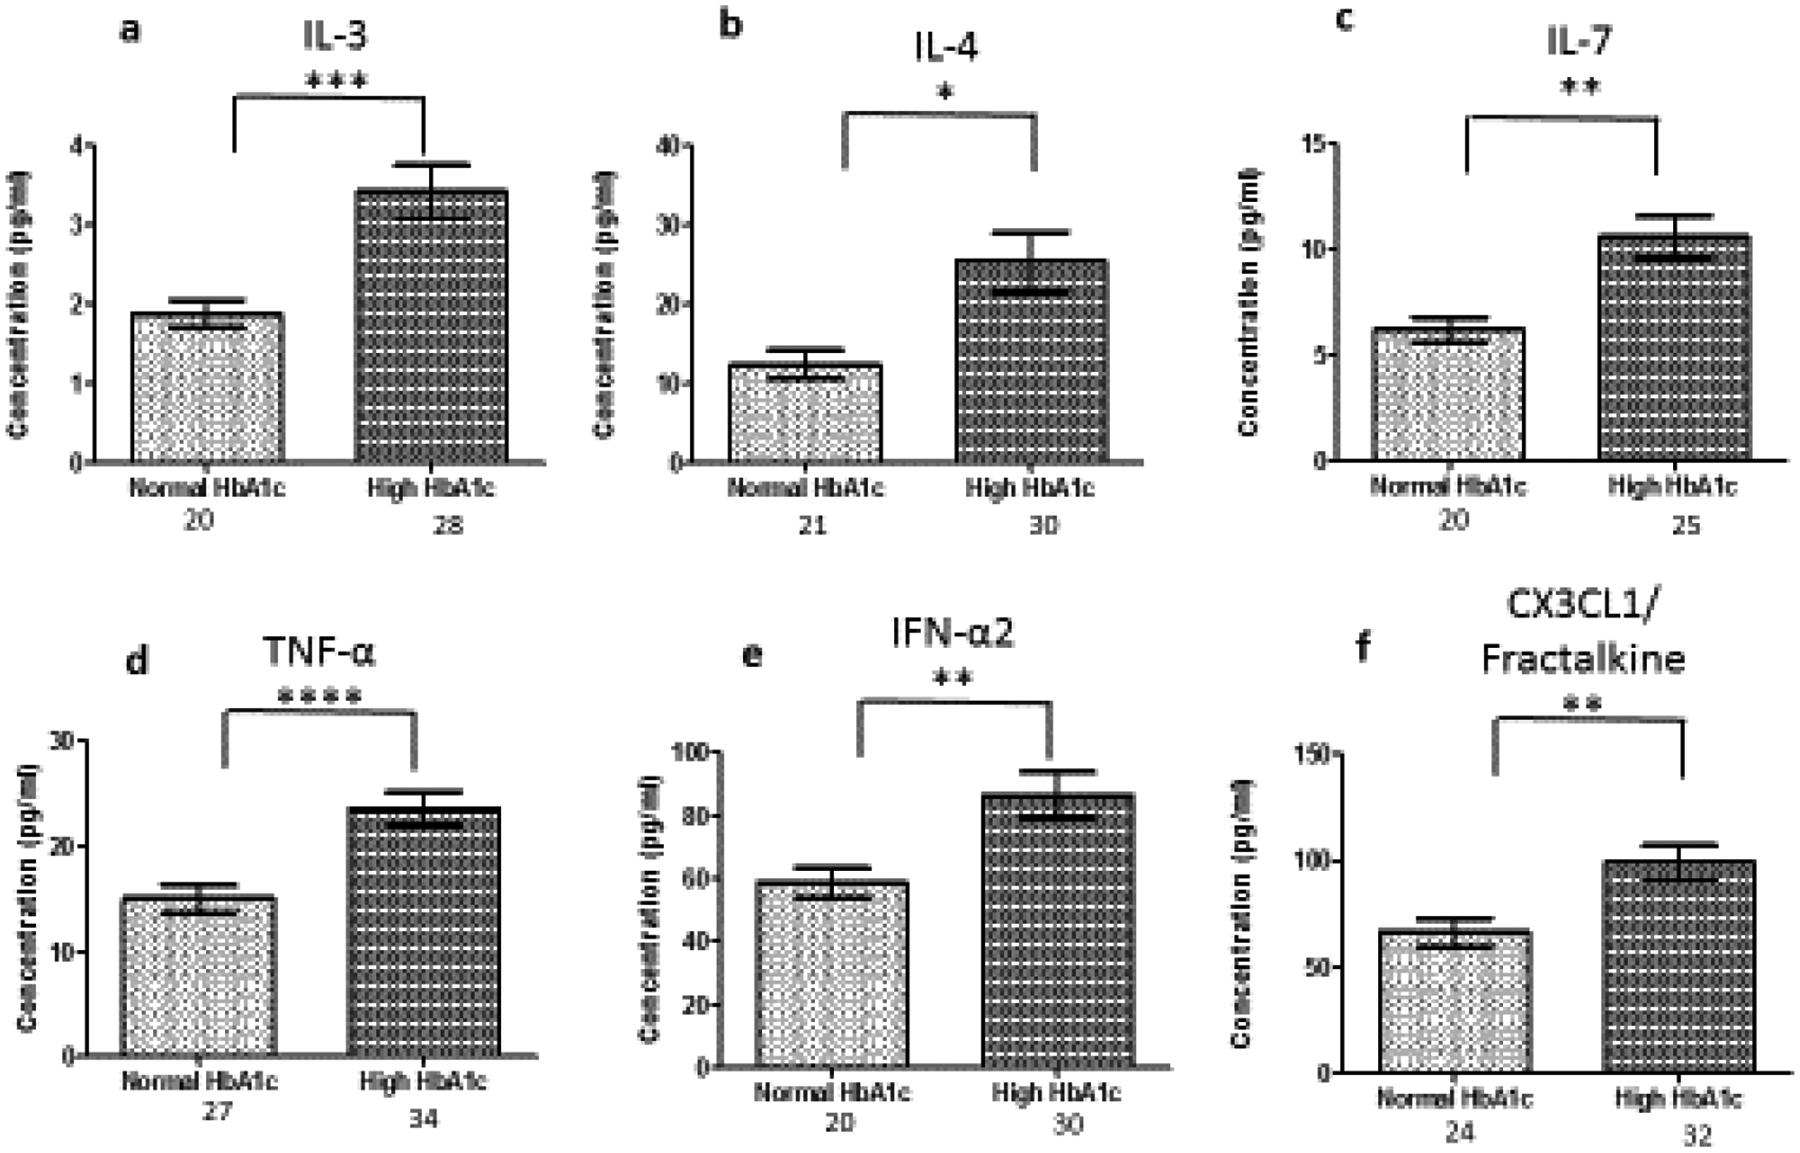
Serum cytokine levels in normal and high HbA1c individuals. The number of individuals fluctuate due to some values registering below threshold, Cytokine levels were measure using magnetic beads from 30-plex immune assay from Millipore Sigma. *significant at p<0.05; ** significant at p<0.005; ***significant at p<0.001; ****significant at p<0.0001;
Table II.
Key Inflammatory Agents in Literature
| Cytokine | Normal HbA1c (N) | High HbA1c (N) | P-value |
|---|---|---|---|
| IL-1a | 59.42 ± 21.32 (4) | 41.36 ± 8.34 (12) | 0.3501 |
| IL-1b | 1.120 ± 0.47 (11) | 2.331 ± 0.51 (19) | 0.1218 |
| IL-6 | 75.33 ± 47.33 (10) | 41.77 ± 15.51 (19) | 0.4094 |
| IL-8 | 15.55 ± 8.14 (26) | 16.84 ± 4.01 (33) | 0.8798 |
| IL-10 | 12.10 ± 2.90 (9) | 10.53 ± 1.53 (25) | 0.6129 |
Several inflammatory cytokines/ chemokines correlate with clinical metabolic parameters
Cytokines are the key regulators of inflammatory responses. Fluctuating cytokine levels have been associated with various metabolic disorders including T2D and DKD. We, therefore, wanted to investigate the association of circulating pro-inflammatory cytokine levels (IL-3, IL-4, IL-7, TNF-α, IFN-α2, CX3CL1) and clinical metabolic parameters of the participants. In this regard, we found that IL-4 (R= −0.37, P=0.04) and IFN-α2 (R= −0.48, P=0.007) were negatively correlated with BMI in participants with high HbA1c (Figure 2). In all participants, IL-7 (R=0.44, P=0.002) and TNF-α (R=0.52, P=0.001) were positively correlated with HbA1c (Figure 3).
Figure 2:
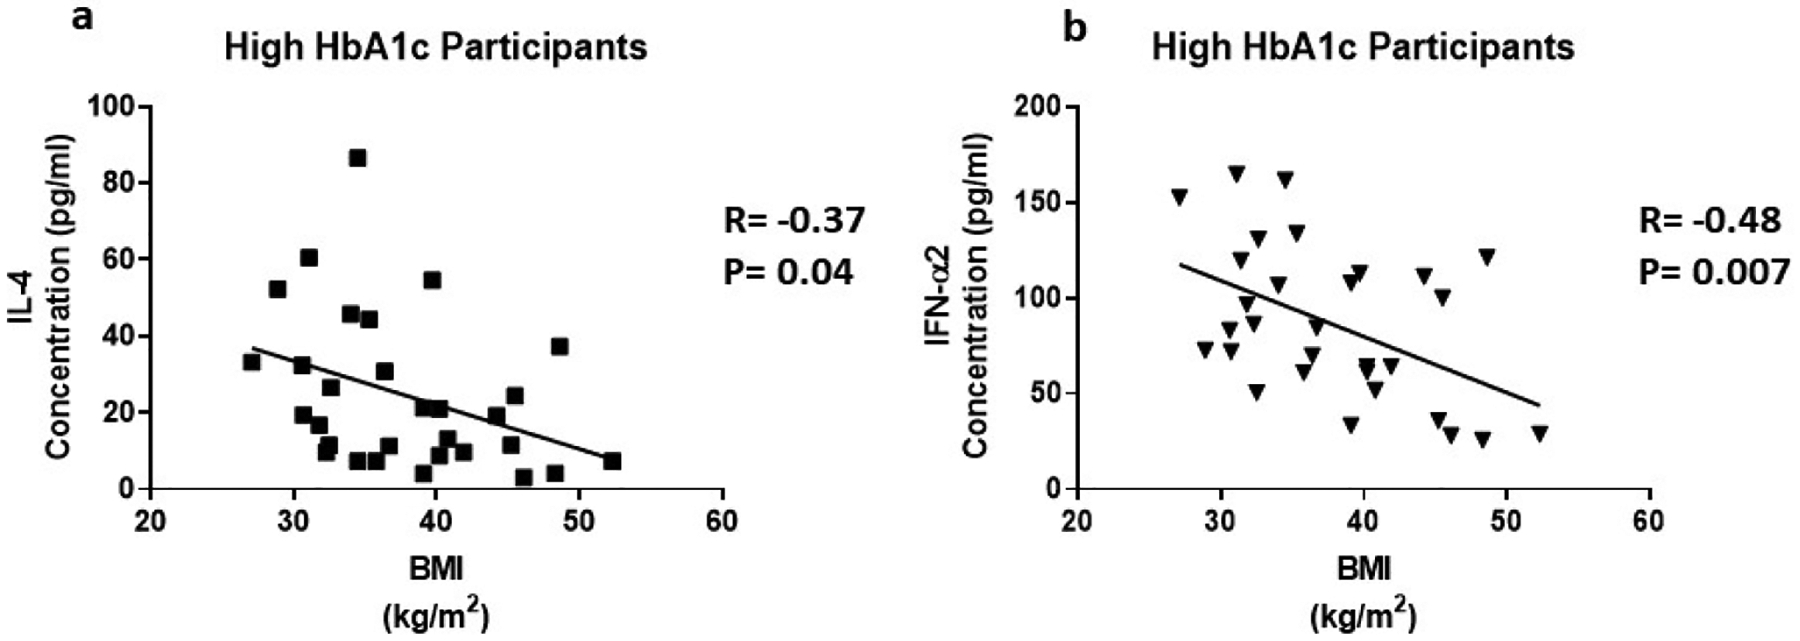
The correlation between BMI and inflammatory cytokines in individuals with high HbA1c. Cytokine levels were measure using magnetic beads from 30-plex immune assay from Millipore Sigma
Figure 3:
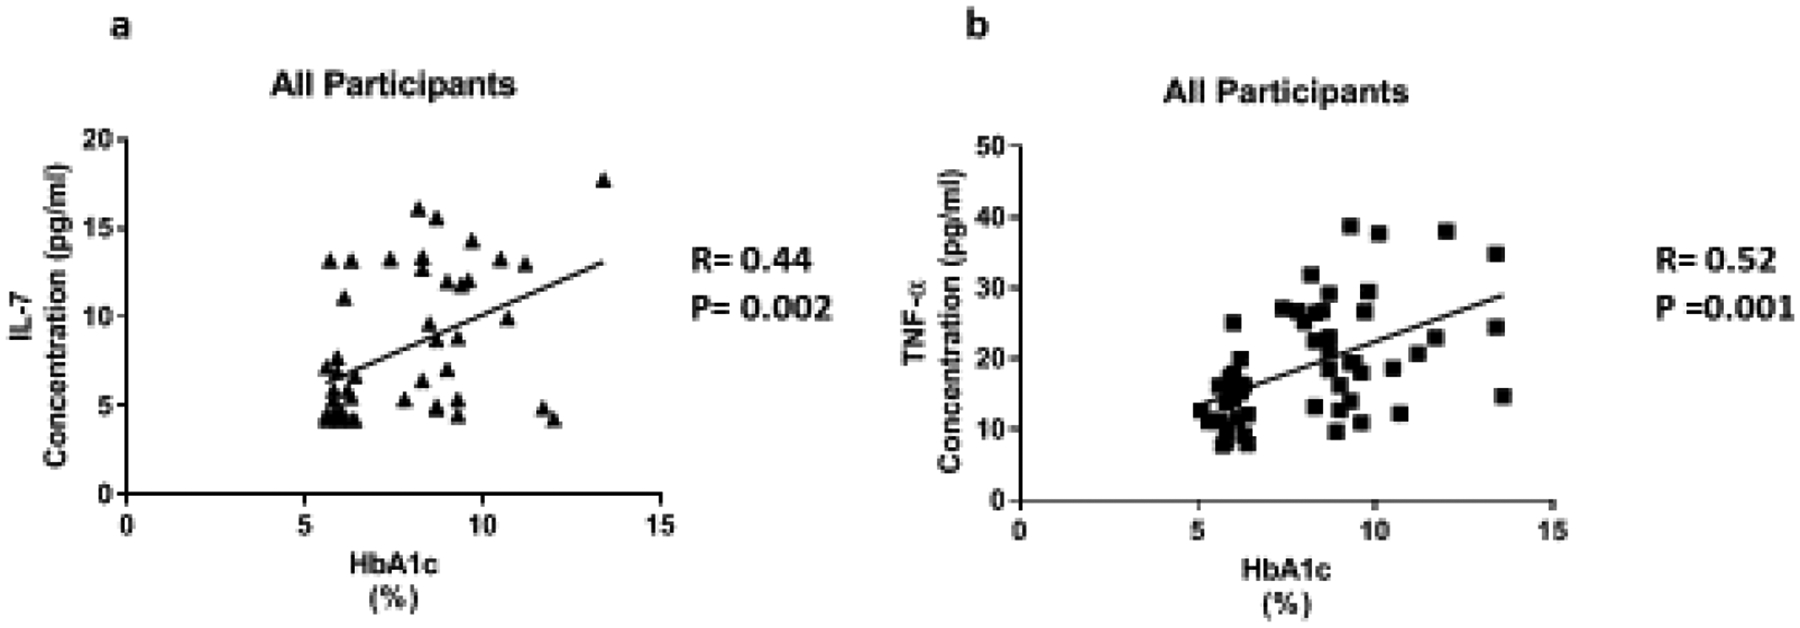
The relationship of HbA1c with inflammatory cytokines in all participants. Cytokine levels were measure using magnetic beads from 30-plex immune assay from Millipore Sigma.
Risk factors for chronic kidney disease include age, hypertension, T2D, CVD, family history, and levels of serum creatinine. TNF-α (R=0.35, P=0.05) was positively correlated with creatinine in participants with high HbA1c (Figure 4a). In addition, TNF-α (R=0.36, P=0.005) was positively correlated with creatinine in all participants (Figure 4b). Il-7 (R= −0.47, P=0.01) and TNF-α (R= −0.35, P=0.04) were negatively correlated with the Bun/Creatinine ratio is participants with high HbA1c (Figure 5a and 5b). In all participants, IFN-α2 (R= −0.32, P=0.02) is negatively correlated with the Bun/Creatinine ratio (Figure 5c). Cytokine expression was also correlated with electrolytes. Chronic kidney disease can cause imbalances in bone metabolism and creatinine clearance. These imbalances also can cause the dysregulation of calcium and sodium. In all participants, IL-7 (R= −0.32, P=0.03) is negatively correlated with sodium (Figure 6a). TNF-α (R=0.35, P=0.04) is positively correlated with calcium in all participants (Figure 6b).
Figure 4:
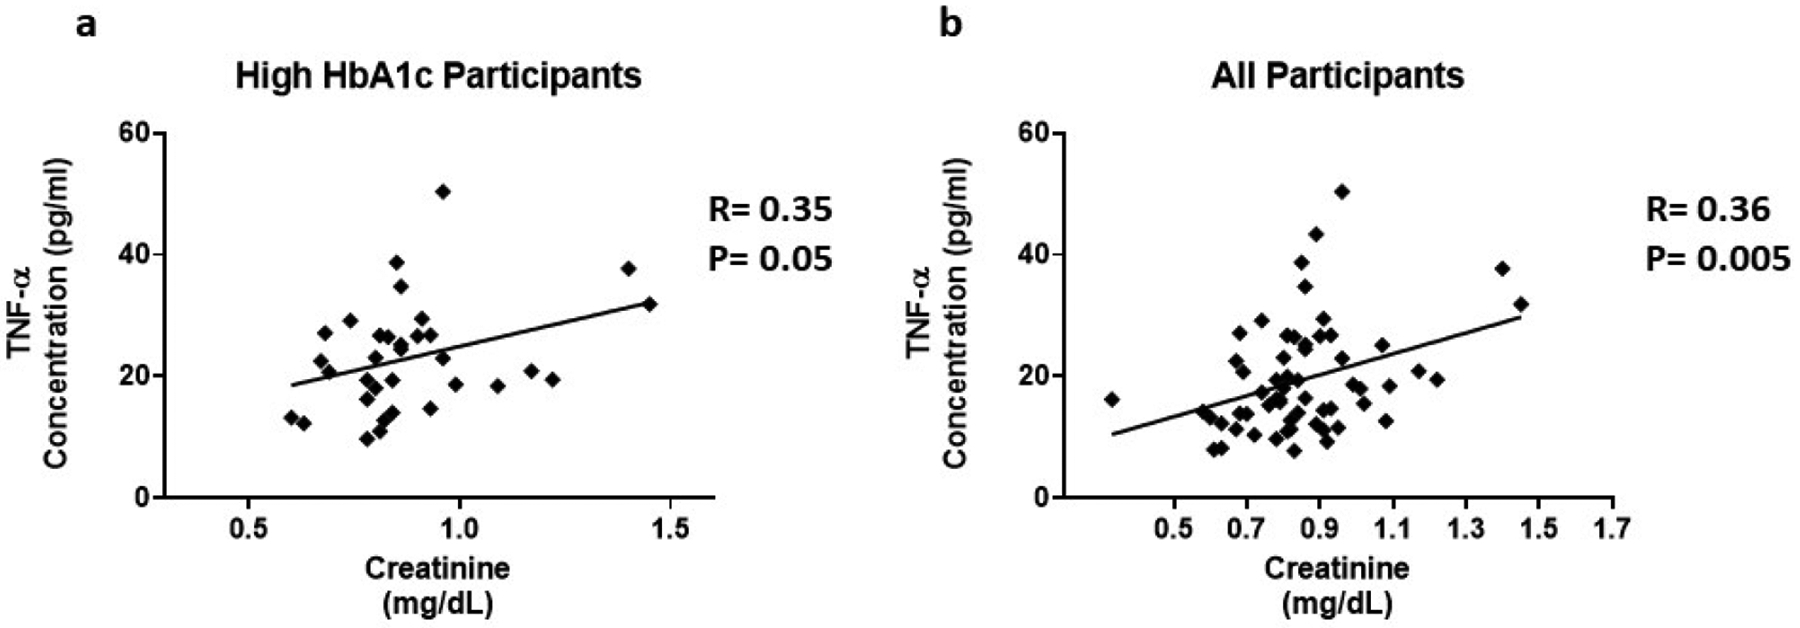
The association between inflammatory cytokines and Creatinine. Cytokine levels were measure using magnetic beads from 30-plex immune assay from Millipore Sigma.
Figure 5:
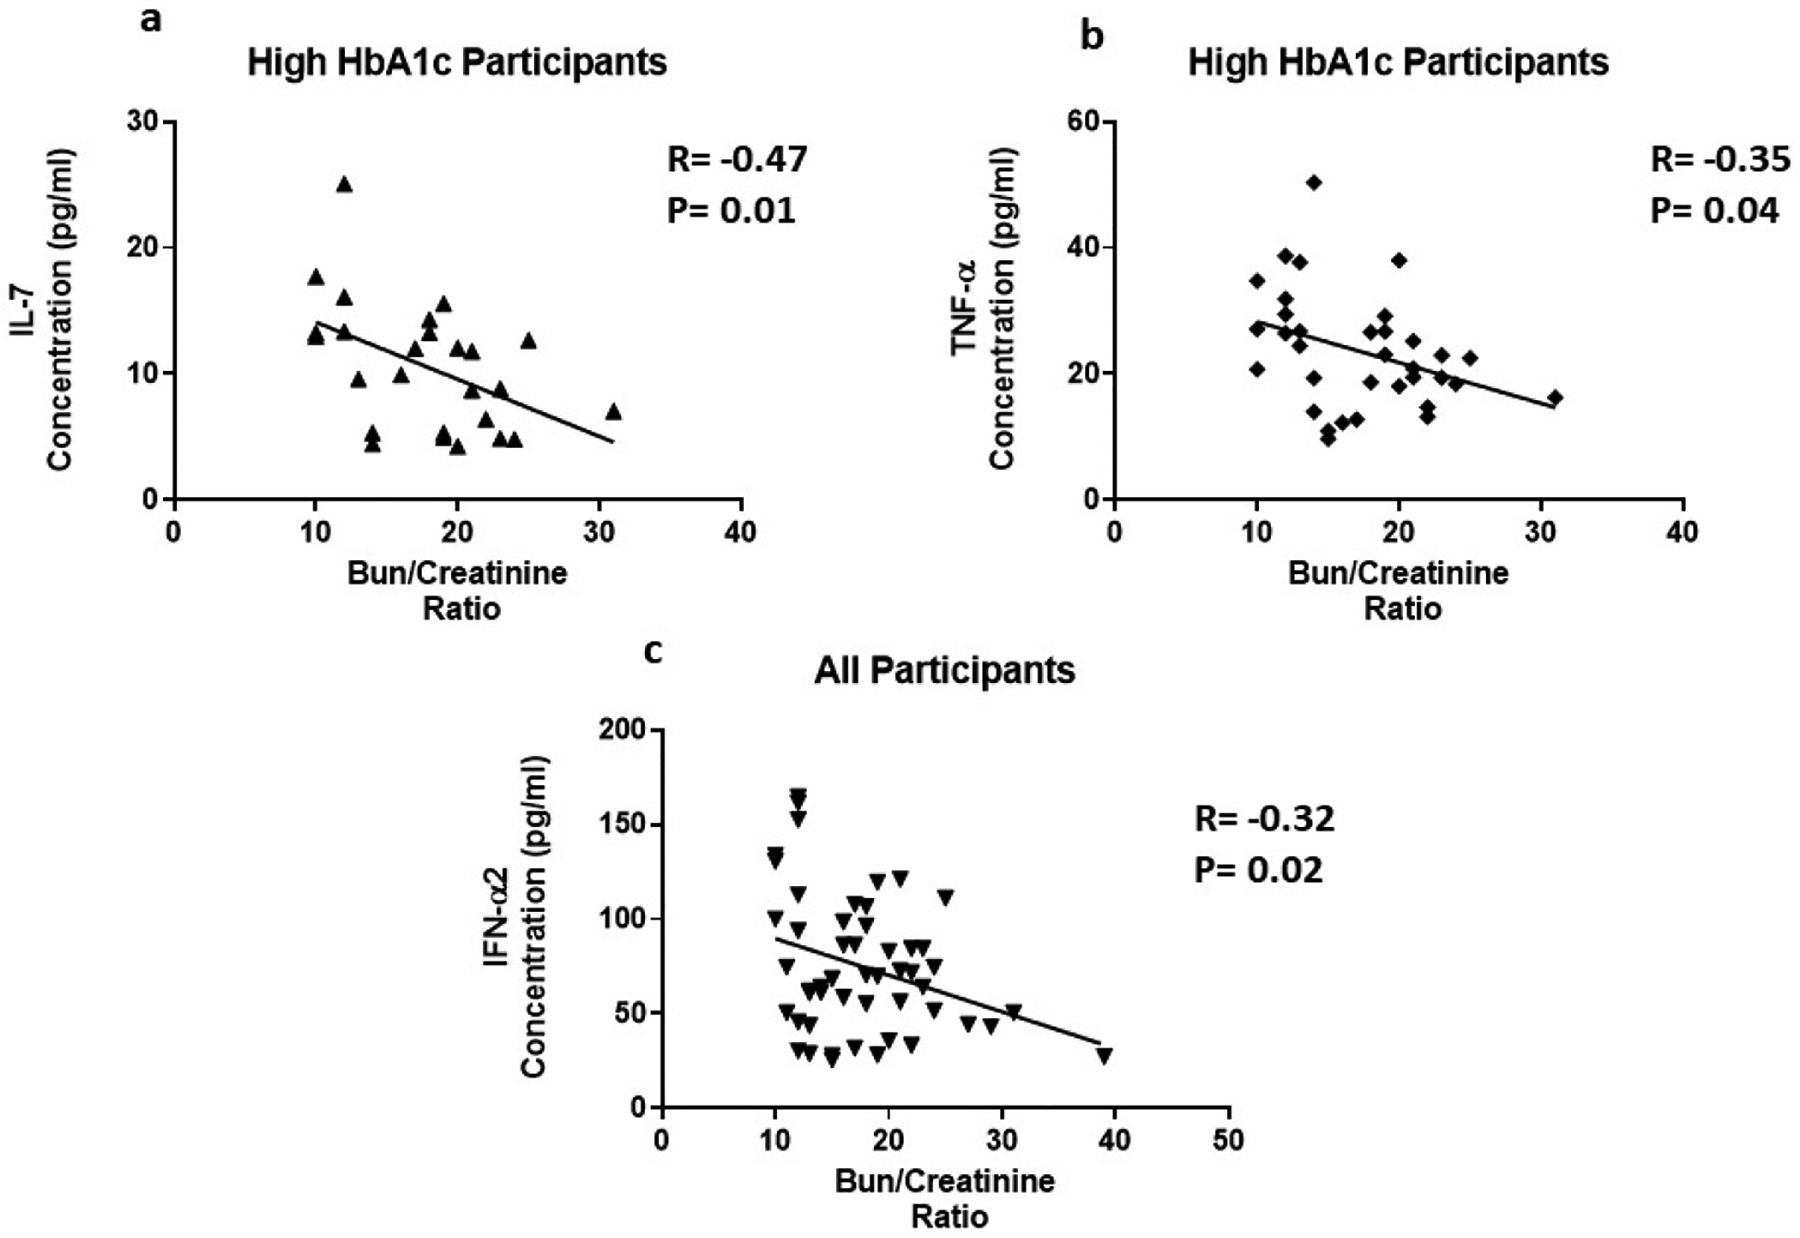
The correlation of inflammatory cytokines and Bun/Creatinine ratio. Cytokine levels were measure using magnetic beads from 30-plex immune assay from Millipore Sigma.
Figure 6:
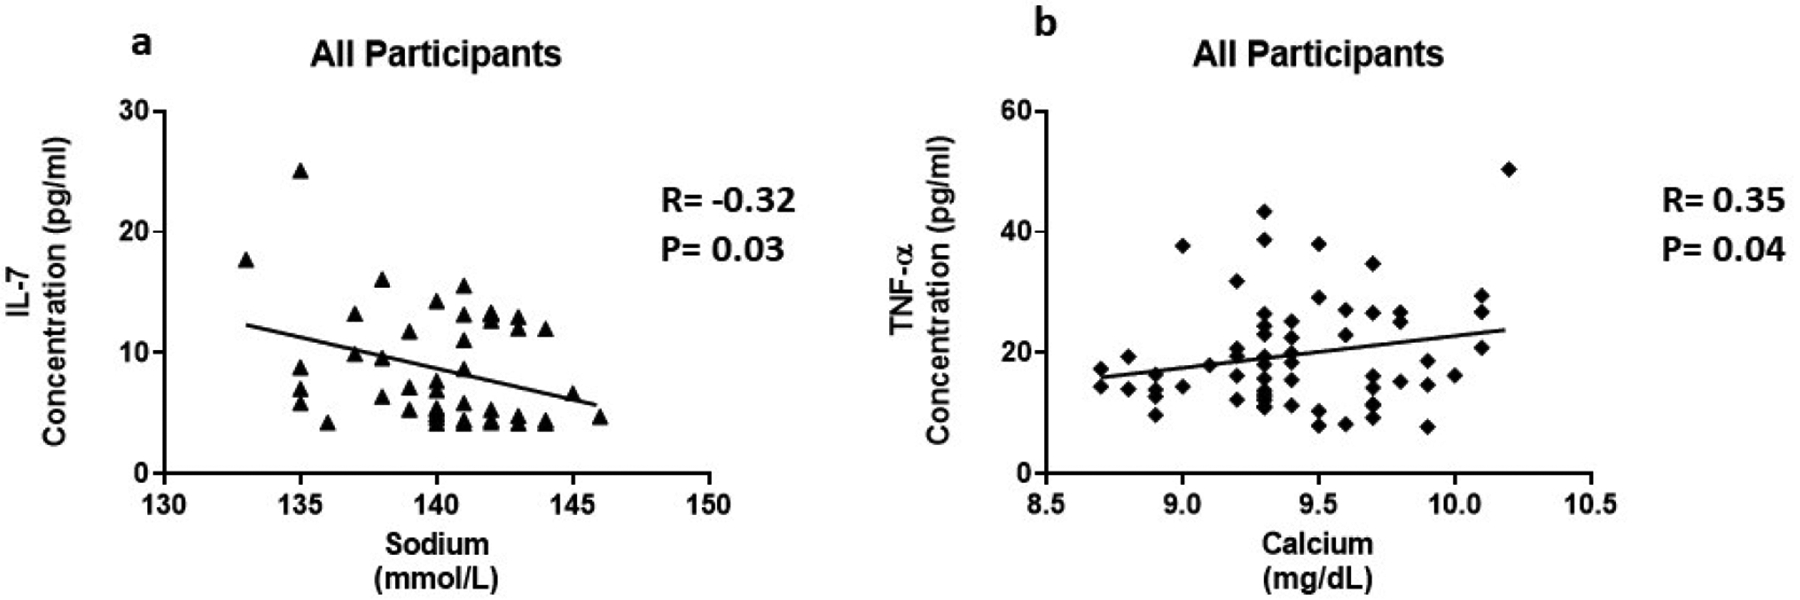
The association of inflammatory cytokines and electrolytes. Cytokine levels were measure using magnetic beads from 30-plex immune assay from Millipore Sigma.
Increased cholesterol levels can trigger an innate response leading to the production of cytokines. We found that several cytokines are correlated with triglycerides and VLDL in this study. In all participants, IL-7 (R=0.37, P=0.02), TNF-α (R=0.36, P=0.005), and CX3CL1 (R=0.35, P=0.01 were positively correlated with triglycerides (Figure 7a–c). We observed IFN-α2 (R=0.47, P=0.04) positively correlated with triglycerides in participants with normal HbA1c (Figure 7d). In addition, IL-7 (R=0.36, P=0.03), TNF-α (R=0.31, P=0.01), and CX3CL1 (R=0.38, P=0.007 were positively correlated with VLDL in all participants (Figure 8a–c). In participants with normal HbA1c, IFN-α2 (R=0.47, P=0.04) was positively correlated with VLDL (Figure 8d). VLDL is a lipoprotein that enables fats and cholesterol, which include triglycerides, to move within the bloodstream.
Figure 7:
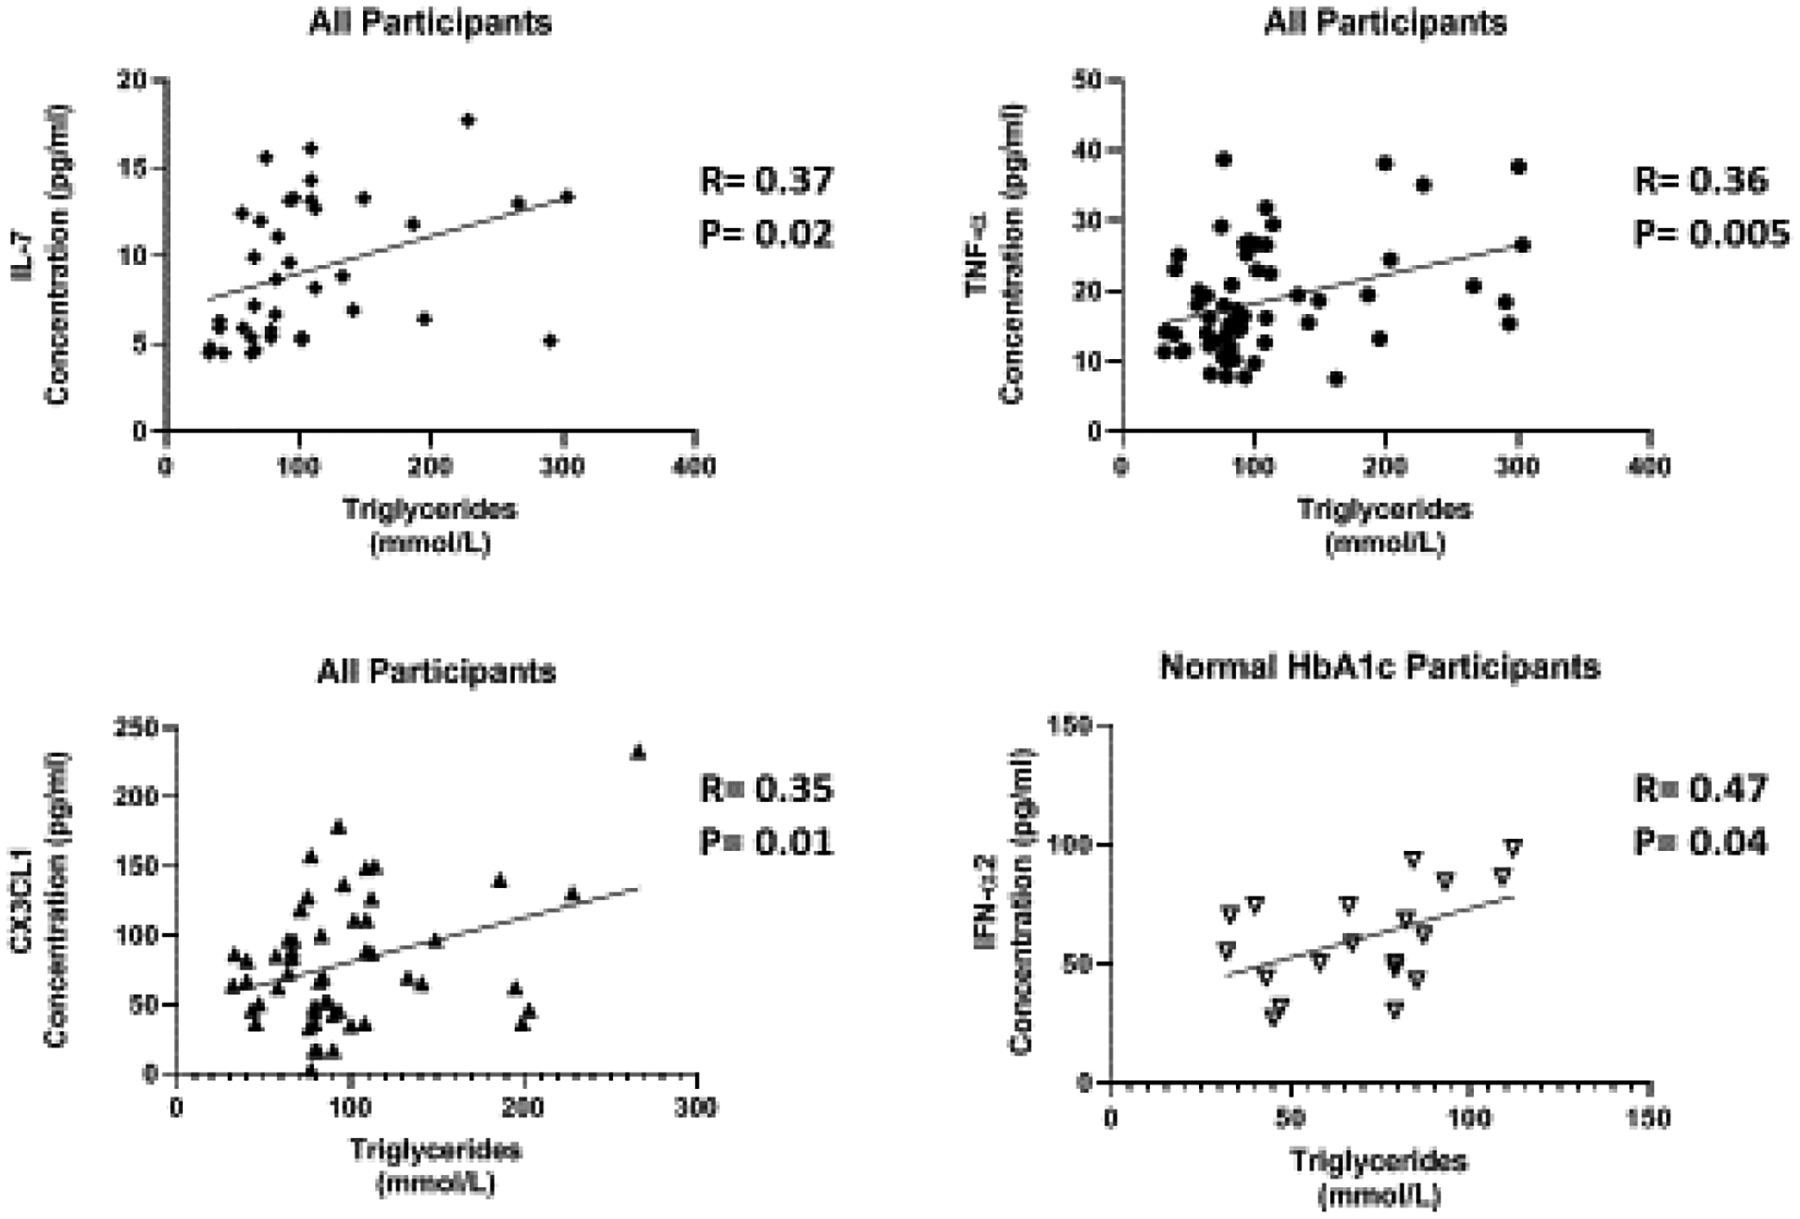
The relationship of Inflammatory cytokines and triglycerides. cytokine levels were measure using magnetic beads from 30-plex immune assay from Millipore Sigma.
Figure 8:
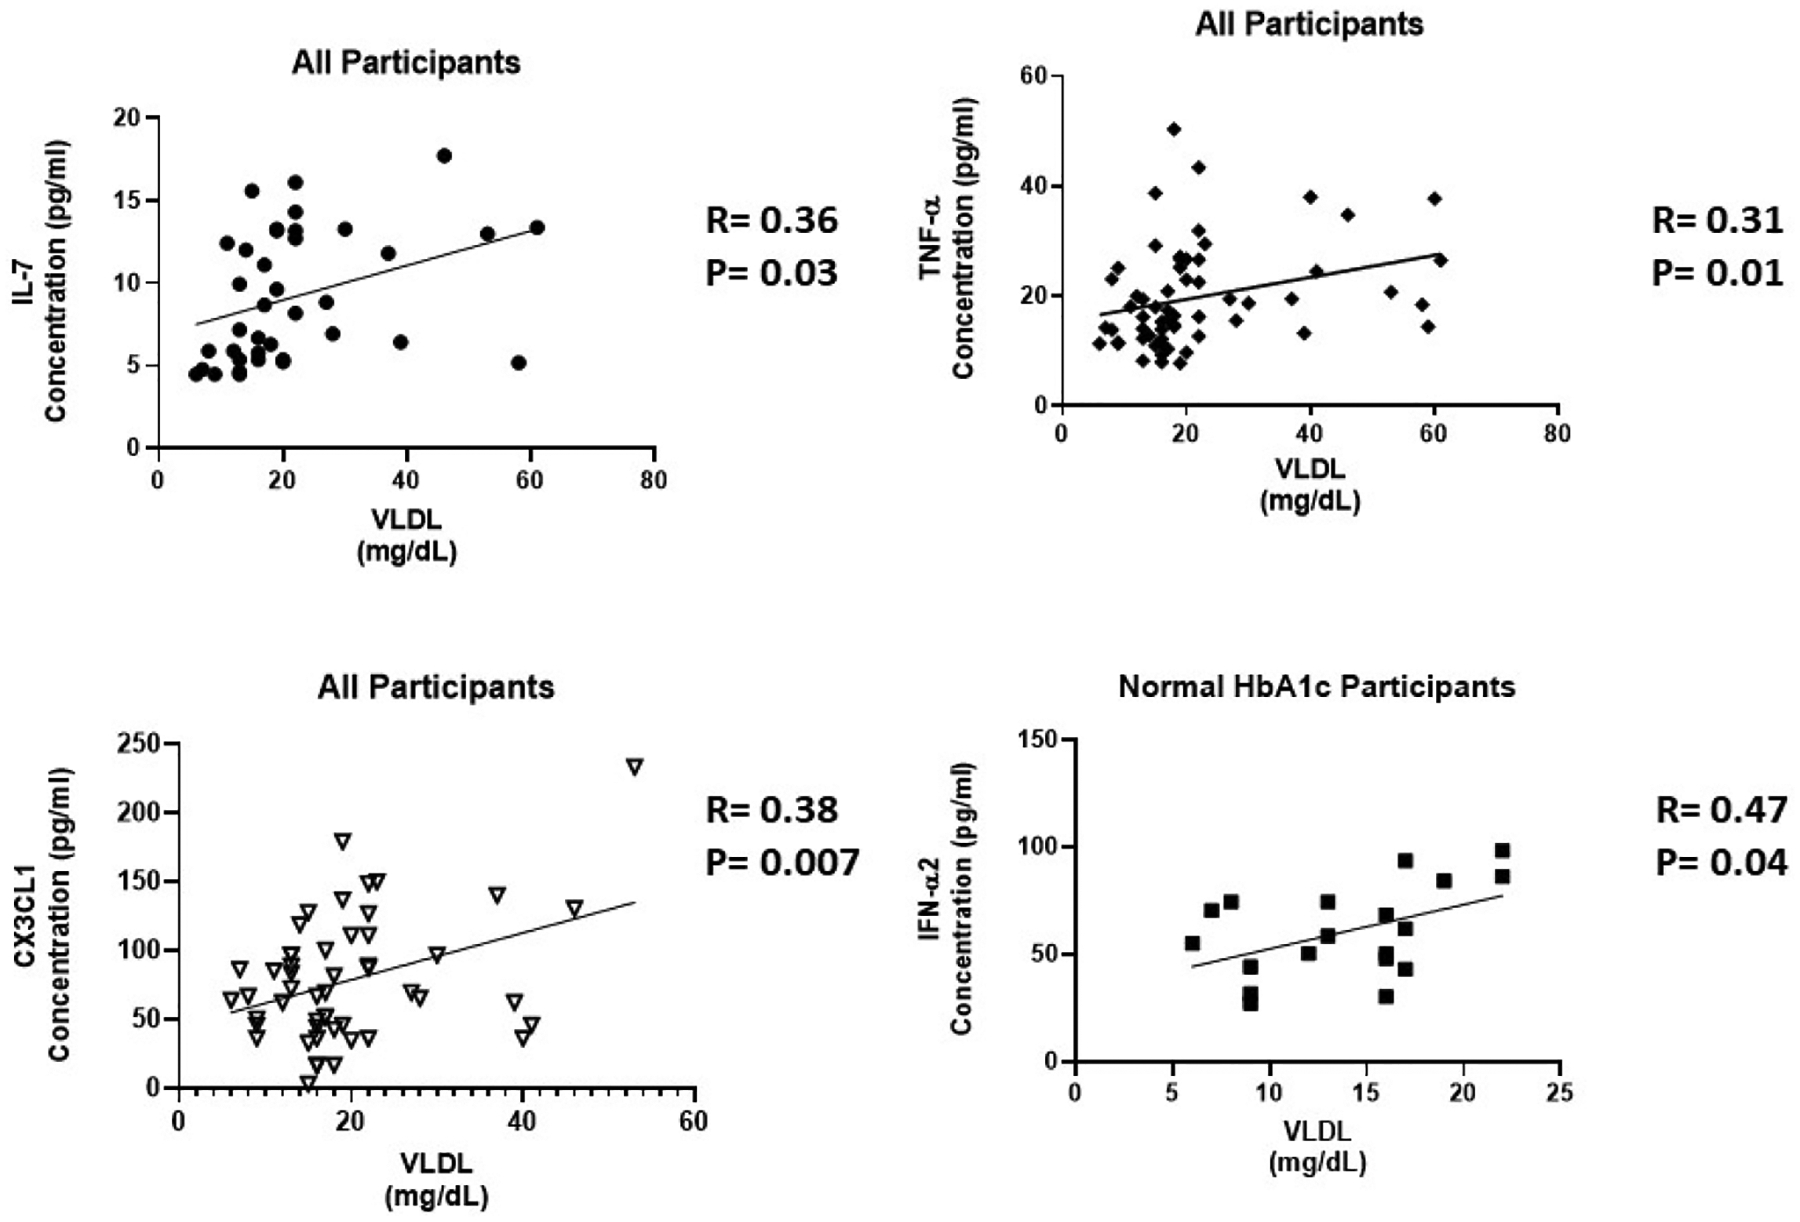
The correlation of inflammatory cytokines and VLDL. Cytokine levels were measure using magnetic beads from 30-plex immune assay from Millipore Sigma.
Discussion
Cytokines and chemokines are key modulators of inflammation. They play an active role in chronic inflammation via a complex network of interactions. A better understanding of cytokine expression and effected signaling pathways will help facilitate more efficient treatment of inflammatory diseases such as obesity and T2D. When the quantity or interval of inflammation response is excessive, patients are a risk for tissue injury. Diabetic complications such as CVD and DKD are eminent in obese populations with T2D, due to the presence of chronic, low-grade inflammation. African American women have the highest prevalence of T2D and body fat percentage and have the greatest risk of T2D. African American women are the least studied population that could benefit greatly from this study. We designed a study to determine the effect of high circulating glucose on cytokine levels. We eliminated obesity as a confounding influence on cytokine levels by selecting obese participants in the control and experimental groups, hence answering the question of HbA1c influence.
We found an increase in serum levels of five cytokines (IL-3, IL-4, IL-7, TNF-α IFN-α2) and a chemokine (CX3CL1). However, we did not observe a difference in IL-1, IL-6, IL-8, IL-10. These cytokines have been previously mentioned to be major regulators of inflammation in metabolic disease [26–29]. In our study, we found that there is no significant difference (Table II). This suggests that African American women may exhibit a different pattern of cytokine expression. Our study differs from other studies because of our case matched, single-sex study design. We also observed that the quantity of cytokines in circulation, compared to previous studies are upregulated approximately 2–5 fold or greater, depending upon the cytokine in question [28–30]. However, these studies also included men in addition to women. Some of the studies also included obese individuals in the control and experimental group as well; the quantity of circulating cytokine levels was still less than our African American population. African American women have a higher quantity of cytokines present in the blood, irrespective of the control or experimental group [28–30].
IL-3 is a glycoprotein cytokine involved in the hematopoietic response to infection, immune response and inflammatory stimulation. IL-3 has been reported to play a protective role in the pathogenesis of T1D and a destructive role in CVD [31,32]. In this study, we found to that IL-3 levels were upregulated 1.7 fold in the presence of high circulating glucose (Figure 1a). IL-3 was not correlated with any of the parameters in Table 1. Further studies are needed to elucidate the role of IL-3 in T2D. IL-4 is involved in the activation, growth and differentiation for lymphocytes. IL-4 has also been shown to protect lymphoid cells from apoptosis [33–35]. IL-4 plays a protective role in inflammation by suppressing pro-inflammatory cytokine production like TNF-α and IL-1 [36]. IL-4 levels are increased 1.9 fold in the presence of high circulating glucose (Figure 1b). Individuals with high HbA1c exhibit a negative correlation between IL-4 and BMI (Figure 2a). An increase in obesity increases the expression of pro-inflammatory cytokines and risk of metabolic disease. IL-4 expression may be increased because of increased expression of pro-inflammatory cytokines. Since pro-inflammatory cytokines are predominating involved in obesity [37], IL-4 may lose its protective role while blood glucose remains elevated. A high BMI, may contribute to a cascade of pro-inflammatory cytokines that IL-4 is unable to suppress.
IL-7 is a homeostatic cytokine involved in the maturation and survival of T-cells. IL-7 effect appears to be system dependent. Previous studies have shown that IL-7 can drive inflammation in CVD by activating platelets, monocytes, and chemokines [38]. However, in the kidneys, IL-7 protects renal tubular epithelial cells from high glucose-induced fibrosis [39]. In adipose tissue, IL-7 overexpression protects from impaired differentiation, glucose intolerance, and insulin resistance [40]. IL-7 administration in high fat diet mice protects from obesity and decreases adipose tissue inflammation [40]. We found IL-7 to be upregulated 1.7 fold in the presence of high circulating glucose (Figure 1c). This is consistent with the positive correlation between IL-7 levels and HbA1c (Figure 3a). Based on the negative correlation between BUN/Creatinine ratio and IL-7, we also believe that IL-7 may play a protective role in the kidney. The BUN/Creatinine ratio is a measure of kidney damage and our data suggest that the increase in serum IL-7, the less kidney damage (Figure 5a). IL-7 correlation with sodium is also consistent with IL-7’s protective role in the kidneys. Increased serum sodium has been associated with hypertension. We observe that sodium levels negatively correlate with IL-7 levels (Figure 6a). This data suggests that IL-7 may act in the renal system to decrease circulating sodium, possibly through filtration. IL-7 may decrease the risk of sodium-induced hypertension through the kidneys. Persistent increased circulating sodium can contribute to CVD. Altogether, this data suggests IL-7 may participate in protecting humans from CVD by decreasing hypertension parameters. We also observed an increase IL-7 in association with increasing VLDL and triglycerides (Figure 7a and Figure 8a). This suggests that IL-7 may drive dysfunction in the liver. Increased lipid content in the liver leads to NAFLD and insulin resistance [41]. It has been previously shown that IL-7 serum levels are increased in morbidly obese patients with simple steatosis [42].
TNF-α is a multifactorial, pro-inflammatory cytokine that activates macrophages and lymphocytes. It is involved in the pathogenesis of autoimmune diseases, rheumatoid arthritis, septic shock and several inflammatory disorders. Previous studies have shown that TNF-α production in adipose tissue derived from obese rodents and human may be a causative factor in obesity-associated insulin resistance and the pathogenesis of T2D [43–46]. TNF-α has also been implicated as a potent contributor to CVD by the upregulation of free fatty acids, the induction lipogenesis, and the inhibition of lipid metabolism [47–49]. Our results are consistent with previous studies. We found TNF-α has a positive correlation with VLDL and triglycerides (Figure 7b and Figure 8b). TNF-α also plays critical immunoregulatory role involved in immune homeostasis. Paradoxical functions of TNF-α result from interaction with its two receptors, TNFR1 and TNFR2 [50]. TNFR1 plays an immunoregulatory function to mediate chronic inflammation. TNFR1 is only expressed in the glomeruli of the kidney and expression is increased in inflammatory kidney diseases [51,52]. On the other hand, TNFR2 promotes leukocyte infiltration and tissue injury in an animal model of immune complex–mediated glomerulonephritis. TNFR2 is usually not expressed in normal kidney [51,53]. However, in response to kidney injury, TNFR2 expression is activated in post-capillary venules and in glomeruli in a glomerulonephritis model [53].
We found that TNF-α levels are upregulated 1.6 fold in the presence of high circulating glucose (Figure 1d). This result is consistent with the positive correlation between TNF-α levels and HbA1c (Figure 3b). Previous studies have also reported these findings [43–46]. In addition, we found a positive correlation between serum creatinine and TNF-α levels (Figure 4). This finding confirms previous reports implicating TNF-α expression in relation to kidney injury [53]. Increased TNF-α expression results in the infiltration of macrophages and monocytes into the kidney, causing extensive inflammation and leading to tissue injury. Tissue injury may affect creatinine clearance, resulting in an increased amount in the serum. The kidneys play a critical role in the balance between the internal milieu and external environment. Tissue injury may disrupt a number of homeostatic mechanisms that control serum calcium levels. Calcium absorption may be severely impaired in early chronic kidney disease, which results in very low urinary calcium excretion [54]. Impaired urinary excretion results in increased serum calcium levels due to retention. We observed a positive correlation between serum calcium levels and TNF-α levels (Figure 6b). We also observed a negative correlation between TNF-α levels and Bun/Creatinine ratio (Figure 5b). The Bun/Creatinine ratio is a measure of kidney filtration. Volume depletion leads to enhanced proximal tubule salt and water retention, thereby increasing the passive reabsorption of urea, leading to a rise in the Bun/Creatinine ratio. When Bun/Creatinine ratio is high, TNF-α levels are low. This result is opposite of what has been reported in previous studies.
Type I IFN action impacts innate and adaptive immune responses. These cytokines are produced upon infection or in association with damage to a cell [55]. IFN-α1 and α2 were the first two subtypes characterized. IFN-α2 is the prototypic type I IFN subtype used in fundamental research and most clinical applications. Type I IFN signaling alters the balance of cellular lipid requirements by decreasing synthesis and increasing import of cholesterol and long chain fatty acids [56]. We found that IFN-α2 levels increase as triglycerides and VLDL increase, which is consistent with increased import of cholesterol to the liver (Figure 7d and Figure 8d). High glucose in T2D can cause cell damage, which may elicit an increase IFN-α2 to modulate damage. We found that IFN-α2 levels are upregulated 1.5 fold in the presence of circulating high glucose. IFN-α2 is a protective cytokine and we observed a negative correlation with BMI and Bun/Creatinine ratio (Figure 2b and 5c) This data suggests that an increase BMI leads to decreased expression and increased risk of DKD. Metabolic diseases have eminent pro-inflammatory expression and IFN-α2 immunoregulation is lost. BMI is elevated for both groups; however, when paired with increased blood glucose, it elicits a response in IFN-α2.
Fractalkine (CX3CL1), a chemokine that signals through a single known receptor (CX3CR1), is implicated in recruitment and adhesion of both monocytes and T-cells in atherosclerosis [57–59]. CX3CL1 also coordinate inflammatory cell recruitment and localization to the site of inflammation that expanding VAT in obesity and T2D. We found that CX3CL1 levels are upregulated 1.5 fold in the presence of circulating high glucose (Figure 1f), which is confirmed by the positive correlation with HbA1c (Figure 3c). CX3CL1 has previously been reported to play a role in monocyte adhesion to adipocytes, which is associated with obesity, insulin resistance, and T2D [60,61]. Fractalkine signaling and cellular mechanism may link pathophysiologic processes between adipose and vascular tissue [62]. They suggest that CX3CL1 play a role in atherogenesis, which provides a molecular link between obesity-related metabolic dysfunction and CVD. We confirm this finding by uncovering a positive correlation with CX3CL1 and VLDL and triglycerides, which is consistent with previous reports of CVD (Figure 7c and Figure 8c).
In the present study, we examined the global effect of circulating high glucose on aerum cytokines levels in obese, African American women. In previous research, elevated levels of pro-inflammatory cytokines have been reported in young obese, African American women with prediabetes [63]. Our results suggest that as obese African American women age and their HbA1c increases, the quantity of circulating serum cytokine increases approximately 3–8 fold. These studies may highlight the role of pro-inflammatory cytokines in the progression of T2D. Although cytokine expression and production is not unique to individuals with T2D, we show that African American women express a unique population of cytokines and higher levels of basal expression [28–30]. Our study is also consistent with differences in the metabolic capabilities of subcutaneous and visceral fat. It has been previously shown that 25–30% of obese individuals do not develop insulin resistance, which are considered the “healthy obese” population [9]. It appears that our control group may be made up of healthy obese participants with more subcutaneous fat than visceral fat. Proficient subcutaneous fat expansion may improve the processing of excess calorie intake. This may be a result of intrinsic genetic characteristics and/or a reduced inflammatory response, with limited triglyceride overflow into the visceral fat depots [9].
Our correlative data also supports IL-3, IL-4, and IL-7 as possible new markers for metabolic inflammation in obese African American women with T2D. We also were able to confirm previously reported inflammatory markers such as TNF-α, IFN-α2 and CX3CL1. This study begins to explore the possibilities of interleukins in T2D and potential a useful marker in T2D. Cohen et al (64) highlights the importance of personalized medicine for racially different subgroups of people. This racial difference in Hba1c has lead to African Americans being inadequately treated or harmed because of the criteria for the threshold for diabetes diagnosis. We need additional biomarkers in addition to HbA1c and glucose serum to aid in diabetes diagnosis. We believe that IL-3, IL-4 and IL-7 will strengthen racial dispersion in in the HbA1c-glucose serum relationship. With the addition of newly developed of technologies, the treatment of T2D with a new approach to address additional cytokines could offer a new area of treatment. In the future we intend to conduct studies involving larger multi-racial groups to validate these preliminary findings. In the future, we plan to confirm our findings and elucidate the role of IL-3, IL-4 and IL-7 in T2D in vitro and in vivo.
Limitations
We acknowledge that our participants may be on medication such as insulin and blood pressure prescriptions. We believe given the design and case-matched approach to this study, reduces the impact of medication use. In addition, there are 14 people who identified as diabetic who had HBA1c lower than 6.4 and 2 participants that identified as non-diabetic that had HbA1c above 7.0. The pinnacle of this research is not diabetic status. This research is addressing the relationship between current circulating glucose serum and current serum cytokine levels. We have separated the groups based on HbA1c and glucose serum. We are confident that our segregation parameters and our case-matched approach will effectively answer our research question.
Supplementary Material
Acknowledgements
Thank you Laboratory Corporation of America for performing serum panel assessment.
Funding
KSK and NG were supported by the National Institutes of Health [P20MD00175; U54MD012392] grants.
Footnotes
Publisher's Disclaimer: This is a PDF file of an unedited manuscript that has been accepted for publication. As a service to our customers we are providing this early version of the manuscript. The manuscript will undergo copyediting, typesetting, and review of the resulting proof before it is published in its final form. Please note that during the production process errors may be discovered which could affect the content, and all legal disclaimers that apply to the journal pertain.
Conflict of Interest
The authors declare that they have no conflict of interest.
Availability of data and material
Please contact author for data requests.
References
- 1.Bhupathiraju S. and Hu F. (2016) Epidemiology of obesity and diabetes and their cardiovascular complications. Circ Res. 118:1723–1735. [DOI] [PMC free article] [PubMed] [Google Scholar]
- 2.Wang Y, Beydoun MA, Liang L, Caballero B, Kumanyika SK. (2008). Will all Americans become overweight or obese? estimating the progression and cost of the US obesity epidemic. Obesity (Silver Spring); 16:2323–2330. [DOI] [PubMed] [Google Scholar]
- 3.Ogden CL, Carroll MD, Kit BK, Flegal KM. (2014). Prevalence of childhood and adult obesity in the United States, 2011–2012. JAMA.;311:806–814. [DOI] [PMC free article] [PubMed] [Google Scholar]
- 4.An R. Prevalence and trends of adult obesity in the US, 1999–2012. (2014). ISRN Obes.;2014:185132. [DOI] [PMC free article] [PubMed] [Google Scholar]
- 5.Boyle JP, Thompson TJ, Gregg EW, Barker LE, Williamson DF. (2010). Projection of the year 2050 burden of diabetes in the US adult population: dynamic modeling of incidence, mortality, and prediabetes prevalence. Popul Health Metr.;8:29. [DOI] [PMC free article] [PubMed] [Google Scholar]
- 6.Dall TM, Yang W, Halder P, Pang B, Massoudi M, Wintfeld N, Semilla AP, Franz J, Hogan PF. (2014). The economic burden of elevated blood glucose levels in 2012: diagnosed and undiagnosed diabetes, gestational diabetes mellitus, and prediabetes. Diabetes Care 37:3172–3179. [DOI] [PubMed] [Google Scholar]
- 7.Jung U and Choi M (2014). Obesity and its metabolic complications: the role of adipokines and the relationship between obesity, inflammation, insulin resistance, dyslipidemia and nonalcoholic fatty liver disease. Int. J. Sci 15:6184–6223. [DOI] [PMC free article] [PubMed] [Google Scholar]
- 8.Van Greevenbroek M, Schalkwijk C, Stehouwer C (2013). Obesity-associated low grade inflammation in types diabtes mellitus: causes and consequences. Neth J Med 74(4):174–87. [PubMed] [Google Scholar]
- 9.Speliotes EK, Massaro JM, Hoffmann U,Vasan RS, Meigs JB, Sahani DV, Hirschhorn JN, O’Donnell CJ, Fox CS. (2010). Fatty liver is associated with dyslipidemia and dysglycemia independent of visceral fat: the Framingham Heart Study. Hepatology; 51:1979–87. [DOI] [PMC free article] [PubMed] [Google Scholar]
- 10.Fried SK, Bunkin DA, Greenberg AS. (1998). Omental and subcutaneous adipose tissues of obese subjects release interleukin-6: depot difference and regulation by glucocorticoid. J Clin Endocrinol Metab; 83:847–50. [DOI] [PubMed] [Google Scholar]
- 11.Donath MY, Schumann DM, Faulenbach M, Ellingsgaard H, Perren A, Ehses JA. (2008). Islet inflammation in type 2 diabetes. Diabetes care.; 31: S161–S164. [DOI] [PubMed] [Google Scholar]
- 12.Esser N, Legrand-Poels S, Piette J, Scheen AJ, Paquot N. (2014). Inflammation as a link between obesity, metabolic syndrome and type 2 diabetes. Diabetes Res Clin Pr; 105:141–150. [DOI] [PubMed] [Google Scholar]
- 13.Robinson M, Harmon C, O’Farrelly C (2016). Liver immunology and its role in inflammation and homeostasis. Cellular and Molecular Immunology 13:267–276. [DOI] [PMC free article] [PubMed] [Google Scholar]
- 14.Garcia-Garcia P, Getino-Melian M, Dominguez-Pimentel V, Navarro-Gonzalez J (2014). Inflammation in diabetic kidney diease. World J Diabetes 5(4): 431–443. [DOI] [PMC free article] [PubMed] [Google Scholar]
- 15.Navarro JF, Mora C. Role of inflammation in diabetic complications. (2005). Nephrol Dial Transplant; 20: 2601–2604. [DOI] [PubMed] [Google Scholar]
- 16.Mora C, Navarro JF. Inflammation and diabetic nephropathy. (2006). Curr Diab Rep; 6: 463–468. [DOI] [PubMed] [Google Scholar]
- 17.Skundric DS, Lisak RP. (2003). Role of neuropoietic cytokines in development and progression of diabetic polyneuropathy: from glucose metabolism to neurodegeneration. Exp Diabesity Res 4: 303–312. [DOI] [PMC free article] [PubMed] [Google Scholar]
- 18.Jeffcoate WJ, Game F, Cavanagh PR. (2005). The role of proinflammatory cytokines in the cause of neuropathic osteoarthropathy (acute Charcot foot) in diabetes. Lancet; 366: 2058–2061. [DOI] [PubMed] [Google Scholar]
- 19.Mocan MC, Kadayifcilar S, Eldem B. (2006). Elevated intravitreal interleukin-6 levels in patients with proliferative diabetic retinopathy. Can J Ophthalmol; 41: 747–752. [DOI] [PubMed] [Google Scholar]
- 20.Debnam ES, Unwin RJ. (1996). Hyperglycemia and intestinal and renal glucose transport: implications for diabetic renal injury. Kidney Int; 50:1101–1109. [DOI] [PubMed] [Google Scholar]
- 21.Lim AK, Ma FY, Nikolic-Paterson DJ, Kitching AR, Thomas MC, Tesch GH. (2010). Lymphocytes promote albuminuria, but not renal dysfunction or histological damage in a mouse model of diabetic renal injury. Diabetologia 53: 1772–1782. [DOI] [PubMed] [Google Scholar]
- 22.Mensah-Brown EP, Obineche EN, Galadari S, Chandranath E, Shahin A, Ahmed I, Patel SM, Adem A. (2005). Streptozotocin-induced diabetic nephropathy in rats: the role of inflammatory cytokines. Cytokine 31: 180–190. [DOI] [PubMed] [Google Scholar]
- 23.Moon JY, Jeong KH, Lee TW, Ihm CG, Lim SJ, Lee SH. (2012). Aberrant recruitment and activation of T cells in diabetic nephropathy. Am J Nephrol 35: 164–174. [DOI] [PubMed] [Google Scholar]
- 24.Boini KM, Xia M, Abais JM, Li G, Pitzer AL, Gehr TW, Zhang Y, Li PL. (2014). Activation of inflammasomes in podocyte injury of mice on the high fat diet: effects of ASC gene deletion and silencing. Biochim Biophys Acta 1843: 836–845. [DOI] [PMC free article] [PubMed] [Google Scholar]
- 25.Xu J, Su HL, Wang JH, Zhang CH. (2009). Role of CD4CD25Foxp3 regulatory T cells in type 2 diabetic nephropathy. Nan Fang Yi Ke Da Xue Xue Bao 29: 137–139. [PubMed] [Google Scholar]
- 26.Fisman E, Montro M, Tenenbaum A (2003). Cardiovascular diabetology in the core of a novel interleukins classification: the bad, the good, and the aloof. Cardiovascular Diabetology 2:11. [DOI] [PMC free article] [PubMed] [Google Scholar]
- 27.Spranger J, Kroke A, Mohlig M, Hoffmann K, Bergmann M, Ristow M, Boeing H, Pfeiffer A (2003). Inflammatory Cytokines and the risk to develop type 2 diabetes. Diabetes. 52(3) 812–7. [DOI] [PubMed] [Google Scholar]
- 28.Lopez Y, Garufi G, Seyhan A (2017). Altered levels of circulating cytokines and microRNAs in lean and obese individuals with prediabetes and type 2 diabetes. Mol. BioSyst 13:106–121. [DOI] [PubMed] [Google Scholar]
- 29.Saukkonen T, Mutt S, Jokelainen J, Saukkonen A, Raza G, Härkönen P, Eckel J, Herzig, Rajala U, Keinänen-Kiukaanniemi S (2018). Adipokines and inflammatory markers in elderly subjects with high risk of type 2 diabetes and cardiovascular disease. Sci. Rep 8(1):12816. [DOI] [PMC free article] [PubMed] [Google Scholar]
- 30.Ajmera V, Perito E, Bass N, Terrault N, Yates K, Gill R, Loomba R, Diehl A, Aouizerat B (2017). Novel plasma biomarkers associated with liver disease severity in adults with nonalcoholic fatty liver disease. Hepatology 65(1):65–77. [DOI] [PMC free article] [PubMed] [Google Scholar]
- 31.Ito A, Aoyanagi N, Maki T. (1997). Regulation of autoimmune diabetes by interleukin 3-dependent bone marrow-derived cells in NOD mice. J Autoimmun 10:331–338. [DOI] [PubMed] [Google Scholar]
- 32.Weisensee D, Bereiter-Hahn J, Schoeppe W and Low-Friedrich I (1993). Effects of cytokines on the contractility of cultured cardiac myocytes. Int J Immunopharmacol, 15:581–587. [DOI] [PubMed] [Google Scholar]
- 33.Silva-Filho JL, Caruso-Neves C, Pinheiro A (2014). IL-4: and important cytokine in determining the fate of T cells. Biophys Rev 6:111–118 DOI 10.1007/s12551-013-0133-z. [DOI] [PMC free article] [PubMed] [Google Scholar]
- 34.Pinheiro AAS, Morrot A, Chakravarty S, Overstreet M, Bream JH, Irusta PM, Zavala F (2007). IL-4 induces a wide-spectrum intracellular signaling cascade in CD8+ T cells. J Leukoc Biol 4:1102–1110. [DOI] [PubMed] [Google Scholar]
- 35.Nelms K, Keegan AD, Zamorano J, Ryan JJ, Paul WE. (1999). The IL-4 receptor: signaling mechanisms and biologic functions. Annu Rev Immunol 17:701–738 [DOI] [PubMed] [Google Scholar]
- 36.Curfs JH, Meis JF and Hoogkamp-Korstanje JA (1997). A primer on cytokines: sources, receptors, effects, and inducers. Clin Microbiol Rev, 10:742–780. [DOI] [PMC free article] [PubMed] [Google Scholar]
- 37.Schmidt F, Weschenfelder J, Sander C, Minkwitz J, Thormann J, Chittka T, Mergl R, Kirkby K, FaBhauer M, Stumvoll M, Holdt L, Teupser D, Hergerl U, Himmerich H (2015). Inflammatory cytokines in general and central obesity and modulating effects of physical activity. PLoS ONE 10(3): e0121971. [DOI] [PMC free article] [PubMed] [Google Scholar]
- 38.Damas JK, Waehre T, Yndestad A, Otterdal K, Hognestad A, Solum NO, Gullestad L, Froland SS and Aukrust P (2003). Interleukin-7-mediated inflammation in unstable angina: possible role of chemokines and platelets. Circulation, 107:2670–2676. [DOI] [PubMed] [Google Scholar]
- 39.Hsieh P, Liu S, Lee T, Huang J, Yin L, Chang W, Chuang L, Guh J, Hung M, Yang Y (2012) The role of IL-7 in renal proximal tubule epithelial cell fibrosis. Molecular Immunology 50: 74–82. [DOI] [PubMed] [Google Scholar]
- 40.Lucas S, Taront S, Magnan C, Fauconnier L, Delacre M, Macia L, Delanoye A, Verwaerde C, Spriet C, Saule P, Goormachtigh G, Heliot L, Ktorza, Movassat J, Polakowska R, Auriault C, Poulain_Godefroy O, Di Santo J, Froguel P, Wolowczuk I (2012). Inteleukin-7 regulates adipose tissue mass and insulin sensitivity in high fat diet fed mice through lymphocyte-dependent and independent mechanisms. PLoS ONE 7(6): e40351. [DOI] [PMC free article] [PubMed] [Google Scholar]
- 41.Adinolfi LE, Marrone A, Rinaldi L. (2018). Non-alcoholic fatty liver disease: beyond the liver is an emerging muiltfaceted systemic disease. Hepatobiliary Surg Nutr. April; 7(2): 143–146. [DOI] [PMC free article] [PubMed] [Google Scholar]
- 42.Estep M, Abawi M, Jarrar M, Wang L, Stepanova M, Elariny H, Moazez A, Goodman Z, Chandhoke V, Baranova A, Younossi ZM. (2011). Association of obestatin, ghrelin, and inflammatory cytokines in obese patients with non-alocoholic fatty liver disease. Obes Surg. 21(11):1750–7. [DOI] [PubMed] [Google Scholar]
- 43.Ventre J. Doebber T, Wu M, MacMaul K, Stevens K, Pasparakis M, Kollias G, Moller DE. (1997). Targeted disruption of the tumor necrosis factor-a gene: metabolic consequences in obese and non-obese mice. Diabetes 46, 1526–1531. [DOI] [PubMed] [Google Scholar]
- 44.Hotamisligil GS and Spiegelman BM (1994) Tumor necrosis factor a: a key component of the obesity-diabetes link. Diabetes 43, 1271–1278. [DOI] [PubMed] [Google Scholar]
- 45.Uysal KT, Wiesbrock SM, Marino MW, Hotamisligil GS. (1997) Protection from obesity-induced insulin resistance in mice lacking TNF-a function. Nature 389, 610–614 27. [DOI] [PubMed] [Google Scholar]
- 46.Schreyer SA, Chua SC Jr., LeBoeuf RC. (1998) Obesity and diabetes in TNF-a receptor-deficient mice. J. Clin. Invest 102, 402–411. [DOI] [PMC free article] [PubMed] [Google Scholar]
- 47.Cawthorn WP, Sethi JK. (2008). TNF-alpha and adipocyte biology. FEBS Lett; 582: 117–131. [DOI] [PMC free article] [PubMed] [Google Scholar]
- 48.Memon RA, Feingold KR, Moser AH, Fuller J, Grunfeld C. (1998). Regulation of fatty acid transport protein and fatty acid translocase mRNA levels by endotoxin and cytokines. Am. J. Physiol; 274: E210–E217. [DOI] [PubMed] [Google Scholar]
- 49.Chen X, Xun K, Chen L, Wang Y (2009). TNF-alpha, a potent lipid metabolism regulator. Cell Biochem. Funct October;27(7):407–16. [DOI] [PubMed] [Google Scholar]
- 50.Ernandez T. Mayadas T. (2009). Immunoregulatory role of TNF-a in inflammatory kidney disease. Kidney International 76, 262–276. [DOI] [PubMed] [Google Scholar]
- 51.Al-Lamki RS, Wang J, Skepper JN, Thiru S, Pober JS, Bradley JR. (2001). Expression of tumor necrosisfactor receptors in normal kidney and rejecting renal transplants. LabInvest 81: 1503–1515. [DOI] [PubMed] [Google Scholar]
- 52.Aten J, Roos A, Claessen N, Schilder-Tol EJ, Ten Berge IJ, Weening JJ. (2000). Strong and selective glomerular localization of CD134 ligand and TNF receptor-1 in proliferative lupusnephritis. J Am Soc Nephrol; 11:1426–1438. [DOI] [PubMed] [Google Scholar]
- 53.Vielhauer V, Stavrakis G, Mayadas TN. (2005). Renal cell-expressed TNF receptor2, not receptor 1, is essential for the development of glomerulonephritis. J Clin Invest;115: 1199–1209. [DOI] [PMC free article] [PubMed] [Google Scholar]
- 54.Gallant KM, Spiegel DM. (2017). Calcium balance in chronic kidney disease. Curr Osteoporos Rep 15:214–221. [DOI] [PMC free article] [PubMed] [Google Scholar]
- 55.Lee AJ. Ashkar A. (2018). The dual nature of type I and type II interferons. Front. Immunol 9:2061. [DOI] [PMC free article] [PubMed] [Google Scholar]
- 56.York AG, Williams KJ, Argus JP, Zhou QD, Brar G, Vergnes L, Gray EE, Zhen A, Wu NC, Yamada DH, Cunningham CR, Tarling EJ, Wilks MQ, Casero D, Gray DH, Yu AK, Wang ES, Brooks DG, Sun R, Kitchen SG, Wu TT, Reue K, Stetson DB, Bensinger SJ. (2015). Limiting cholesterol biosynthetic flux spontaneously engages type I IFN signaling. Cell. 163(7):1716–29. [DOI] [PMC free article] [PubMed] [Google Scholar]
- 57.Roberts CA, Dickinson AK, Taams LS. (2015). The Interplay Between Monocytes/Macrophages and CD4(+) T Cell Subsets in Rheumatoid Arthritis. Front Immunol.; 6:571. [DOI] [PMC free article] [PubMed] [Google Scholar]
- 58.Hansson GK. (2001). Immune mechanisms in atherosclerosis. Arterioscler Thromb Vasc Biol.;21 (12):1876–90. [DOI] [PubMed] [Google Scholar]
- 59.Menart-Houtermans B, Rutter R, Nowotny B, Rosenbauer J, Koliaki C, Kahl S, Simon MC, Szendroedi J, Schloot NC, Roden M, German Diabetes Study G. (2014). Leukocyte profiles differ between type 1 and type 2 diabetes and are associated with metabolic phenotypes: results from the German Diabetes Study (GDS). Diabetes Care.;37:2326–33. [DOI] [PubMed] [Google Scholar]
- 60.Sindhu S, Akhter N., Arefanian H., Al-Roub A., Ali S., Wilson A., Al-Hubail A., Al-Neloushi S., Al-Zanki, Ahmad R. (2017). Increased circulatory levels of fractalkine (CX3CL1) are associated eith inflammatory chemokines and cytokines in individuals with type 2- diabetes. Journal of Diabetes & Metabolic Disorders 16:15. [DOI] [PMC free article] [PubMed] [Google Scholar]
- 61.Shah R, Hinkle CC, Ferguson JF, Mehta NN, Li M, Qu L, Lu Y, Putt ME, Ahima RS, Reilly MP. (2011). Fractalkine is a novel human adipochemokine associated with type 2 diabetes. Diabetes.;60:1512–8 [DOI] [PMC free article] [PubMed] [Google Scholar]
- 62.Cefalu WT. (2011).Fractalkine: a cellular link between adipose tissue inflammation and vascular pathologies. Diabetes. 60(5): 1380–1382. [DOI] [PMC free article] [PubMed] [Google Scholar]
- 63.Lucas R, Parikh SJ, Sridhar S, Guo D, Bhagatwala J, Dong Y, Caldwell R, Mellor A, Caldwell W, Zhu H, Dong Y. (2013). Cytokine profiling of young overweight and obese female African American adult with prediabetes. Cytokine. 64:310–315. [DOI] [PMC free article] [PubMed] [Google Scholar]
- 64.Cohen RM, Franco RS, Smith EP, Higgins JM. (2019). When HbA1c and blood glucose do not match: How much is determined by race, by genetics, by difference in mean red blood cell age? J Clin Endocrinol Metab. 104(3):707–710. [DOI] [PubMed] [Google Scholar]
Associated Data
This section collects any data citations, data availability statements, or supplementary materials included in this article.


