

Abstract
The Dahl salt-sensitive (SS) rat is an established model of hypertension and renal damage that is accompanied with immune system activation in response to a high salt diet. Investigations into the effects of sodium-independent and -dependent components of the diet were shown to affect the disease phenotype with Dahl SS/JrHsdMcwi (SS/MCW) rats maintained on a purified diet (AIN-76A) presenting with a more severe phenotype relative to grain-fed Dahl SS/JrHsdMcwiCrl rats (SS/CRL). Since contributions of the immune system, environment and diet are documented to alter this phenotype, this present study examined the epigenetic profile of T cells isolated from the periphery and the kidney from these colonies. T cells isolated from kidneys of the two colonies revealed that transcriptomic and functional differences may contribute to the susceptibility of hypertension and renal damage. In response to high salt challenge, the methylome of T cells isolated from the kidney of SS/MCW exhibit a significant increase in differentially methylated regions with a preference for hypermethylation compared to the SS/CRL kidney T cells. Circulating T cells exhibited similar methylation profiles between colonies. Utilizing transcriptomic data from T cells isolated from the same animals upon which the DNA methylation analysis was performed, a predominant negative correlation was observed between gene expression and DNA methylation in all groups. Lastly, inhibition of DNA methyltransferases blunted salt-induced hypertension and renal damage in the SS/MCW rats providing a functional role for methylation. This study demonstrated the influence of epigenetic modifications to immune cell function, highlighting the need for further investigations.
Keywords: hypertension, renal damage, T-cells, methylation, epigenetics
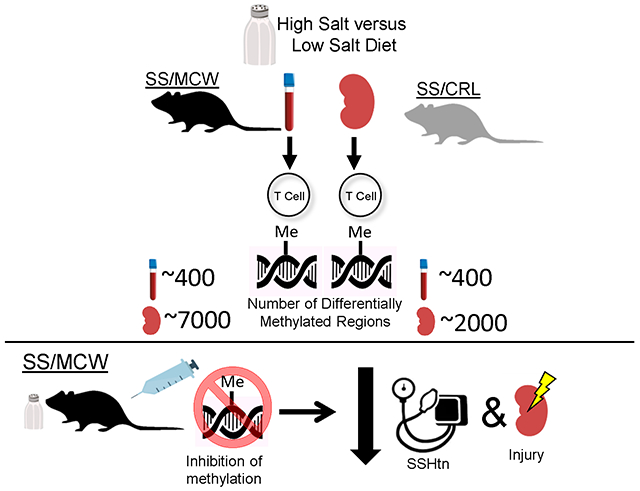
Graphical Abstract
Introduction
Cardiovascular disease continues to be the leading cause of death in the United States with hypertension listed as the largest risk factor for cardiovascular mortality [1, 2]. Based upon the latest blood pressure guidelines released by the American College of Cardiology and the American Heart Association, it is estimated that nearly 1 in every 2 adults in the United States is hypertensive [3]. Additionally, there is a subset of hypertensive individuals that are described as salt sensitive, who exhibit increases in blood pressure in response to increases in dietary sodium intake [4]. The exact mechanisms responsible for this sensitivity to sodium intake are unclear, but environmental and genetic factors are known to play a key role in the development of hypertension.
The Dahl salt-sensitive (SS) rat is a well characterized genetic animal model utilized to investigate the mechanisms in the development of hypertension and related renal damage. Important mechanisms recently demonstrated to be critical in SS hypertension include environmental factors [5, 6] and the immune system [7, 8]. It has been shown that environmental factors, including changes in diet during the gestation and lactation periods can greatly alter the disease phenotype. The Dahl SS rats fed a purified casein-based diet have a more pronounced hypertensive phenotype accompanied by an increase in infiltration of immune cells into the kidneys compared to the Dahl SS rats maintained on a grain-based diet [5]. Additionally, a transcriptomic analysis of T cells isolated from kidneys of Dahl SS rats fed these different diets demonstrated a functional difference in those T cells [8]. These findings suggest that epigenetic modifications are contributing to the differences in gene expression and disease phenotype observed between Dahl SS rats fed different diets.
It is reported that epigenetic modifications, such as in DNA methylation, contribute to the development of cardiovascular disease [9] and hypertension [10, 11]. Epigenetic modifications have also been shown in animal models of hypertension to contribute to the disease process. The Dahl SS rat demonstrates changes in DNA methylation profiles in the outer medulla of kidneys when fed a high salt diet [12, 13]. Given that immunity and epigenetics have been implicated in the development of hypertension, this study investigated the DNA methylation profile in T cells isolated from the circulation and from the kidneys of the Dahl SS rats fed different diets before and after a high salt challenge. DNA methylation was then compared to gene expression determined with an RNA-seq analysis [8]. Lastly, the functional role of methylation in the hypertensive phenotype in the Dahl SS rat was tested via administration of DNA methyltransferase inhibitor, decitabine.
Methods
The authors declare that all supporting data are available within the article and its online supplementary files. Additionally, all raw reduced representation bisulfite sequencing (RRBS) data generated from these studies have been made publicly available in NCBI’s Gene Expression Omnibus [14] and can be accessed through GEO Series accession number GSE132417 (https://www.ncbi.nlm.nih.gov/geo/query/acc.cgi?acc=GSE132417). The raw data for the RNA sequencing data has previously been made publicly available, GSE127000 [8].
Animals and Diet.
As previously described [8], all experiments were performed on age-matched male, inbred Dahl SS rats from two colonies: the inbred colony maintained at the Medical College of Wisconsin, SS/JrHsdMcwi rats (denoted SS/MCW) fed a casein-based diet, and commercially available Dahl SS rats purchased as weanlings (postnatal day 22) from Charles River Laboratory, SS/JrHsdMcwiCrl (denoted SS/CRL) fed a grain-based diet. As previously reported [8], SS/CRL rats are protected from salt-induced hypertension (116 vs 142 mmHg MAP), albuminuria (22 vs 163 mg/day), and renal immune cell infiltration compared to SS/MCW after three weeks of a HS diet. Moreover, the SS/CRL were derived from the SS/MCW colony in 2001 and a comparison of expressed sequences confirmed a high degree of genetic identity between the two colonies with 0.00001% difference at a nucleotide level [6]. Embryo transfer studies have illustrated that the phenotypic differences observed in hypertension and renal damage are independent of these minimal genetic differences. The influence of the diet/environment thus appears to lead to the difference in disease phenotypes. Animals were maintained on their respective parental diet (SS/MCW: 0.4% NaCl AIN-76A Dyets Inc., SS/CRL: 0.75% NaCl Teklad 5L2F) from weaning until 7 weeks of age, when animals were switched to the high salt diet, 4.0% NaCl AIN-76A Dyets Inc., for 3 weeks. Additionally, control animals were maintained on their respective low salt diets throughout the 10-week study. All protocols were approved by the Medical College of Wisconsin Institutional Animal Care and Use Committee.
A detailed description of all other methods can be found in the Online Supplement [15–21].
Results
Robust identification of methylation regions in isolated T cells.
Since these two colonies exhibit distinct phenotypic differences in response to a high salt diet, DNA methylation status was assessed in isolated T cells from blood and kidneys of SS/MCW and SS/CRL rats fed either low or high salt diets at single-base resolution. When comparing the low salt versus high salt, there were similar numbers of methylated regions identified between SS/MCW and SS/CRL in both kidney and blood T cell genomes (Figure 1A). Interestingly, the kidney T cells isolated from rats fed the high salt diet had a significant increase in global methylation rate compared to kidney T cells isolated from low salt fed animals with a greater difference seen in the SS/MCW rats (Figure 1B). In contrast, the global methylation rate of the blood T cells between low and high salt states was not significantly altered in either colony (Figure 1C). These results highlighted that significant increases in global methylation rates are specific to the infiltrating kidney T cells while there is no effect of high salt on methylation rate of blood T cells. Additionally, there was a greater increase in global methylation rate in the SS/MCW kidney T cells when compared to the SS/CRL kidney T cells.
Figure 1. RRBS analysis identifies an increase in methylation rate in kidney T cells but not in blood T cells in response to a high salt diet.
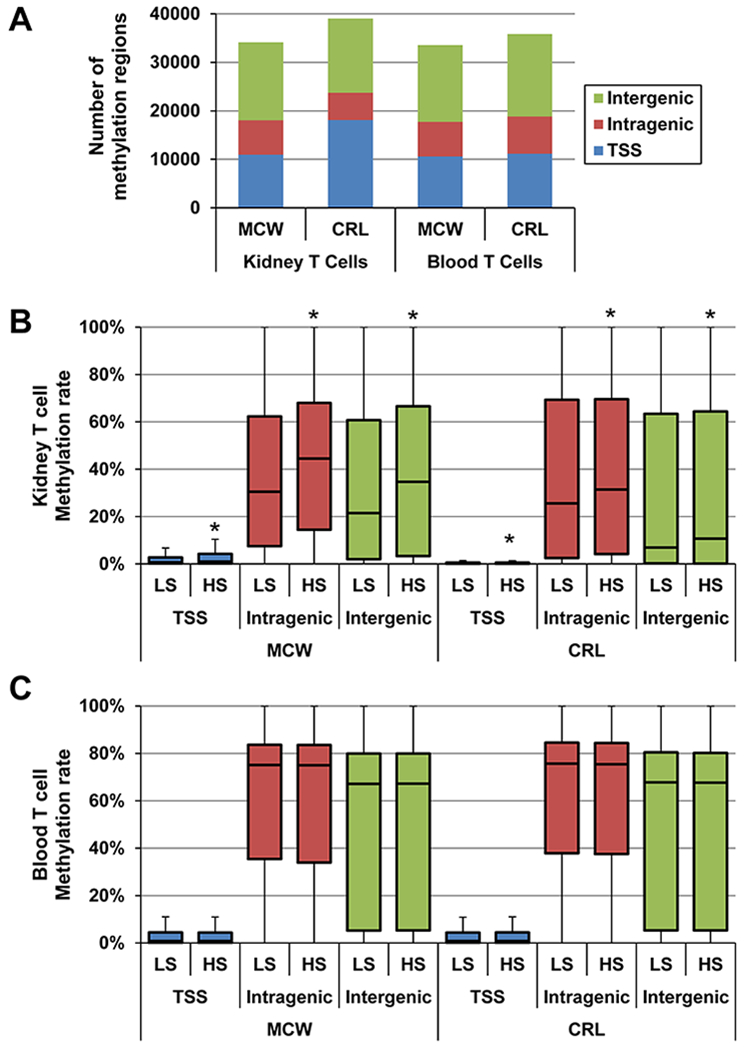
(A) Total number of identified methylation regions following RRBS analysis of isolated T cells from blood and kidney of SS/MCW and SS/CRL rats separated by genomic location. (B) Kidney and (C) Blood T cells methylation rate of all methylation regions on low salt (LS) or high salt (HS) diet separated by genomic location. *p<0.05 vs LS. TSS=Transcription Start Site
SS/MCW kidney T cells have a greater hypermethylation of differentially methylated regions in response to high salt diet than SS/CRL rats.
Utilizing the same data set illustrated in Figure 1, we applied the previously mentioned criteria to identify differentially methylated regions (DMRs) in both kidney and blood T cells when comparing HS versus LS (Figure 2A). There was a significantly greater number of DMRs in the SS/MCW kidney T cells compared to the SS/CRL rats in response to a high salt diet (~6,000 vs ~2,000 DMRs, p<0.05). Interestingly, in comparison to the number of DMRs identified from kidney T cells, there were considerably fewer DMRs in response to a high salt diet in the blood T cell genome in both colonies of rats. Moreover, the number of DMRs in the blood T cells were similar between the SS/MCW and SS/CRL rats with no significant difference observed (~400 DMRs in both colonies). From the number of DMRs, we determined whether a region was either hyper- or hypomethylated and plotted the number of regions against the absolute methylation difference between high and low salt. While the number of DMRs in the kidney T cells in both colonies were predominantly hypermethylated, using a chi-square test there was a significantly greater proportion of hypermethylated regions in the kidney T cells of SS/MCW compared to the SS/CRL at each absolute methylation difference (Figure 2B). This interesting finding was specific to the T cell of the kidney because investigations into the methylation differences of the blood T cells revealed no significant differences between the SS/MCW and SS/CRL DMRs (Figure 2C). Additionally, the blood T cells did not demonstrate a tendency for hypermethylation that was observed in the kidney T cells of both colonies. The two colonies exhibited similar methylation patterns in the blood T cells at each methylation difference. The complete list of the DMRs is provided in Supplemental File S4.
Figure 2. SS/MCW kidney T cells have greater hypermethylation in response to high salt diet than SS/CRL while there was no difference in blood T cells.
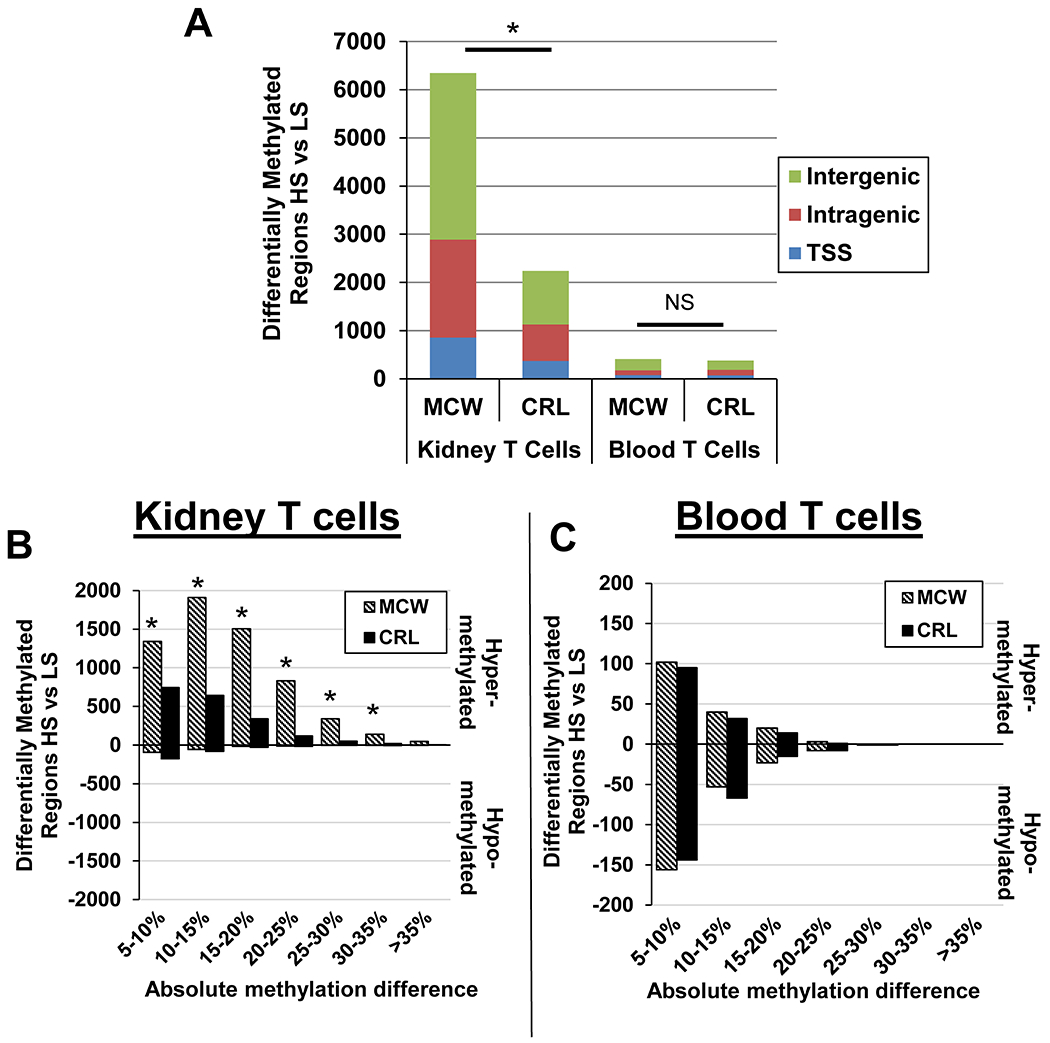
(A) There were significantly more DMRs in the SS/MCW kidney T cells compared to SS/CRL kidney T cells while there were comparable number of DMRs identified in the blood T cells between colonies. (B) Additionally, the DMRs in the kidney T cells were primarily hypermethylated in both colonies with a greater number of DMRs in the SS/MCW colony at each range of absolute methylation difference. (C) There were no significant differences observed in the methylation status between the blood T cell DMRs between the two colonies. *p<0.05 vs SS/CRL.
Greater differential methylation between SS/MCW and SS/CRL is observed in T cells isolated from the kidney than in T cells from the blood of rats fed high salt.
Additional direct comparisons were made between kidney and blood T cells of SS/MCW and SS/CRL on both the LS and HS diets (Supplemental Figure S1). Examining all the methylation regions at LS showed significantly lower global methylation rates of kidney T cells in SS/MCW than SS/CRL (Supplemental Figure S1A). Moreover, there were ~1,000 DMRs observed in the kidney and blood T cells when comparing SS/MCW versus SS/CRL rats on a LS diet (Supplemental Figure S1B). There was no specific pattern for hyper- or hypomethylation of the DMRs in either kidney or blood T cells comparing the two colonies while fed on a LS diet (Supplemental Figure S1C). However, examination into the HS comparison demonstrated a higher methylation rate in SS/MCW kidney T cells versus SS/CRL kidney T cells at HS while there was no difference observed in the blood T cells (Supplemental Figure S1D). The number of DMRs were significantly greater in the kidney T cells (~3,200) compared to blood T cells (~1,000) in the SS/MCW to SS/CRL comparison on HS (Supplemental Figure S1E). Lastly, there was a significantly greater number of DMRs that were hypermethylated in the kidney T cells than in the blood T cells while on HS (Supplemental Figure S1F). These data are consistent with the comparison of LS versus HS shown in Figure 2.
Significant overlap between differential gene expression and methylation in T cells isolated from the same group of SS/MCW and SS/CRL rats.
Since DMRs often play an important role in regulation of gene transcription, a combined RNA-seq and RRBS analysis was performed comparing blood and kidney T cells within each of animal to investigate the relationship between expression and methylation in SS/MCW and SS/CRL rats. A diagram of the approach taken is shown in Supplemental Figure S2. In order to discover which genes were being differentially methylated in these groups, the number of DMRs across the genome comparing kidney versus blood T cells among the four groups was first identified (Figure 3A). Next, the number of genes that had at least one DMR in the TSS region when comparing kidney to blood T cells was totaled. Across the four groups of animals, there were comparable numbers of genes (~2000 genes) that had at least one DMR in the TSS region (Figure 3B). This list of genes was then compared to the genes identified as having differential expression using the RNA-seq data that we previously described (RNA-seq) (Figure 3C). Using a fisher’s exact test, there was a significant overlap between those lists of genes in all 4 groups (~700 genes, p<0.001). Upon identifying the genes that were both significantly differentially expressed and methylated, these genes were plotted based on change in expression and methylation to better understand the relationship (Figure 4A). This analysis revealed the association between methylation difference and expression difference in those genes which demonstrated a greater number of negatively correlated genes than positively correlated genes in all groups (p<0.001). The complete list of the genes is provided in Supplemental File S5. To examine the biological functions of these genes, an Ingenuity Pathway Analysis (IPA) was performed on all the genes. The top ten altered canonical pathways were identified based upon their activation z scores shown in the heat map in Figure 4B. In addition to the canonical pathways, we also utilized the “Upstream Regulators” module which allowed us to identify upstream regulators and their predicted activated status (Figure 4C). The top upstream regulator identified was decitabine which is a known inhibitor of the DNA methyltransferase enzymes. Based upon these data, further experiments were performed to assess the influence of decitabine on salt-induced hypertension in SS/MCW. The complete list of pathways and upstream regulators is provided in Supplemental File S6.
Figure 3. Significant overlap between differential gene expression and differential methylation status in T cells isolated from the same group of SS/MCW and SS/CRL rats.
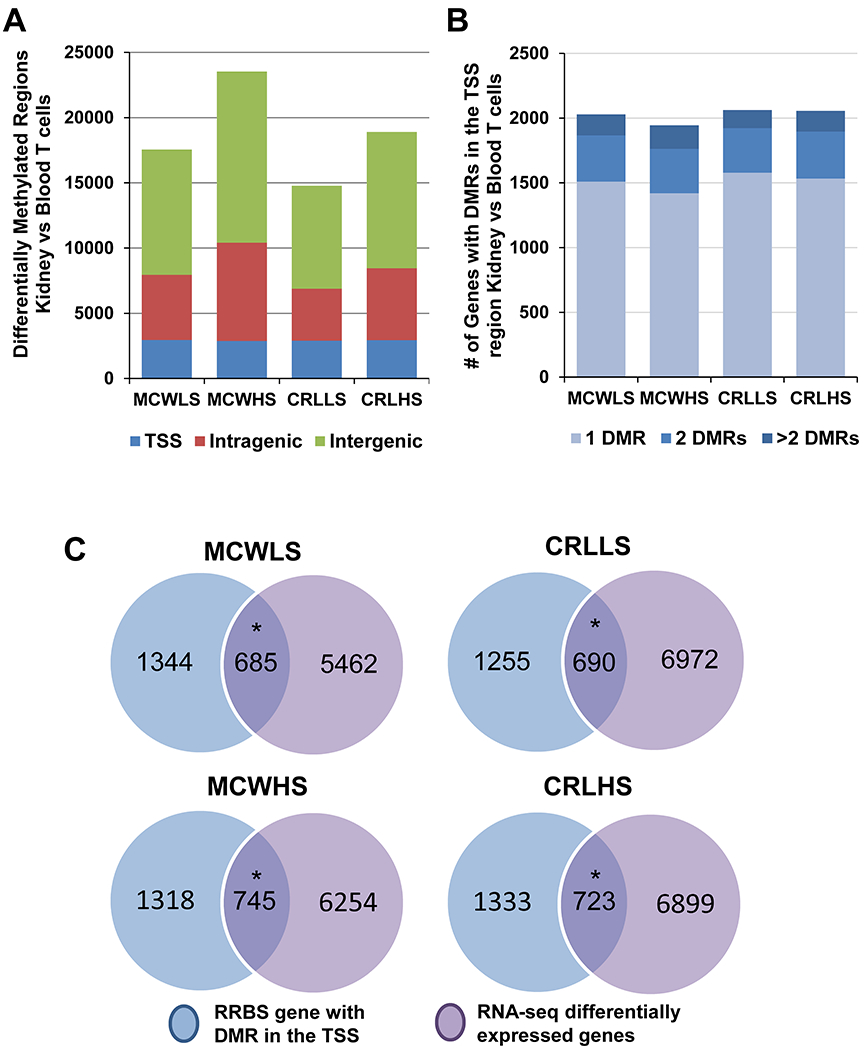
(A) The number of differentially methylated regions (DMRs) amongst SS/MCW and SS/CRL on both low salt (LS) and high salt (HS) diets when comparing kidney versus blood T cells. (B) The number of genes with DMRs specifically in the transcription start site (TSS). (C) Venn diagrams showing the number of genes that exhibit both significant differences in expression as well as significant changes in methylation at the TSS comparing both blood and kidney T cells. *p<0.001 significant degree of overlap between the genes from the RNA-seq and RRBS data.
Figure 4. Combined analysis of RNA-seq and RRBS data demonstrates a predominantly negative relationship between methylation and expression.
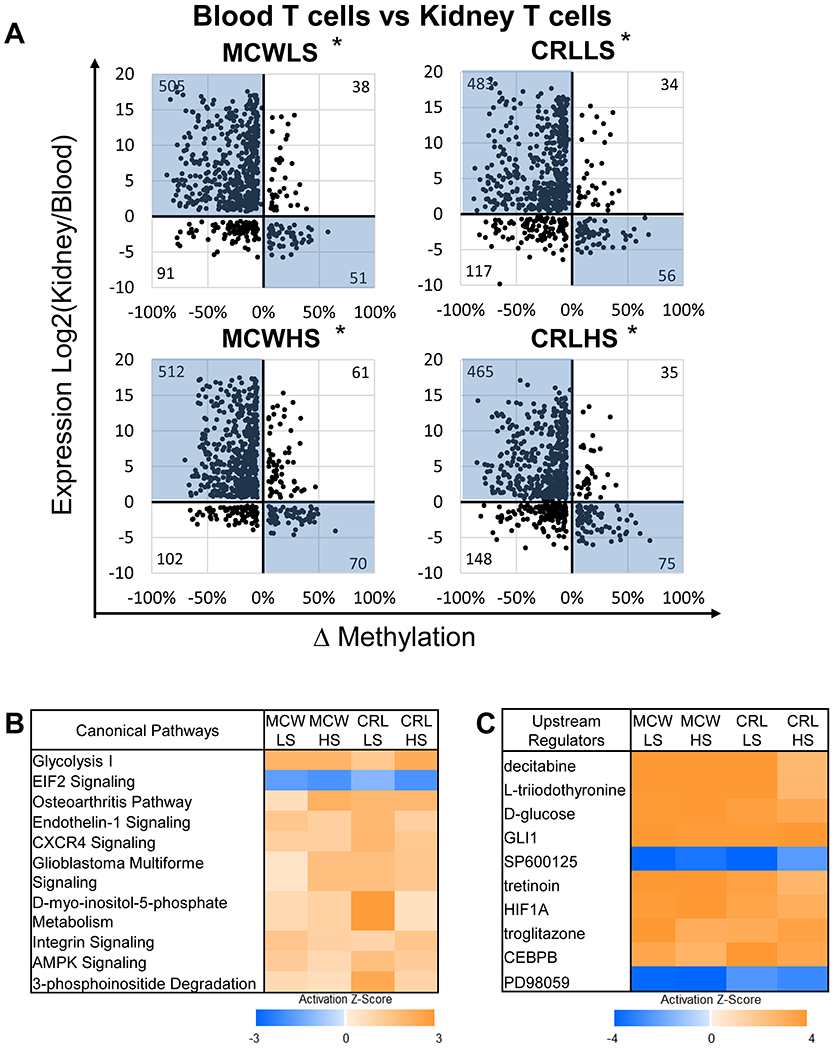
(A) Scatter plots of genes which had significant differential methylation and expression to identify those with negative relationship between methylation and expression (highlighted in blue) or positive relationship when comparing blood versus kidney T cells within each group. (B) Utilizing IPA, we analyzed those genes and identified the top canonical pathways that were significantly overrepresented. (C) The top upstream regulators that are predicted to be activated or inhibited. *p<0.001 significant difference in the number of genes that have positive correlation between methylation and expression versus those which have a negative correlation.
Decitabine administration attenuated the salt-sensitive hypertension and renal damage phenotype in Dahl SS rats.
In order to investigate a functional role of methylation in development of hypertension and renal disease in the SS/MCW rat, decitabine was administered to reduce newly synthesized methylation from occurring. Prior to any treatment, there was no difference in mean arterial pressure (MAP) between the two groups during the 0.4% NaCl (LS) time period (Figure 5A). Upon switching to 4.0% NaCl diet (HS), the vehicle treated animals exhibited a significant increase in MAP compared to the LS baseline that persisted throughout the HS challenge. This increase in MAP was delayed in the decitabine treated rats until HS day 9 when it reached statistical significance compared to baseline MAP. Additionally, MAP was significantly elevated in the vehicle group compared to decitabine group starting at HS day 8 through the remaining HS period (HS 14: 163±7 vs. 141±4 mmHg, p<0.001). Albuminuria and proteinuria, markers of renal damage, were comparable between the two groups during LS; however, following the HS diet, there was a similar pattern in both albuminuria (HS14: 182.1±23.6 vs. 119.1±18.6 mg/day, p<0.01) and proteinuria (HS14: 322.0±41.8 vs. 221.7±28.6 mg/day, p<0.01) as there was in the MAP (Figure 5B and 5C). These results are the same when albumin is normalized to creatinine (Baseline: 2.98±0.45 vs. 1.41±0.31, p>0.05, HS14: 15.66±2.25 vs. 8.21±1.66, p<0.01, vehicle vs. decitabine, respectively). The protection that decitabine treatment provides is specific to the high salt diet. Low salt controls receiving vehicle or decitabine treatment exhibited comparable baseline measurements (MAP: 120±2 vs. 121±1 mmHg, albuminuria: 13.5±1.4 vs. 16.1±2.5 mg/day, proteinuria: 45.4±3.2 vs. 55.4±4.6 mg/day, p>0.05, vehicle vs. decitabine, respectively). Moreover, decitabine treatment had no effect in animals maintained on a low salt diet since these parameters were not statistically changed throughout the duration of the experiment (Day 14: MAP: 126±1 vs. 127±1 mmHg, albuminuria: 33.5±7.2 vs. 38.3±9.6 mg/day, proteinuria: 72.5±11.6 vs. 79.0±9.5 mg/day, p>0.05, vehicle vs. decitabine, respectively). Histological analysis of the right kidney revealed a significantly greater percentage of outer medullary protein casting in the vehicle controls relative to decitabine-treated animals (10.6±1.3 vs. 6.9±1.0%, p<0.05) (Figure 5D). Similarly, glomerular injury was improved in the decitabine-treated animals compared to the vehicle group quantification (Figure 5D). Lastly, we confirmed that decitabine administration reduced the percentage of methylation in circulating T-cells compared to vehicle-treated animals (Figure 5E).
Figure 5. Inhibition of methylation via decitabine administration attenuated salt-induced hypertension and renal damage.
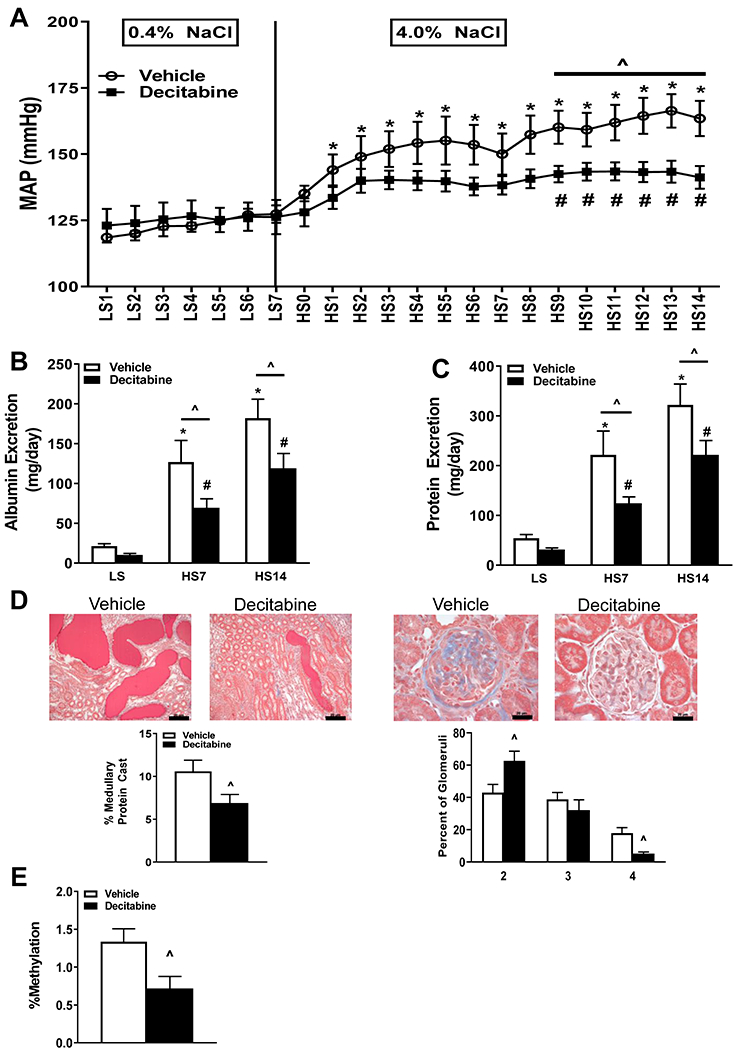
(A) Daily mean arterial pressure (MAP) (B) Albumin excretion and (C) protein excretion were significantly lower in the decitabine treated rats during the high salt challenge relative to vehicle treated animals. (D) Decitabine treatment reduced the percentage of medullary tubular protein casts and improved glomerular damage in the kidney compared to control. (E) Decitabine administration significantly reduced percentage of methylation in circulating T cells compared to vehicle treated. *p<0.05 vs Vehicle LS, #p<0.05 vs Decitabine LS, ^p<0.05 vs Vehicle. n=9-11/ group.
Infiltrating renal immune cells were reduced following decitabine treatment in the Dahl SS rat.
Performing flow cytometry on immune cells isolated from the left kidney revealed there were significantly fewer leukocytes (CD45+) infiltrating the kidneys of the decitabine-treated rats than controls (Figure 6A). This reduction was also observed in the number of CD11b/c+ monocytes and macrophages (Figure 6B) and CD45R+ B-cells (Figure 6D); however, CD3+ T cells did not differ between the two experimental groups (Figure 6C). The immune cell profile was also studied in the circulating immune cells which is shown in Supplemental Figure S3 demonstrating less of an effect on the levels of circulating cells.
Figure 6. Renal immune cell profile following decitabine administration in Dahl SS rats.
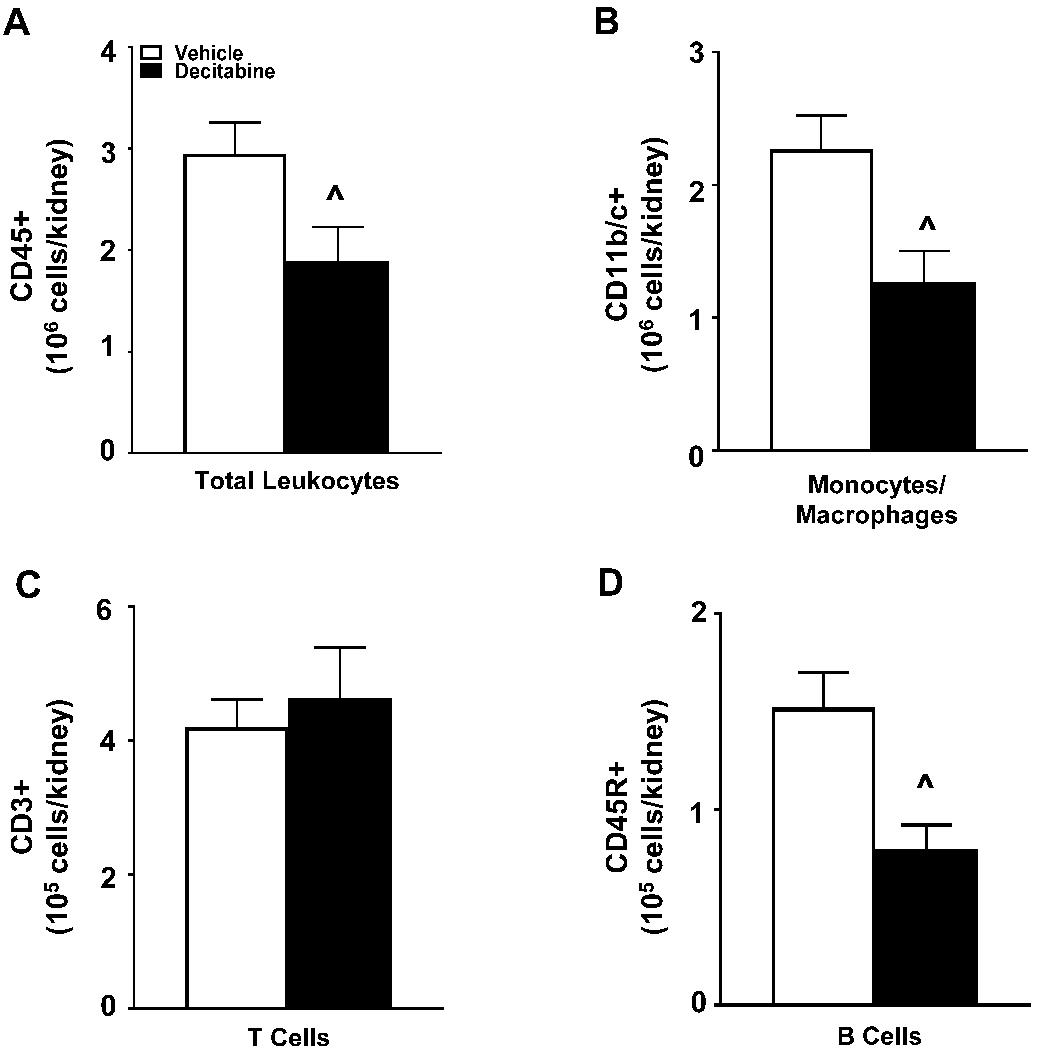
(A) Infiltrating leukocytes into the kidney (CD45+). (B) Infiltrating monocytes and macrophages into the kidney (CD11b/c+). (C) Infiltrating T cells into the kidney (CD3+ T cells) (D) Infiltrating B cells into the kidney (CD45R+ B cells). ^p<0.05 vs Vehicle. n=9-11/ group.
Discussion
Epigenetics play a critical role in the development of hypertension and renal disease in both humans as well as animal models [11–13, 22–24]. In particular, DNA methylation has been highly studied as a mechanism by which gene expression is altered in response to an environmental stimulus. It has been demonstrated that the methylome of the renal outer medulla of the Dahl SS rat is significantly changed in response to a high salt diet [12]. That study provided proof of principle that methylation is contributing to the disease phenotype in the Dahl SS; however, the tissue samples were not a homogenous population since the kidney has many different cell types. Taking into account the role of the T cell in the amplification of the disease process [8, 25] we sought to thoroughly evaluate the methylation profile of the infiltrating kidney T cells and the circulating blood T cells in Dahl SS rats.
We report that the kidney T cells demonstrate a unique hypermethylation profile in response to a high salt challenge. The methylome analysis revealed a greater number of DMRs in the T cell genome of SS/MCW rats on a high salt diet relative to SS/CRL rats. Furthermore, the DMRs in the SS/MCW rats had a greater hypermethylation compared to the SS/CRL. While we can speculate that the colony- and tissue-specific hypermethylation that occurs in the kidney T cells of SS/MCW could be initiated by the exposure to a high salt diet, it is plausible that pressure in the hypertensive kidney could contribute to this differential methylation. Evans et al. demonstrated that elevated renal perfusion pressure was sufficient to drive immune cells into the kidney of Dahl SS rats [26]. When servo-controlling perfusion pressure to the left kidney, this reduced pressure was associated with a reduction in infiltrating immune cells relative to the contralateral kidney exposed to high-salt induced hypertension. While these experiments were not performed for this study, we cannot rule out any potential contributions of increased renal perfusion pressure or related tissue damage has on methylation status.
Epigenetic modifications also play a principal role in the regulation of the immune system through development, activation and function of each cell type [27, 28]. DNA methylation in the T cell can affect gene expression of the transcriptional network which can modify the T cell’s capacity to further differentiate and function [29]. Due to the isolation of T cells via OX52 antigen, we are unable to differentiate which T cell subset(s) exhibit these methylation changes in response to a high salt diet. Investigation into the relationship between gene expression and DNA methylation status of the T cell could give us some indication the cells types exhibiting changes in function due to methylation. The RNA-seq data showed upregulation of interferon-γ and TNF-α in SS/MCW kidney T cells in response to a high salt diet that would suggest that some of these T cells are of the T helper lineage; however, we cannot be certain.
This analysis revealed a significant number of genes that had both differential methylation and expression with a significant inverse correlation between them. One collection of genes of interest where this inverse relationship held true are genes related to redox regulation: Nox4, Cybb (Nox2) and Ncf2. These genes have been implicated in the pathogenesis of salt-sensitivity in the Dahl SS rat [30, 31]. It is logical to reason that regulation, via DNA methylation, of these genes could be playing a role in the disease phenotype of Dahl SS rats. Yet, there are some genes that did not follow the inverse relationship between methylation and expression when examining blood versus kidney T cells in any of the comparisons. Two genes of interest that strayed from this relationship are Socs3 and Kdm2a. Socs3, which was upregulated in the T cells in the kidney, is important in the differentiation of naïve T cells into Tregs through the negative regulation of IL-23 [32], which in our data exhibited a positive relationship between methylation and expression. With an upregulation of Socs3 in the kidney T cells, it is conceivable that the T cells in the kidney are not of the Treg lineage since these animals exhibit hypertension and renal damage. Conversely from Socs3, Kdm2a gene expression and methylation exhibited a downregulation in our dataset. Kdm2a encodes for lysine demethylase that removes methyl groups from specific histone lysine residues that can alter enzymatic activity of DNMT enzymes [33]. While the inverse relationship between DNA methylation and gene expression predominated in circulating versus kidney T cells (Figure 4A), it is important to note that other comparisons did not exhibit this straightforward inverse relationship between DNA methylation and RNA expression. These observations indicate that factors other than DNA methylation are likely influencing gene expression to the same or greater extent.
Our results suggest that increases in dietary sodium alter methylation status in T cells in a colony- and tissue-specific manner, but the exact mechanisms responsible for these changes are unclear. Examination of the RNA-seq data for the gene expression of methylation machinery revealed a down regulation of TET enzymes, which are responsible for reversal of DNA methylation, in T cells isolated from the kidney when compared to those in the circulation. Surprisingly, gene expression for the DNMT enzymes was also downregulated in the kidney T cells relative to circulating T cells; however, it is possible that if we isolated T cells when the high salt diet was first introduced we could have observed differential expression since we detected global hypermethylation in T cells isolated from the kidney.
There are many other mechanisms which regulate gene expression in disease; for instance, both histone modifications and small RNAs have been shown to contribute to the development of hypertension [10]. In the comparison of T cells isolated from the circulation and the kidney, there was a general downregulation of genes associated with histone acetyltransferase, histone lysine demethyltransferase and histone lysine acetyltransferase enzymes amongst all the groups. Yet, there were 3 genes classified as histone deacetylases that were upregulated in this comparison: HDAC11, Sirt3 and Sirt5. Each of these genes has been implicated in the regulation of either immune cells [34] or reactive oxygen species [35] in cardiovascular disease and hypertension. Taking these observations together demonstrate how gene expression regulation can be attributed to multiple epigenetic modifications.
With the IPA analysis of methylation indicating that decitabine was the top potential upstream regulator of gene expression from the isolated kidney T cells, we wanted to test the functional role of DNA methylation in the salt-sensitive phenotype observed in Dahl SS rats. Decitabine is a demethylating agent that is generally prescribed to treat hematological malignancies [36] with the most common adverse effects of administration being myelosuppression [37]. A meta-analysis of hypomethylating agents (HMAs) administration to individuals with myelodysplastic syndromes or acute myeloid leukemia concluded that use of HMAs are associated with an increased risk of neutropenia and thrombocytopenia relative to placebo-treated subjects. In the context of this study, rats treated with decitabine demonstrated blunted hypertensive and renal damage phenotypes relative to the vehicle-treated controls without exhibiting any obvious side effects (Supplemental Figure S7). Also, this inhibition of methylation caused a reduction in infiltration of total CD45+ leukocytes as well as CD11b/c+ macrophages and CD45R+ B cells into the kidneys of the decitabine-treated animals. Our laboratory has previously demonstrated the contribution of macrophages and lymphocytes to salt-sensitive hypertension and renal disease in the Dahl SS rat [38, 39] so the reduction in both macrophages and B cells could also add to the protection observed in the decitabine-treated rats. While the number of infiltrating T cells into the kidney did not differ between these two experimental groups, a limitation of this study was that functional tests of these T cells were not performed. Future studies in this area will focus on the functional changes associated with treatment of a demethylating agent.
Since there is a very small genetic difference between SS/MCW and SS/CRL [6], it is possible that these changes in methylation could be attributed to this minor difference. However, previous data from our group demonstrated that SS/MCW rats fed a grain-based diet also exhibited an attenuation in salt-induced hypertension and renal disease [40]. Methylation status was not measured in the T cells in that study, but we would anticipate methylation to differ from the SS/MCW rats maintained on the casein-based diet. In the future, to help discern the effects of strain- or diet-related differential methylation, the two diets of these colonies could be switched to help separate out any confounding results with respect to T cell methylomes.
Our study demonstrated that there are profound alterations in T cell methylomes in a colony- and tissue-specific manner, and we believe these epigenetic modifications are one part of the bigger picture contributing to the predisposition of salt-sensitive hypertension and renal damage. Our current overall working hypothesis is that both sodium-dependent and –independent components of the diet lead to release of metabolites via the gut microbiota [41], which could result in changes in methylation status and gene expression of T cells to potentiate the salt-sensitive phenotype [8]. Future studies will focus on understanding mechanisms leading to changes in DNA methylation and the impact of such changes on gene expression and cell function in the development of salt-sensitive hypertension and renal disease.
Perspectives
These data demonstrate T cell epigenomes can be influenced by environmental factors such as diets, and these alterations can impact the severity of salt-induced hypertension and renal damage. By isolating a single cell type, these findings highlight the changes in methylation status between infiltrating and circulating T cells as well as the impact of sodium-dependent and –independent components of diet on epigenetic modifications. Through administration of methylation modifiers, the salt-induced hypertension and renal damage in the Dahl SS rat was attenuated, which demonstrates the potential of targeting methylation as a therapeutic option.
Supplementary Material
Novelty and Significance.
- What Is New-
- Hypermethylation of differentially methylated regions was specific to the infiltrating kidney T cells rather than circulating T cells of disease prone SS/MCW rats fed a purified high salt diet compared to grain-fed SS/CRL rats.
- Chronic inhibition of DNA methyltransferase via administration of decitabine demonstrated a functional role of methylation in the blunting of the salt-induced hypertension and renal damage phenotype in the SS/MCW rat.
What Is Relevant- Utilizing a pre-clinical model of salt-sensitive hypertension and renal damage that has been shown to influenced by environmental factors, these studies provide a new understanding for epigenetic modifications that occur in compartment specific T cells and how methylation can be altered to improve the hypertensive phenotype.
Summary- Environmental factors such as diet altered the degree of methylation of T cells from Dahl SS rats in a compartment specific manner with kidney T cell genome exhibiting a greater degree of hypermethylation than circulating T cells. By inhibiting methylation, the salt-sensitive phenotype was blunted in the SS/MCW rats.
Acknowledgments
Sources of Funding This work was supported by HL116264, HL137748, DK62803, AHA-15SFRN2391002, and 18POST33990140.
Footnotes
Disclosure
J.H.D. and D.L.M. designed the study; J.H.D., J.M.A., A.J.A., D.J.F., and H.L. performed all animal experiments; J.M.A., D.J.F., and M.L.R. prepared all cells for RNA sequencing and DNA methylation; J.H.D., A.J.A., X.P., J.M.A., and P.L. analyzed the data; J.H.D. and A.J.A. prepared the figures; J.H.D. wrote the manuscript; A.W.C. Jr, S.K., T.A.K, M.L., and D.L.M. directed the project. All authors critically reviewed and approved the final version of the manuscript.
Conflicts of Interest
None.
References
- 1.Collaboration, G.B.o.C.D., The Burden of Cardiovascular Diseases Among US States, 1990-2016 The Burden of Cardiovascular Diseases Among US States, 1990-2016The Burden of Cardiovascular Diseases Among US States, 1990-2016 JAMA Cardiology, 2018. 3(5): p. 375–389. [DOI] [PMC free article] [PubMed] [Google Scholar]
- 2.Yano Y, et al. , Association of Blood Pressure Classification in Young Adults Using the 2017 American College of Cardiology/American Heart Association Blood Pressure Guideline With Cardiovascular Events Later in LifeAssociation Between Young Adult Hypertension and Cardiovascular Events in Middle Age Association Between Young Adult Hypertension and Cardiovascular Events in Middle Age JAMA, 2018. 320(17): p. 1774–1782. [DOI] [PMC free article] [PubMed] [Google Scholar]
- 3.Benjamin Emelia J, et al. , Heart Disease and Stroke Statistics—2019 Update: A Report From the American Heart Association. Circulation. 0(0): p. CIR.0000000000000659. [DOI] [PubMed] [Google Scholar]
- 4.Kelly TN and He J, Genomic epidemiology of blood pressure salt sensitivity. 2012. 30(5): p. 861–873. [DOI] [PubMed] [Google Scholar]
- 5.Abais-Battad Justine M, et al. , Parental Dietary Protein Source and the Role of CMKLR1 in Determining the Severity of Dahl Salt-Sensitive Hypertension. Hypertension, 2019. 73(2): p. 440–448. [DOI] [PMC free article] [PubMed] [Google Scholar]
- 6.Geurts Aron M, et al. , Maternal Diet During Gestation and Lactation Modifies the Severity of Salt-Induced Hypertension and Renal Injury in Dahl Salt-Sensitive Rats. Hypertension, 2015. 65(2): p. 447–455. [DOI] [PMC free article] [PubMed] [Google Scholar]
- 7.Abais-Battad JM, et al. , Rag1-null Dahl SS rats reveal that adaptive immune mechanisms exacerbate high protein-induced hypertension and renal injury. Am J Physiol Regul Integr Comp Physiol, 2018. 315(1): p. R28–R35. [DOI] [PMC free article] [PubMed] [Google Scholar]
- 8.Abais-Battad Justine M, Dietary Effects on Dahl Salt-Sensitive Hypertension, Renal Damage, and the T Lymphocyte Transcriptome. Hypertension, 2019. [DOI] [PMC free article] [PubMed] [Google Scholar]
- 9.Lorenzen JM, Martino F, and Thum T, Epigenetic modifications in cardiovascular disease. Basic research in cardiology, 2012. 107(2): p. 245–245. [DOI] [PMC free article] [PubMed] [Google Scholar]
- 10.Wise IA and Charchar FJ, Epigenetic Modifications in Essential Hypertension. 2016. 17(4): p. 451. [DOI] [PMC free article] [PubMed] [Google Scholar]
- 11.Kato N, et al. , Trans-ancestry genome-wide association study identifies 12 genetic loci influencing blood pressure and implicates a role for DNA methylation. Nature Genetics, 2015. 47: p. 1282. [DOI] [PMC free article] [PubMed] [Google Scholar]
- 12.Liu P, et al. , Role of DNA De Novo (De)Methylation in the Kidney in Salt-Induced Hypertension. Hypertension, 2018. 72(5): p. 1160–1171. [DOI] [PMC free article] [PubMed] [Google Scholar]
- 13.Liu Y, et al. , Base-Resolution Maps of 5-Methylcytosine and 5-Hydroxymethylcytosine in Dahl S Rats. Hypertension, 2014. 63(4): p. 827–838. [DOI] [PMC free article] [PubMed] [Google Scholar]
- 14.Edgar R, Domrachev M, and Lash AE, Gene Expression Omnibus: NCBI gene expression and hybridization array data repository. Nucleic Acids Res, 2002. 30(1): p. 207–10. [DOI] [PMC free article] [PubMed] [Google Scholar]
- 15.Mattson DL, et al. , Chromosome substitution reveals the genetic basis of Dahl salt-sensitive hypertension and renal disease. American journal of physiology. Renal physiology, 2008. 295(3): p. F837–F842. [DOI] [PMC free article] [PubMed] [Google Scholar]
- 16.Watanabe M, et al. , Within-pair differences of DNA methylation levels between monozygotic twins are different between male and female pairs. BMC medical genomics, 2016. 9(1): p. 55–55. [DOI] [PMC free article] [PubMed] [Google Scholar]
- 17.Mamrut S, et al. , Integrative analysis of methylome and transcriptome in human blood identifies extensive sex- and immune cell-specific differentially methylated regions. Epigenetics, 2015. 10(10): p. 943–957. [DOI] [PMC free article] [PubMed] [Google Scholar]
- 18.Gu H, et al. , Genome-scale DNA methylation mapping of clinical samples at single-nucleotide resolution. Nature Methods, 2010. 7: p. 133. [DOI] [PMC free article] [PubMed] [Google Scholar]
- 19.Li Y, et al. , Stability of global methylation profiles of whole blood and extracted DNA under different storage durations and conditions. 2018. 10(6): p. 797–811. [DOI] [PubMed] [Google Scholar]
- 20.Krueger F and Andrews SR, Bismark: a flexible aligner and methylation caller for Bisulfite-Seq applications. Bioinformatics, 2011. 27(11): p. 1571–1572. [DOI] [PMC free article] [PubMed] [Google Scholar]
- 21.Jühling F, et al. , metilene: fast and sensitive calling of differentially methylated regions from bisulfite sequencing data. Genome research, 2016. 26(2): p. 256–262. [DOI] [PMC free article] [PubMed] [Google Scholar]
- 22.Cañadas-Garre M, et al. , Genomic approaches in the search for molecular biomarkers in chronic kidney disease. Journal of translational medicine, 2018. 16(1): p. 292–292. [DOI] [PMC free article] [PubMed] [Google Scholar]
- 23.Morgado-Pascual JL, et al. , Epigenetic Modification Mechanisms Involved in Inflammation and Fibrosis in Renal Pathology. Mediators of inflammation, 2018. 2018: p. 2931049–2931049. [DOI] [PMC free article] [PubMed] [Google Scholar]
- 24.Richard MA, et al. , DNA Methylation Analysis Identifies Loci for Blood Pressure Regulation. American journal of human genetics, 2017. 101(6): p. 888–902. [DOI] [PMC free article] [PubMed] [Google Scholar]
- 25.Rudemiller N, et al. , CD247 modulates blood pressure by altering T-lymphocyte infiltration in the kidney. Hypertension (Dallas, Tex. : 1979), 2014. 63(3): p. 559–564. [DOI] [PMC free article] [PubMed] [Google Scholar]
- 26.Evans LC, et al. , Increased Perfusion Pressure Drives Renal T-Cell Infiltration in the Dahl Salt-Sensitive Rat. Hypertension (Dallas, Tex. : 1979), 2017. 70(3): p. 543–551. [DOI] [PMC free article] [PubMed] [Google Scholar]
- 27.Morales-Nebreda L, McLafferty FS, and Singer BD, DNA methylation as a transcriptional regulator of the immune system. Translational Research, 2019. 204: p. 1–18. [DOI] [PMC free article] [PubMed] [Google Scholar]
- 28.Schmidl C, et al. , Epigenetic mechanisms regulating T-cell responses. Journal of Allergy and Clinical Immunology, 2018. 142(3): p. 728–743. [DOI] [PubMed] [Google Scholar]
- 29.Tsagaratou A, et al. , Dissecting the dynamic changes of 5-hydroxymethylcytosine in T-cell development and differentiation. 2014. 111(32): p. E3306–E3315. [DOI] [PMC free article] [PubMed] [Google Scholar]
- 30.Zheleznova NN, Yang C, and Cowley AW Jr., Role of Nox4 and p67phox subunit of Nox2 in ROS production in response to increased tubular flow in the mTAL of Dahl salt-sensitive rats. American journal of physiology. Renal physiology, 2016. 311(2): p. F450–F458. [DOI] [PMC free article] [PubMed] [Google Scholar]
- 31.Feng D, et al. , Increased expression of NAD(P)H oxidase subunit p67(phox) in the renal medulla contributes to excess oxidative stress and salt-sensitive hypertension. Cell metabolism, 2012. 15(2): p. 201–208. [DOI] [PMC free article] [PubMed] [Google Scholar]
- 32.Chen Z, et al. , Selective regulatory function of Socs3 in the formation of IL-17-secreting T cells. Proceedings of the National Academy of Sciences of the United States of America, 2006. 103(21): p. 8137–8142. [DOI] [PMC free article] [PubMed] [Google Scholar]
- 33.Zhang J, et al. , Cyclophosphamide perturbs cytosine methylation in Jurkat-T cells through LSD1-mediated stabilization of DNMT1 protein. Chemical research in toxicology, 2011. 24(11): p. 2040–2043. [DOI] [PMC free article] [PubMed] [Google Scholar]
- 34.Villagra A, et al. , The histone deacetylase HDAC11 regulates the expression of interleukin 10 and immune tolerance. Nature immunology, 2009. 10(1): p. 92–100. [DOI] [PMC free article] [PubMed] [Google Scholar]
- 35.Tang X, et al. , Mitochondrial Sirtuins in cardiometabolic diseases. Clinical Science, 2017. 131(16): p. 2063–2078. [DOI] [PubMed] [Google Scholar]
- 36.Yu J, et al. , DNA methyltransferase expression in triple-negative breast cancer predicts sensitivity to decitabine. The Journal of clinical investigation, 2018. 128(6): p. 2376–2388. [DOI] [PMC free article] [PubMed] [Google Scholar]
- 37.Gao C, et al. , Incidence and risk of hematologic toxicities with hypomethylating agents in the treatment of myelodysplastic syndromes and acute myeloid leukopenia: A systematic review and meta-analysis. Medicine, 2018. 97(34): p. e11860–e11860. [DOI] [PMC free article] [PubMed] [Google Scholar]
- 38.Fehrenbach DJ, et al. , Salt-sensitive increase in macrophages in the kidneys of Dahl SS rats. Am J Physiol Renal Physiol, 2019. 317(2): p. F361–F374. [DOI] [PMC free article] [PubMed] [Google Scholar]
- 39.Mattson DL, et al. , Genetic mutation of recombination activating gene 1 in Dahl salt-sensitive rats attenuates hypertension and renal damage. Am J Physiol Regul Integr Comp Physiol, 2013. 304(6): p. R407–14. [DOI] [PMC free article] [PubMed] [Google Scholar]
- 40.Mattson DL, et al. , Influence of diet and genetics on hypertension and renal disease in Dahl salt-sensitive rats. Physiological Genomics, 2004. 16(2): p. 194–203. [DOI] [PubMed] [Google Scholar]
- 41.Abais-Battad JM and Mattson DL, Influence of dietary protein on Dahl salt-sensitive hypertension: a potential role for gut microbiota. American Journal of Physiology-Regulatory, Integrative and Comparative Physiology, 2018. 315(5): p. R907–R914. [DOI] [PMC free article] [PubMed] [Google Scholar]
Associated Data
This section collects any data citations, data availability statements, or supplementary materials included in this article.