

Summary
Cardiac ischemia leads to the loss of myocardial tissue and the activation of a repair process that culminates in the formation of a scar whose structural characteristics dictate propensity to favorable healing or detrimental cardiac wall rupture. To elucidate the cellular processes underlying scar formation, here we perform unbiased single-cell mRNA sequencing of interstitial cells isolated from infarcted mouse hearts carrying a genetic tracer that labels epicardial-derived cells. Sixteen interstitial cell clusters are revealed, five of which were of epicardial origin. Focusing on stromal cells, we define 11 sub-clusters, including diverse cell states of epicardial- and endocardial-derived fibroblasts. Comparing transcript profiles from post-infarction hearts in C57BL/6J and 129S1/SvImJ inbred mice, which displays a marked divergence in the frequency of cardiac rupture, uncovers an early increase in activated myofibroblasts, enhanced collagen deposition, and persistent acute phase response in 129S1/SvImJ mouse hearts, defining a crucial time window of pathological remodeling that predicts disease outcome.
Keywords: myocardial infarction, single-cell biology, cardiac rupture, fibrosis, genetic diversity, heart, mouse, epicardial-derived, scRNAseq, Seurat
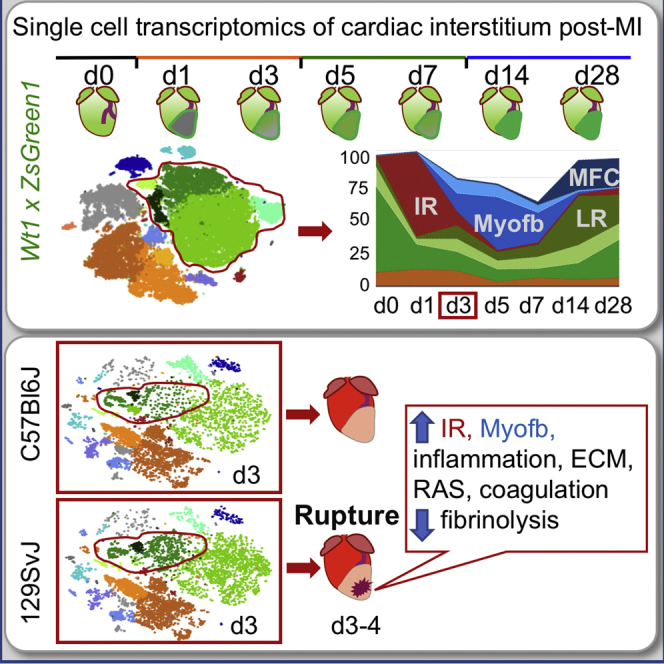
Graphical Abstract
Highlights
-
•
Longitudinal transcriptional profiling of cardiac interstitial cells post-infarct
-
•
Identification of epicardial versus endocardial origin of cardiac stromal cells
-
•
A distinct early injury-response signature precedes appearance of myofibroblasts
-
•
Modulation of early fibrosis predicts cardiac rupture and pathological remodeling
Using single-cell transcriptional profiling of mouse hearts carrying a reporter for epicardial-derived cells, Forte et al. provide a dynamic view of cardiac interstitial responses across acute and chronic phases of remodeling post-infarction. Comparing responses on diverse genetic backgrounds reveals novel cellular and transcriptional features of cardiac rupture propensity.
Introduction
Myocardial infarction (MI) is defined by extensive myocardial cell death due to prolonged ischemia (Thygesen et al., 2018) and remains a main cause of morbidity and mortality worldwide. The ability to regenerate the heart in lower vertebrates and neonates has been attributed to the proliferation of pre-existing cardiomyocytes (Foglia and Poss, 2016), a property that is almost entirely lost in the adult mammalian heart, where response to injury results in the formation of a scar. The outcome of the repair process is highly dependent on the extent of myocardial death and on the interplay between the inflammatory response and fibrosis (Forte et al., 2018), which can lead to rupture or adverse ventricular remodeling and heart failure.
Cardiac interstitial cells are increasingly recognized as main players in organ injury response. They constitute 60%–70% of the total cells of the heart and include immune cells, endothelial cells, smooth muscle cells (SMCs), pericytes, fibroblasts, and various putative stem cell populations. Traditionally, most mesenchymal cell types in the heart have been defined and sub-selected based on the expression of surface markers, but no stem cell marker identified to date is unique to a particular stromal cell type, and the relations of putative stem cell sub-populations to other mesenchymal cells in the cardiac interstitium are unclear (Forte et al., 2018). While the existence of any significant population of resident cardiac stem cells in the adult heart has been largely disproved (Chien et al., 2019), heterogeneity in the mesenchymal-stromal fraction of the mammalian cardiac cellulome likely indicates a spectrum of different functions in both homeostasis and response to injury (Skelly et al., 2018).
Previous explorations of cardiac cellular diversity in the mouse heart characterizing single-cell transcriptional profiles of major non-myocyte cell populations (Farbehi et al., 2019, Kretzschmar et al., 2018, Pinto et al., 2016, Skelly et al., 2018) have yielded valuable insights into the structure of the cardiac cellulome. To develop a more definitive compendium of interstitial cell types and transitions in response to cardiac injury, we applied unbiased single-cell RNA sequencing (scRNA-seq) to profile the progression of gene expression patterns in cardiac interstitial cells through the three main phases of post-MI response: inflammation, proliferation, and maturation. Analysis of multiple closely spaced time points immediately after MI revealed a rapidly changing landscape of interstitial cell types, providing a detailed and comprehensive characterization of cellular features and building a precise map of stromal cell evolution in response to injury.
Given the dramatic differences in myocardial response to infarction among genetically diverse mice (Salimova et al., 2019), we analyzed two inbred strains, C57BL/6J and 129S1/SvImJ, to define distinct cellular features at the transition between inflammatory and proliferative phases, when the two strains display major differences in the incidence of early rupture (23% versus 59%, respectively). These studies reveal significantly different fibroblast states in hearts that are genetically prone to post-MI rupture, pinpointing specific cell populations that define reparative outcome in the damaged myocardium, which represent promising targets for anti-fibrotic treatments of heart failure.
Results
Single-Cell Analysis Defines the Interstitial Cell Landscape Post-MI
To profile cell dynamics in response to MI, we performed unbiased scRNA-seq on live nucleated interstitial cells using the 10X Chromium technology (Zheng et al., 2017). Since the epicardium, the mesothelium covering the heart, is the major source (∼80%) of cardiac fibroblasts in homeostasis (Furtado et al., 2016, Smith et al., 2011), we traced the stromal component using C57BL/6J Wt1Cre;RosaZsGreenf/+ mice, in which an enhanced green fluorescent protein (EGFP) variant (ZsGreen1) marks epicardial derivatives. To obtain a clean preparation of interstitial cells, we removed cardiomyocytes, debris, and dead cells by straining the cell suspension through 40-μm meshes using magnetic beads-based dead cell depletion and sorting for nucleated (DRAQ+) live (DAPI−) cells. A total of 36,847 live, nucleated interstitial cells were captured at homeostasis and at days (d) 1 and 3 (inflammatory phase), 5 and 7 (proliferative phase), and 14 and 28 (maturation phase) post-MI from 7 mice (Figure 1A; Table S1; Forte et al., 2018). Whole-mount images showed a diffuse ZsGreen fluorescence in homeostasis, which increased in intensity after injury, transiting from global heart activation (d1) to the border zone of the infarct (d3–d5) and onward into the scar area (d5–d28) (Figure 1B). ZsGreen+ cells increased in the late remodeling phase, indicating the presence of epicardial-derived cells in the mature scar (Figure 1C). Global clustering of single-cell transcriptomes (Butler et al., 2018, Zheng et al., 2017) revealed 16 main populations, identified by marker genes preferentially expressed in each cluster (Figures 1D–1G; Table S2). These populations included endothelium (Fabp4, Pecam1); lymphatic endothelium (Lyve1, Cldn5); SMCs (Rgs5, Vtn, Kcnj8); Schwann cells (Plp1, Kcna1); 7 immune cell populations (granulocytes [S100a8, S100a9], monocytes I [Chil3, Plac8] and II [Saa3, Arg1], macrophages [C1qa, Cd68], dendritic cells [DCs; H2ab1, Cd74], B cells [Cd79a, H2-DMb2], and a mixed T-natural killer [NK] cell cluster [Nkg7, Ms4a4b, Gzma]); three fibroblast populations (types I [Col1a1, Gsn, Dcn], II [Wif1, Dkk3], and III [Mt2, Timp1]); myofibroblasts (Myofb; [Cthrc1, Acta2, Postn]); and epicardium (Clu, Dmkn)—all of these are described in more detail in Figures 1D and 1E.
Figure 1.

Single-Cell RNA-Seq of Interstitial Cells Post-MI Reveals Population Dynamics in Cardiac Repair
(A) Murine cardiac interstitial cells were isolated by mechanical and enzymatic dissociation of adult mouse cardiac ventricular tissue (dashed square); mesh purification, magnetic dead cell depletion, and sorting were performed to exclude cardiomyocytes and apoptotic or necrotic cells before analysis. A total of 38,600 cells were captured and sequenced (n = 7 mice).
(B) Selected time points and whole-mount images of Wt1cre;ZsGreenf/+ mice used to trace epicardial-derived components in the cardiac interstitium.
(C) Percentage of single live nucleated ZsGreen+ interstitial cells detected by flow cytometry in the samples used for scRNAseq. Data shown as mean ± SD of two technical replicates at each time point.
(D) t-Distributed stochastic neighbor embedding (t-SNE) plot of the aggregate of all sequenced cells across time points. Seurat analysis with 24 PC and resolution 0.5 was used to define 16 main clusters.
(E) Dot-plot visualization of top marker genes used to identify clusters. Dot sizes denote percentage of expression per cluster; color gradient defines average expression per cell.
(F) t-SNE plot showing cell contribution by time point identified by color.
(G) Bar plot of percentage of cluster contributions per time point.
See also Figures S1 and S2 and Tables S1 and S2.
ZsGreen expression marking epicardial origin was predominant in five clusters: epicardium, smooth muscle, and fibroblast types I–III (Figures 1E and S1A). Co-expression of Wt1 and ZsGreen marked a minor percentage of endothelial (∼1%) and smooth muscle (∼2%) cells, as well as the activated post-MI epicardium, indicating de novo expression of the gene, verified using immunofluorescence (Figures S1B–S1D). No de novo expression of Wt1 mRNA was seen in fibroblasts, confirming that post-MI activated fibroblasts derive from the pre-existing Wt1Cre;RosaZsGreenf/+ labeled pool of cells.
A dynamic and choreographed contribution of cell types evolved during infarct resolution (Figures 1F and 1G). Innate immune cells accumulated immediately after MI (Figures 1D–1G): short-lived neutrophils peaked within 24 h (Forte et al., 2018), monocytes appeared between d1 and d7, and macrophages peaked ∼d3–d7. Cell ratios returned to near-homeostatic levels during the maturation phase of MI (d14–d28), with fibroblasts and endothelial cells prevailing over immune components (Figure 1G). Whereas a significant fraction of new cell types and states were observed in the stromal and innate immune cell aggregates during recovery from MI, adaptive immune and vascular/mural cells were relatively stable (Figure S2).
Dynamics of Stromal Populations Involved in Scar Formation
To obtain a more detailed portrait of stromal transition from homeostasis (Furtado et al., 2014, Pinto et al., 2016, Skelly et al., 2018) to post-MI response, fibroblast types I–III, Myofb, and mesothelial epicardial populations were aggregated and sub-clustered. Twelve sub-clusters were obtained (Figures 2A, 2B, S3, and S4; Table S3). Cellular trajectories were defined using SPRING (Weinreb et al., 2018) (links to SPRING visualization in Figure S2C). Predictions using DoubletFinder (McGinnis et al., 2019) revealed an overall very low percentage of predicted doublets across clusters and sub-clusters (Figure S3). Three clusters were excluded from further analyses due to low cell representation or mixed identity: a small cluster defined by interferon-response (IFNr) genes (Ifit3, Isg15, Ifit1), a few dendritic-like cells (Cd52, C1qb) with a relatively higher frequency of predicted doublets (0.5%; Figure S3) compared to other clusters and sub-clusters, and phagocytic cells (mixed myeloid-Myofb signature; Actb, Notch2, Lyz2, P2y12). The latter cells were enriched during the post-MI proliferative phase (d3–d7) and were transcriptionally similar to proliferating Myofb (Figure S4B), presenting a relatively higher expression of genes involved in metabolic processes and oxidative phosphorylation (Figures 2E and S4).
Figure 2.

Evolution of Fibroblast States across Phases of Repair
(A) t-SNE plot of combined stromal clusters (fibroblasts I, II, and III, myofibroblasts) and epicardium, further sub-clustered by 20 PC, resolution 0.5, colored by cluster separation.
(B) Bar plot representation of the relative frequency of different fibroblast sub-clusters (percentage over total cells) at different time points across repair.
(C) Dot-plot representation of top two signature genes per sub-cluster.
(D) SPRING visualization of fibroblast sub-clusters; 1,200 cells are shown per time point, colored by Seurat-defined clusters.
(E) PANTHER GO-slim biological process overrepresentation analysis of fibroblasts sub-cluster marker genes, showing representative GO terms per each sub-cluster, excluding DCs, dendritic-like cells, and IFNr (interferon-responsive cells). Bonferroni corrected p values.
See also Figures S2–S4 and Tables S3 and S4.
Within the type I fibroblast population, three closely related populations of ZsGreen+ epicardial-derived fibroblasts (EpiDs) were obtained and defined, based on temporal prevalence and/or marker expression, as homeostatic epicardial derived fibroblasts (HEpiDs), progenitor-like state fibroblasts (PLSs), and late-resolution (LR) fibroblasts. HEpiDs were characterized by a relatively higher level of expression of genes associated with the response to organic substances and metabolic effectors: Dpep1, a zinc-dependent metalloproteinase involved in glutathione and leukotriene metabolism, which may have a role in transforming growth factor β (TGF-β)-induced epithelial-mesenchymal transition (EMT) (Park et al., 2016); Lpl, important for lipoprotein triglyceride metabolism (Fernández-Borja et al., 1996, Xie et al., 2018); Hsd11b1, which converts cortisol to its inactive form, cortisone, and may affect dermal fibroblast proliferation (Terao et al., 2014); and the pleiotropic chemokine Cxcl14 (Hara and Tanegashima, 2012, Lu et al., 2016; Figures 2C–2E and S4C). PLSs were relatively stable across all time points (Figure 2B), expressed genes associated to cell migration and morphogenesis, known stromal cell markers Cd248 (Smith et al., 2015), Pi16 (Regn et al., 2016, Xie et al., 2018), and relatively higher levels of Ly6a, previously used as a marker to enrich for putative cardiac progenitor cells (Tang et al., 2018, Farbehi et al., 2019, Oh et al., 2003; Figures 2C–2E and S4C). LR fibroblasts were prevalent at d14–d28 (maturation phase), expressing a relatively higher level of genes associated with cell differentiation, osteogenesis, and regulation of matrix remodeling and deposition, including Adamtls2 and Cilp, secreted proteins involved in the negative regulation of TGF-β availability (Le Goff et al., 2008) and activity (Zhang et al., 2018), fibrillogenesis (Koo et al., 2007), and fibrosis (van Nieuwenhoven et al., 2017, Zhang et al., 2018); Col8a1, an extracellular matrix (ECM) component conferring tensile strength that supports vessel integrity and structure (Kittelberger et al., 1990) upregulated in the presence of vascular injury (Gerth et al., 2007, Kittelberger et al., 1990, Lopes et al., 2013); and the transcription factor Meox1, which is involved in embryonic somitogenesis and TGF-β-induced differentiation of SMCs (Dong et al., 2018; Figures 2C–2E and S4C). Meox1 is also implicated in cardiac pathological hypertrophy (Lu et al., 2018) and is downregulated during in vitro phenoconversion from fibroblasts to Acta2+ Myofb (Cunnington et al., 2014). The observed gene expression pattern of LR fibroblasts and their prevalence during the maturation phase suggests that these cells arise as a consequence of chronic pathological remodeling rather than as direct precursors of Acta2+ Myofb, as was recently suggested (Farbehi et al., 2019).
The SPRING k-nearest neighbor (knn) graphical representation of stromal cells showed a linear progression from EpiD ZsGreen+ to Myofb (Figure 2C). Type II fibroblasts (Wif1, Dkk3) appeared as a distinct sub-cluster, branching separately in the SPRING plot (Figure 2D) and characterized by a gene signature closely related to valve leaflets, with top canonical pathways involved in endochondral ossification and Wnt signaling and Gene Ontology (GO) terms related to anatomical structure morphogenesis and development (Figures 2C–2E, 3E, and S4C). Given the low level of ZsGreen expression in these cells, possibly due to ambient RNA contamination, they are likely endocardial-derived fibroblasts (EndD). Consistently, 88.5% ± 2.27% of the DKK3+ cells in the ventricles were co-labeled with ZsGreen in TekCre;ZsGreenf/+ mice (which trace endocardial-derived cells), while 88.05% ± 4.02% of EndD cells were ZsGreen− in Wt1Cre;RosaZsGreenf/+ mice (Figure 3). A similar population, recently referred to as Wnt-X (Farbehi et al., 2019), was considered an activated state, since WIF1 protein was observed immediately after injury in the peri-infarct area (Figure S4D). In contrast, our analysis showed the expression of the signature marker DKK3 already in homeostasis around coronary vessels and valve fibroblasts (Figure 3), suggesting that the segregation of the EndD as a sub-population of fibroblasts may be due to its embryological origin, rather than to an activation state (Figure 2D).
Figure 3.

Endocardial-Derived Fibroblast (EndD) Validation in Homeostatic Ventricles
(A) Confocal imaging of the EndD marker DKK3 (in red) on cardiac sections from adult Wt1Cre; ZsGreenf/+ mice. ZsGreen labels epicardial derived cells.
(B) Quantification of the percentage of DKK3+ cells co-labelled with the reporter ZsGreen. Data are represented as mean ± SEM. N = 3 biological replicates, 7 technical replicates.
(C) Confocal imaging of DKK3 (in red) on cardiac sections from adult TekCre; ZsGreenf/+ mice. ZsGreen labels endocardial-derived cells.
(D) Quantification of the percentage of DKK3+ cells co-labelled with the reporter ZsGreen. Data are represented as mean ± SEM. N = 3 biological replicates, 7 technical replicates.(E) Enrichr analysis of EndD marker genes identified top related cell (mouse gene atlas) and tissue (ARCHS4 tissues) types.
A sub-cluster of ZsGreen+ EpiD cells, defined by its injury response (IR) properties, and expressing high levels of Mt1-2 transcripts (Figures 4 and S4B), appeared at d1, preceding Myofb at d3 (Figure 2B). MT1-2 metallothioneins are involved in the alleviation of oxidative stress and immunomodulation (Subramanian Vignesh and Deepe, 2017), and transient Mt1-2 activation in stress conditions or inflammatory diseases (De et al., 1990) exerts a protective function by reducing apoptosis and excessive fibrosis (Duerr et al., 2016). The IR sub-cluster also showed a high expression of monocyte-macrophage chemoattractants Ccl2, Ccl7, and Csf1 and neutrophil activators Cxcl1 and Cxcl5; pro-inflammatory-pro-fibrotic factors Il33, Cxcl12, and Tgfb1 (Figure 4B); the metalloprotease inhibitor Timp1, which blocks Mmp1 but can additionally prevent apoptosis and induce proliferation in a range of cell types (Brew and Nagase, 2010); the Mmp3 metalloprotease, which can degrade the major components of the ECM but not interstitial collagen I (Lu et al., 2011); and matricellular proteins with pro-inflammatory or pro-reparative functions such as Prg4 (Iqbal et al., 2016) and Angptl4 (Jamil et al., 2017, Teo et al., 2017). This complex cocktail of regulatory factors implicates the IR cell cluster in the initiation of the inflammatory response and formation of granulation tissue. GO biological terms and canonical pathways associated with this cluster included ribosome biogenesis; regulation of eukaryotic translation initiation factor 2 (eIF2), eIF4, and p70S6K, indicating active protein synthesis and translation; and acute phase response signaling (Serpina3n, Serpina1, Tnfrsf1a), involved in the unfolded protein response and glycolysis (Figures 2E and 4C). To confirm the expression of MT1-2 in stromal cells, immunostaining was performed on Wt1cre;ZsGreenf/+, to verify the epicardial origin, and Col1a1eGFP mice, for quantification. While in homeostasis, MT1-2 proteins were expressed mostly in CD45+ cells (88.9% ± 5.4% of CD45+ cells, 4% ± 1.3% of Col1a1-EGFP+ cells; Figures 4D and 4E), reflecting their role in immune cell maturation (Subramanian Vignesh and Deepe, 2017); global activation was detected at d1 in EpiD (ZsGreen+) stromal cells, extending from the injury site to remote myocardial areas (62.7% ± 2.5% of Col1a1-GFP+ cells Figures 4D and 4E). At d3, MT1-2+ stromal cells were reduced and mostly confined to the scar area (29.6% ± 5% of Col1a1-GFP+ cells in the scar area versus 6% ± 0.2% distal area), labeling a fraction of Myofb defined by anatomical position, morphology, and high expression of Col1a1-GFP. MT1-2+ was mostly limited to CD45+ and sub-epicardial cells at d5. Consistently, SPRING analysis showed that the IR cluster evolved from high expression of Mt1-2 and stromal and fibroblast genes (Gsn [Witke et al., 1995], Pdpn [Suchanski et al., 2017], Angptl4) on d1 to low expression of Mt1-2 accompanied by Myofb markers (Fn1, Acta2, Cthrc1) on d3 (Figure 4F), suggesting that IR cells rapidly transition to Myofb, in contrast to a previous report suggesting the appearance of Myofb not earlier than d7 post-MI (Farbehi et al., 2019).
Figure 4.

An Epicardial-Derived Injury Response (IR) Fibroblast Population in the Early Phase of Repair Post-MI
(A) Heatmap of the average expression of the top 20 signature IR cluster genes across all fibroblast sub-clusters.
(B) Top cytokines and chemokines produced by the IR cluster.
(C) Top IR cluster canonical pathways identified using Ingenuity Pathway Analysis (IPA).
(D) Confocal imaging of MT1-2 staining in IR fibroblasts at d1 and d3 post-MI using Wt1cre;ZsGreenf/+ and Col1a1eGFP reporter mice.
(E) Scatterplot showing the percentage of MT1-2+ cells co-labeled with the reporter Col1a1eGFP or CD45 (gray). A total of 5–10 frames were counted per each time point, 2–3 mice per time point. Data are represented as means ± SEMs. LV (green dot) is the left ventricle injury site; RV/Distal (red triangle), right ventricle, area distal from the injury site.
(F) SPRING visualization of the IR sub-cluster showing time course evolution of cluster identity (blue arrow) from fibroblast (Fb) to myofibroblast (Myofb). Plots on right panels show marker genes that distinguish early (Fb) from late (Myofb) IR cells. Scale bars, 50 μm.
Myofb, large cells with highly active endoplasmic reticulum, are defined as specialized fibroblasts that appear post-injury, produce a high quantity of ECM components, and acquire some phenotypic and functional features of SMCs, such as contraction capacity upon stimulation, essential for the closure and stabilization of the injury site (Baum and Duffy, 2011, Forte et al., 2018). Our analysis showed a linear progression from EpiD ZsGreen+ to Myofb (Figure 2D). Three main populations of Myofb were observed post sub-clustering: Myofb (Acta2, Cthrc1), ProlifMyofb (Acta2, Cthrc1, cell-cycle genes) from d3 to d7, and a group of cells similar to the recently defined matrifibrocytes (MFCs) (Fu et al., 2018) enriched in the mature scar (d14–d28). MFCs expressed genes related to osteoblasts and chondrocytes, similarly to EndD fibroblasts (Figure 5), such as cartilage oligomeric matrix protein (Comp), an ECM protein present in cartilage that catalyzes the assembly of collagens and formation of fibrils (Halász et al., 2007), and genes associated with fibrosis and collagen signaling, similar to LR fibroblasts and Myofb. Pairwise differential gene expression analysis of all fibroblast states using Seurat revealed that, compared to EndD, MFCs had higher levels of ECM components (Col8a1, Fn1, Fbn1, Itgbl1, Wisp2, and Cthrc1) and notably did not express the Wnt inhibitor Wif1 (Figure S4C; Table S4). Compared to Myofb, MFCs had reduced expression of genes associated with contractility (Acta2, Tagln, Tpm2, and Myl9) or ECM components (Timp1, Tnc, Cthrc1, and Col1a1), but expressed Comp and Angptl7 and Fbln1 and Cilp, supporting the transition to a less contractile, less secretory cell type producing components of a more stable, chondrogenic-like ECM.
Figure 5.

Contribution of Myofibroblasts (Myofb), Matrifibrocytes (MFCs), and Late Response Fibroblasts (LR) to Ventricular Remodeling Post-MI
(A) knn SPRING visualization of the Myofb cluster identified from analysis of the stromal aggregate across 7 time points (PC24, resolution 0.5), colored by time and by the expression of early Myofb marker genes (Acta2, Tnc, Cthrc1, light blue) and MFC marker genes (Sfrp2, Clu, Ecrg4, Comp, Wisp2, Thsb4).
(B and C) Confocal imaging of adult hearts from Col1a1eGFP mice, used as a genetic marker for stromal cells. (B) Myofb markers CTHRC1 (red) and ACTA2 (white) and (C) MFC markers SFRP2 (red) and CLU (white) at different time points post-MI.
(D) qPCR validation of additional Myofb (light blue), MFC (dark blue), and LR (olive green) markers on live nucleated stromal cells (PI−, DRAQ5+, EGFP+) sorted from Col1a1eGFP transgenic hearts. Scar or distal areas were dissected and separately processed for sorting from control (n = 3) or d5 (n = 3) and d14 (n = 3) post-MI ventricular tissue.
Data are summarized as box and whisker plots, indicating the median value (black bar inside box), 25th and 75th percentiles (bottom and top of box, respectively), and minimum and maximum values (bottom and top whisker, respectively). Statistical significance (∗p < 0.05, ζp < 0.001, #p < 0.0001) was calculated per each gene by two-tailed unequal variance Student’s t test between sample (distal d5, distal d14, scar d5) and correspondent reference used for normalization (distal d0, scar d14). Scale bars, 50 μm.
To visualize the conversion between these two cell types in the injury site, immunofluorescence was performed using ACTA2 and CTHRC1 as Myofb markers. MFC markers included SFRP2, a pro-reparative paracrine factor (Mirotsou et al., 2007), and CLU, a widely expressed glycoprotein upregulated in senescent fibroblasts or under different stress conditions. CLU may play a role in apoptosis, debris removal, and folding of secreted proteins (Jenne and Tschopp, 1992, Jones and Jomary, 2002; Figures 5B and 5C). ACTA2 staining in Myofb was seen at a lower intensity than in SMCs starting from d3, and was mostly limited to vessels at d14–d28, while Myofb CTHRC1 staining persisted at late stages. In MFCs, SFRP2 and CLU staining increased at later stages; the latter was also expressed in activated endocardium and epicardium (Figure 5C). qPCR analysis on Col1a1-EGFP+ stromal cells isolated from the scar and distal myocardial areas of the heart at d5–d14 post-MI confirmed that Myofb markers Acta2 and Tnc were significantly higher in the scar during the proliferation phase (d5), while MFC markers Ecrg4, Comp, Sfrp2, Thbs4, Wisp2, Meox1, and Col8a1 were upregulated at d14. Meox1, Comp, Ecrg4, and Col8a1 were unaltered or not significantly changed in the d5 distal area compared to the control, confirming their enrichment in LR fibroblasts. These results underscore the dynamic stromal response to cardiac injury, which induces a complex orchestration of multiple cell subtypes responsible for post-MI remodeling.
Genetically Determined Factors Confer Resilience to Cardiac Rupture
Genetic background dictates differences in initial cardiac stromal cell composition that may influence the course of replacement fibrosis in cardiovascular disease (Forte et al., 2018, Salimova et al., 2019). Here, we took advantage of the genetic diversity across inbred mouse strains to investigate the variation in response to MI: C57BL/6J or B6J (control), 129S1/SvlmJ or 129 (prone to hypertension), DBA/2J (prone to calcification), NOD/ShiLtJ (prone to type 1 diabetes), NZO/HlLtJ (obese), A/J (prone to muscular dystrophy), and three wild-derived strains (CAST/EiJ, WSB/EiJ, and PWK/PhJ) (Figure 6A). The mortality rate varied among strains, with 129 showing the highest rate of rupture (59%; n = 34) when compared to B6J (23%; n = 13), as previously described (Gao et al., 2005). The baseline cardiac function of both lines was similar (Figure S5), despite previous reports of higher blood pressure in 129 males (Barrick et al., 2007), attributed to the increased activity of the renin-angiotensin system (RAS) pathway (Lum et al., 2004, Wang et al., 2002), which promotes inflammation (Gao et al., 2017). Rupture occurred between d4 and d5 in B6J and d3 and d4 in 129 (Figure S5K), similar to previous reports (Gao et al., 2005) and coinciding with the transition from the inflammatory to the proliferative phase and of fibroblast state from IR to Myofb.
Figure 6.

Differential Rupture Rate and Stromal Cell Response across Inbred Murine Strains
(A) Pie charts showing 1-month survival rate post-MI of 9 inbred strains with different susceptibilities to cardiovascular dysfunction, including diabetes (NOD/ShiLtJ, n = 13), obesity (NZO/HILtJ, n = 16), hypertension (129S1/SvlmJ, n = 34), calcification (DBA/2J; n = 9), dystrophic myopathy (A/J; n = 14), and wild-derived strains (CAST/EiJ, n = 18; WSB/EiJ, n = 12 and PWK/PhJ, n = 11). C57BL/6J was used as a control (n = 13).
(B) Representative whole-mount images of 129S1/SvlmJ and C57BL/6J hearts at homeostasis and d3 post-MI.
(C) t-SNE plot of combined interstitial cells from C57BL/6J and 129S1/SvlmJ hearts (B6J sham, n = 2, 4,710 cells; 129 sham, 4,213 cells; d3 MI B6J, 3,950 cells; d3 MI 129, 4,128 cells). Twenty-seven clusters were obtained using unbiased clustering.
(D) Relative ratio of various stromal cell populations in 129 and B6J hearts at d3 sham or MI (mean cells per thousand). Two B6J sham samples were used to show consistency between biological replicates.
See also Figures S5 and S6 and Table S5.
To understand how differences in cell composition and/or gene expression may determine the higher propensity to rupture in 129, scRNA-seq of 129 and B6J cardiac interstitial cells were compared in sham-operated mice and at d3 post-MI (Figure 6B), the crucial pre-rupture time point. Data were integrated, using Harmony, an algorithm that projects cells into a shared embedding while accounting for a biological variable—in this case, genetic background (Korsunsky et al., 2019; Figure 6C). The comparison to sham-operated mice that were subjected to a similar procedure, with chest opening and tearing of the pericardium, allowed us to focus on the differences caused by the ischemic injury alone. Post-MI 129 hearts presented relatively more Myofb, ProlifMyofb, and IR fibroblasts than B6J (Figure 6D), at the expense of other fibroblast states, which were balanced or relatively reduced in 129 (Figures S6A and S6B).
Within the stromal cluster aggregate (Figure S6C), 3,922 genes were differentially expressed between 129 and B6J as a function of strain and MI (Tables S6 and S7). PANTHER analysis defined differences in pathways related to inflammation, receptor tyrosine kinase signaling, cell migration, ECM organization, and collagen formation between strains (Figures 7A, S7A, and S7B). Ingenuity Pathway Analysis (IPA) confirmed the enrichment in pathways related to fibrosis, adhesion, growth, and inflammation, and predicted upstream regulators, including pro-inflammatory and pro-fibrotic factors (Tgfb1, Tnf, Ifng, Il1b, Il4, Agt) (Figure S8). The expression of genes within GO categories for ossification, ECM organization, ECM structural components, and collagen-containing matrix were relatively reduced in 129 sham, but upregulated in 129 at 3d post-MI compared with B6J (Figures S7C and S7D). Within ECM components, elasticity genes (Eln, Emilin2, fibulins, microfibrillar-associated proteins) were relatively lower in 129 irrespective of injury (Figure 7C and S7D), while tensile-strength collagens (Fn1, Tnc, Thbs1, Vcan) were upregulated in 129 post-MI. ECM-associated enzymes (Adamts2, Adamts5, Lox, Loxl2, Bmp1) were also higher in 129 post-MI, while metalloproteinases were increased in B6J (Figures S8C and S8D), with the exception of Mmp9, or gelatinase B, which was previously associated with cardiac rupture (van den Borne et al., 2009), and Mmp14, a membrane-associated metalloprotease involved in the activation of MMP2, or gelatinase A (Jugdutt, 2003). ECM components involved in the inflammatory response (Hif1a, Timp1, F2r) were upregulated in 129 post-MI (Figures 7C and S7E), as well as coagulation genes (F2r, Pf4) and negative regulators of fibrinolysis (Serpine1, Thbs1) (Figure 7D). Mouse strain 129 also expressed relatively higher levels of acute phase response genes (Tlr4, Serpina3n, Saa3) both in sham and post-MI, and increased chemoattractant or chemokine activity post-MI, with the exception of Cxcl14, which was already higher in 129 sham (Figures 7D and S7E).
Figure 7.

Differential Pro-inflammatory and Secretory Phenotypes and ECM Composition between 129 and B6J Cardiac Stromal Cells
(A) PANTHER Reactome pathway analysis of 3,922 differentially expressed genes (FC ≥ 2; p < 0.01) between sham or d3 post-MI 129 and B6J stromal cells.
(B–D) Dot plots showing the percentage and intensity of expression of genes within representative GO terms related to angiotensin response (B), ECM composition (C), and acute phase response and coagulation (D) across all of the samples. Two B6J sham samples were used to show consistency of change between biological replicates. Percentage scores denote the number of genes within the GO term that are represented in the list of differentially expressed genes.
(E) qPCR validation of gene changes across samples. Sorted CD45−/CD31− stromal cells were isolated from adult 129 and B6J d3 sham or post-MI hearts (n = 3 biological and technical). Target genes were grouped as Myofb markers, ECM components, genes regulating ECM composition, coagulation, acute phase response, chemokine activity, and renin-angiotensin system (RAS).
Data are summarized as box and whisker plots, indicating the median value (black bar inside box), 25th and 75th percentiles (bottom and top of box, respectively), and minimum and maximum values (bottom and top whisker, respectively). Statistical significance (∗p < 0.05, ζp < 0.001, #p < 0.0001) per each gene was calculated by two-tailed unequal variance Student’s t test, comparing expression values in 129 versus B6J reference samples used for normalization.
See also Figures S7–S9 and Tables S6 and S7.
Among its numerous functions, the RAS is involved in ECM deposition through stimulation of the AgtR1 (Mehta and Griendling, 2007). Angiotensin II (AngII) induces a secretory phenotype in fibroblasts, stimulating the production of chemokines and ECM components (Bouzegrhane and Thibault, 2002), as well as pro-fibrotic factors, including TGF-β1 (Rosenkranz, 2004). AngII plays an essential role in promoting liver fibrosis by upregulating Toll-like receptor 4 (TLR4), thus enhancing downregulation of the TGF-β1 inhibitory pseudo-receptor BAMBI (Li et al., 2013). Consistently, our single-cell data showed a relative increase in Agt1ra, its downstream targets Tlr4, Tgfb1, and Ctgf (Figure 7B), and reduced Bambi in 129 stromal cells post-MI (Figures S8C and S9).
In summary, the increased susceptibility of 129 hearts to rupture is associated with persistent coagulation and impaired fibrinolysis that increases instability in the injury site, which is also supported by the higher responsiveness to angiotensin (Figures 7B, S7B, and S9). The increased production of ECM components in 129 post-MI does not confer resilience to rupture; rather, other ECM properties, such as fiber alignment, or physiological differences in baseline ECM composition, have been suggested as critical factors for heart repair following injury (Gao et al., 2002, Richardson and Holmes, 2016, Salimova et al., 2019).
Discussion
In the heart, interstitial cells of varying identities provide important regulatory functions in tissue homeostasis and repair, and an accurate evaluation of their composition is essential for defining their respective roles during pathogenesis and for devising strategies for tissue engineering and other therapeutic intervention. Our previous studies offered insights on the abundance and characteristics of different interstitial cell types in the heart, aided by isolation strategies and genetic tools to define and manipulate fibroblasts (Furtado et al., 2014), refined flow cytometry techniques (Pinto et al., 2012, Pinto et al., 2016), and unbiased single-cell analysis (Skelly et al., 2018) in the absence of cardiomyocytes, without relying on surface markers that may overlap different cell states and conceal heterogeneity (Ackers-Johnson et al., 2018, Jaitin et al., 2014). We also drew on recent work leveraging mouse genetic diversity for the discovery of the gene networks associated with variations in cardiovascular disease outcomes (Salimova et al., 2019).
The inclusion of a genetic reporter distinguished multiple EpiD subtypes (HEpiD, PLS, LR, IR, Myofb, MFC) whose sequential appearance defined post-MI phases, as well as an endocardial-derived cell population (EndD) expressing genes involved in endochondral ossification and Wnt signaling inhibition, whose stable presence in homeostasis persisted throughout repair. Detailed profiling of the dynamic transcriptional changes across three phases of cardiac response to infarction (inflammatory, proliferative, and maturation) revealed a rapid induction of dynamic injury-induced transitions in interstitial cell states, including an emerging fibroblast subset associated with inflammatory initiation that marked the inherited characteristics of pathogenic outcomes.
In contrast to previous scRNA-seq studies in cardiac post-ischemic injury (Farbehi et al., 2019, Kretzschmar et al., 2018), the analysis of multiple time points (d1, d3, d5, d7) immediately post-MI has provided a higher resolution of the early dynamic transitions in stromal cells that predict survival versus cardiac rupture. Whole-heart activation soon after injury identified an IR signature in fibroblasts and in a fraction of early Myofb, expressing molecular markers of oxidative stress alleviation and immunomodulation. A detailed analysis of the proliferative phase (d3, d5, d7) revealed a prevalence of Myofb and their cycling counterparts (ProlifMyofb) and a phagocytic population with mixed fibroblastic-myeloid identity (Arlein et al., 1998). Profiles of later post-MI stages (d14, d28) identified a population of EpiD (LR), expressing genes modulatory of TGF-β activity and availability and regulatory of ECM components involved in tissue remodeling and pathological hypertrophy. A similar cell type (F-actin) has been recently defined as a pre-Myofb activation state in which fibrosis is inhibited (Farbehi et al., 2019). Given that LR are prevalent in the distal infarct area during the maturation phase, when Myofb are replaced by MFC derived from Acta2+ cells (Fu et al., 2018), LR are most likely not direct Myofb precursors, but rather a state indicative of chronic remodeling. Our current analysis confirmed that MFCs are closely related to Myofb (Fu et al., 2018), but have reduced contractile and secretory properties, expressing different matrix components associated with late remodeling and ossification.
The early transition of IR to Myofb is likely an important step in determining reparative outcome, considering the high prevalence of cardiac rupture in 129 hearts in the early proliferative phase (d3–d4). Clear differences in the stromal compartment of 129 hearts showed a prevalence of Myofb and IR Myofb, with a stronger pro-inflammatory and secretory state, including increased production of chemokines, inflammatory signals, and ECM components, as compared to B6J hearts. This phenotype is correlated with an enhanced response to angiotensin. A high responsiveness to the RAS pathway may be due to the presence of a duplication of the Renin gene in the 129 strain, the function of which is still not completely clear (Lum et al., 2004, Wang et al., 2002). Treatments with therapeutic drugs targeting the RAS pathway cause a significant reduction in the frequency of rupture in 129, independently from changes in blood pressure, and attributed to reduced inflammatory infiltration (Gao et al., 2017). Here, significant differences in the single-cell transcriptomic analysis, combined with bulk qPCR validation in the stromal compartment of the 129 mice, are in line with the pleotropic functions of angiotensin, which not only regulates the recruitment of myeloid cells from the spleen (Swirski et al., 2009) but also promotes fibrosis and collagen deposition by fibroblasts (Lijnen et al., 2001, Mehta and Griendling, 2007). While it may seem paradoxical that mice with more ECM-secreting Myofb are prone to rupture, the reduced expression of collagens and ECM components conferring elasticity in 129 homeostatic hearts suggest that pre-existing scaffolds are more important than newly secreted matrices in conferring resistance to rupture (Gao et al., 2002). An alternative explanation for this phenomenon is that the quality, organization, and maturation of the matrix is more important than its pure enhanced secretion. In addition, gene expression patterns indicate that persistent coagulation and reduced fibrinolysis in 129 may contribute to the instability of the injury site.
The 129 model resembles the more common cardiac rupture of the pre-reperfusion era (type III), characterized by transmural myocardial necrosis with hemorrhagic transformation in the central region (Becker and van Mantgem, 1975). The present study pinpoints the modulation of the early transition from IR to Myofb as a critical determinant for risk of rupture and pathological remodeling in the 129 model and proffers mechanistic insights into the previously reported beneficial effects of fibrinolytic and anti-RAS therapies in these patients (Bates, 2014, Honda et al., 2014). It presents a comprehensive profile of cell types and pathways for the modulation of fibrosis as a critical intervention post-MI, providing potential targets for anti-fibrotic intervention. The detailed transcriptomic analysis of cardiac interstitial cells at different time points post-MI provides a benchmark for comparative analyses of potential differences in cell composition and dynamics of genetically diverse models with different reparative outcomes. Future mapping of the networks controlling the fibroblast IR state promises to identify specific features conferring susceptibility and resilience to cardiac rupture, enabling patient stratification and the development of precision therapies.
STAR★Methods
Key Resources Table
| REAGENT or RESOURCE | SOURCE | IDENTIFIER |
|---|---|---|
| Antibodies | ||
| Rabbit monoclonal anti-Wilms Tumor Protein | Abcam | Cat# ab89901; RRID: AB_2043201 |
| Goat polyclonal anti-mouse Dkk3 | R&D Systems | Cat# AF948; RRID: AB_355734 |
| Rabbit polyclonal anti-CTHRC1 | Thermo Fisher Scientific | Cat# PA5-49638; RRID: AB_2635092 |
| Mouse Monoclonal Anti- alpha-Smooth Muscle antibody | Sigma-Aldrich | Cat# A5228; RRID: AB_262054 |
| Mouse Monoclonal Anti-Metallothionein Antibody, Clone UC1MT | Enzo Life Sciences | Cat# ADI-SPA-550-D; RRID: AB_2039383 |
| Rat monoclonal anti-CD45 (Leukocyte Common Antigen, Ly-5) antibody | BD Biosciences | Cat# 550539; RRID: AB_2174426 |
| Rabbit Polyclonal anti-CLU, clone RB18701 | MyBioSource | Cat# MBS9215265 |
| Rat monoclonal anti-Sfrp2, Clone 331022 | R&D Systems | Cat# MAB1169; RRID: AB_2187093 |
| Donkey anti-Goat IgG (H+L) Cross-Adsorbed Secondary Antibody, Alexa Fluor 568 | Thermo Fisher Scientific | Cat# A-11057; RRID: AB_2534104) |
| Goat anti-Mouse IgG (H+L) Highly Cross-Adsorbed Secondary Antibody, Alexa Fluor 568 | Thermo Fisher Scientific | Cat# A-11031; RRID: AB_144696 |
| Goat anti-Rat IgG (H+L) Cross-Adsorbed Secondary Antibody, Alexa Fluor 647 | Thermo Fisher Scientific | Cat# A-21247; RRID: AB_141778 |
| Goat anti-Mouse IgG2a Cross-Adsorbed Secondary Antibody, Alexa Fluor 647 | Thermo Fisher Scientific | Cat# A-21241; RRID: AB_2535810 |
| Goat anti-Rabbit IgG (H+L) Cross-Adsorbed Secondary Antibody, Alexa Fluor 647 | Thermo Fisher Scientific | Cat# A-21244; RRID: AB_2535812 |
| Anti-Mouse CD32/CD16 - Purified Functional Grade; Clone 2.4G2 antibody | Leinco Technologies | Cat# C381; RRID: AB_2737484 |
| APC/Cyanine7 anti-mouse CD45 antibody | BioLegend | Cat# 103115; RRID: AB_312980 |
| PE-Cy7 Rat Anti-Mouse CD31 Clone 390 (RUO) | BD Biosciences | Cat# 561410; RRID: AB_10612003 |
| Chemicals, Peptides, and Recombinant Proteins | ||
| DRAQ5 | eBioscience | Cat# 65-0880-92 |
| Propidium Iodine | Sigma-Aldrich | Cat# P4864 |
| DAPI (4’,6-Diamidino-2-Phenylindole, Dihydrochloride) | Thermo Fisher | Cat# D1306; RRID: AB_2629482 |
| Critical Commercial Assays | ||
| 10x Chromium system using version 2 chemistry | 10x Chromium | Cat# CG00052 |
| RNAqueous-Micro Total RNA Isolation Kit | Thermo Fisher | Cat# AM1931 |
| SuperScript IV VILO Master Mix with ezDNase Enzyme | Thermo Fisher | Cat#11766050 |
| Dead Cell Removal MicroBeads | Miltenyi Biotec | Cat# 130-090-101 |
| Deposited Data | ||
| Genome Reference Consortium Mouse Build 38 | NCBI | GRCm38/mm10 |
| 129 reference genome | This paper using g2gtools | N/A |
| Gene Ontology terms database | Mouse Genome Informatics (MGI) | http://www.informatics.jax.org/downloads/reports/gene_association.mgi.gz |
| scRNaseq data from this paper | Array Express repository | ArrayExpress: E-MTAB-7895 |
| ZsGreen coding sequence | RRID: Addgene_22798 | |
| Experimental Models: Organisms/Strains | ||
| Mouse: B6.Cg-Gt(ROSA)26Sortm6(CAG-ZsGreen1)Hze/J | The Jackson Laboratory | JAX: 007906 |
| Mouse: Tg(Wt1-cre)#Jbeb | del Monte et al., 2011, Wessels et al., 2012 | MGI: 5308608 |
| Mouse: B6.Cg-Tg(Tek-cre)12Flv/J | The Jackson Laboratory | JAX: 004128 |
| Mouse: Tg(Col1a1-EGFP)#Dab | Yata et al., 2003 | MGI: 4458034 |
| Mouse: NZO/HlLtJ | The Jackson Laboratory | JAX:002105 |
| Mouse: WSB/EiJ | The Jackson Laboratory | JAX: 001145 |
| Mouse: NOD/ShiLtJ | The Jackson Laboratory | JAX: 001976 |
| Mouse: 129S1/SvImJ | The Jackson Laboratory | JAX: 002448 |
| Mouse: PWK/PhJ | The Jackson Laboratory | JAX: 0003715 |
| Mouse: CAST/EiJ | The Jackson Laboratory | JAX: 000928 |
| Mouse: A/J | The Jackson Laboratory | JAX: 000646 |
| Mouse: C57BL/6J | The Jackson Laboratory | JAX: 000664 |
| Mouse: DBA/2J | The Jackson Laboratory | JAX: 000671 |
| Oligonucleotides | ||
| Primers designed for this study; see STAR Methods and Method Details | This paper | N/A |
| Primers for HPRT | Furtado et al., 2014 | N/A |
| Primers for Rpl4 | Ruiz-Villalba et al., 2017 | N/A |
| Software and Algorithms | ||
| Vevo LAB software | FUJIFILM/VisualSonics Inc., Canada | https://www.visualsonics.com/product/software/vevo-lab |
| CellRanger v2.1 | 10x Genomics | https://support.10xgenomics.com/single-cell-gene-expression/software/pipelines/latest/installation |
| STAR aligner | Dobin et al., 2013 | STAR; RRID:SCR_015899 |
| g2gtools | Keane et al., 2011 | https://github.com/churchill-lab/g2gtools |
| R version 3.4.1 | R Development Core Team, 2017 | https://cran.r-project.org/bin/macosx/ |
| Seurat software package version 2.3.4 | Butler et al., 2018, Macosko et al., 2015 | Seurat; RRID:SCR_016341 |
| SPRING | Weinreb et al., 2018 | https://kleintools.hms.harvard.edu/tools/spring.html |
| DoubletFinder | McGinnis et al., 2019 | https://github.com/chris-mcginnis-ucsf/DoubletFinder |
| Harmony R package version 0.0.0.9000 | Korsunsky et al., 2019 | https://omictools.com/harmony-2-tool |
| MAST software | Finak et al., 2015 | MAST; RRID:SCR_016340 |
| Ingenuity Pathway Analysis | QIAGEN | Ingenuity Pathway Analysis; RRID:SCR_008653 |
| Panther | Mi et al., 2019 | PANTHER, RRID:SCR_004869 |
| LAS software v4.8 | Leica | Leica Application Suite; RRID:SCR_016555 |
| Fiji version 1.0 | Schindelin et al., 2012 | Fiji, RRID:SCR_002285 |
| LASX | Leica | Leica Application Suite X; RRID:SCR_013673 |
Lead Contact and Materials Availability
Further information and requests for resources and reagents should be directed to and will be fulfilled by the Lead Contact, Elvira Forte (elvira.forte@jax.org). This study did not generate new unique reagents.
Experimental Model and Subject Details
Animal models
All animal procedures were approved by the JAX Institutional Animal Care and Use Committee (IACUC) under the license 16010 and comply with NIH regulations. For constitutive epicardial genetic tracing, males from the Wt1Cre transgenic line (del Monte et al., 2011, Wessels et al., 2012) were crossed with the reporter B6.Cg-Gt(ROSA)26Sortm6(CAG-ZsGreen1)Hze/J (named ZsGreenf/+ in this work; JAX stock #007906) (Madisen et al., 2010). For constitutive endocardial genetic tracing, the same reporter was crossed with B6.Cg-Tg(Tek-cre)12Flv/J mice (TekCre; JAX stock #004128) (Koni et al., 2001). The previously described Col1a1eGFP transgenic mice were used as a cardiac fibroblast marker for validation experiments (Yata et al., 2003). Nine different inbred strains were subjected to myocardial infarction to evaluate the reparative outcome: NZO/HlLtJ (JAX stock #002105), WSB/EiJ (JAX stock #001145), NOD/ShiLtJ (JAX stock #001976), 129S1/SvImJ (JAX stock #002448), PWK/PhJ (JAX stock #0003715), CAST/EiJ (JAX stock #000928), A/J (JAX stock #000646), C57BL/6J (JAX stock #000664) and DBA/2J (JAX stock #000671).
Method Details
Myocardial infarction
Myocardial infarction was performed as previously described (Salimova et al., 2019) on young adult males (10-12-week-old.) Briefly, the left anterior descending branch of the coronary artery (LAD) was permanently ligated above branching, about 1mm below the tip of the left auricle. Only mice with > 30% left ventricular ischemia were used for analysis. The mouse thoracic cavity was then closed and sutured. Sustained release 0.05 μg/g buprenorphine gel formulation was administered subcutaneously at the time of surgery for analgesia. Bipuvicane has administered locally to chest suture site. Mice were individually monitored daily for the first 7 days, followed by weekly monitoring until the endpoint of experiments. Survival rates were also assessed at 28 days. Myocardial rupture (days 3-5) was confirmed by necropsy. Sudden death (days 0-1) was determined by death in the absence of rupture. Heart failure was determined by assessment of body condition score (poor mobility, grooming, hunching, etc) on live animals before euthanasia. Sham surgeries were performed in the same way as infarcts, except that after pericardial tearing the animal was sutured without ligation of the coronary artery. Functional analyses were performed at baseline (before surgery) and 28 days post-surgery. Vevo 2100 ultrasound imaging system (FUJIFILM/VisualSonics Inc., Canada) was used for morphological and functional evaluation of hearts. Animals were anesthetized with isoflurane with controlled body temperature and heart rate for functional imaging. Baseline measurements were obtained using parasternal long (PSLAX) and short (SAX) axis B-mode imaging. Used parameters were endocardial and epicardial length and area in systole and diastole.
Single Cell Isolation
The protocol for cell isolation was adapted from Chong et al. (2011). Heart ventricles were dissociated, mechanically cut into small pieces with a scalpel and subjected to two 15min digestions with 263U/ml collagenase type II (Worthington Biochemical Corporation, LS004177), under magnetic stirring at 250rpm, 37°C. The cell suspension was passed through a 40 μm cell strainer to remove cardiomyocytes, small fragment of undigested tissue and collected on ice in a conical 50ml tube containing 2%FCS (VWR Seradigm, 97068-085) in PBS. Cells were spun at 300g for 5 min and pre-warmed red cell lysis buffer (Sigma-Aldrich, R7757) was added for 1 min to remove blood cells. After washing, cell pellets were resuspended in 200 μL Dead Cell Removal MicroBeads (Miltenyi Biotec, 130-090-101) and incubated 10 min at room temperature in the dark. The mix of cells and beads was diluted in binding buffer (Miltenyi Biotec, 130-090-101) and an AutoMACS Separator was used to deplete dead cells bound to the magnetic beads.
After centrifugation at 400g for 5 min, cells were resuspended in 2%FCS+2mM EDTA and stained with 2μM DRAQ5 (eBioscience, 65-0880-92) followed by 3 μM Propidium Iodine (Sigma-Aldrich, P4864) after 5min. Single live nucleated cells were sorted on a BD AriaII with 130μm nozzle to minimize pressure over cells (12psi). 16-32,000 events were sorted in 0.04%BSA, centrifuged for 8min at 400g, resuspended and diluted to 320-400cells/μl for scRNaseq (10x Genomics).
Single-cell transcriptome barcoding and library preparation for Illumina sequencing
Single cell capture, barcoding and library preparation were performed with the 10x Chromium system using version 2 chemistry, according to the manufacturer’s protocol (10x Genomics, #CG00052). Approximately 12,000 cells were loaded into one lane of a 10x Chromium microfluidic chip. 1 channel was used per sample (11 total) on 3 chips. Following capture and lysis, cDNA was synthesized and amplified (12 cycles) as per manufacturer’s protocol (10x Genomics). The amplified cDNA from each channel was used to construct an Illumina sequencing library. cDNA and libraries were checked for quality on an Agilent 4200 TapeStation, quantified by KAPA qPCR, and sequenced on an Illumina HiSeq 4000 with 150 cycle sequencing to an average depth of 46,000 reads per cell. Detailed information on the cDNA and library yield, sequencing saturation and estimated number of captured cells per sample can be found in Table S1.
Single-cell RNA-seq data analysis
Processing of sequencing reads
Raw Illumina data were processed using CellRanger v2.1 (10x Genomics) to convert Illumina basecall files to FASTQ format, align sequencing reads to the appropriate genome using the STAR aligner (Dobin et al., 2013), and quantify gene expression. For cells isolated from B6J mice, the mouse reference genome (GRCm38/mm10) was used with an extra contig added to allow alignment of reads derived from transgenic ZsGreen sequence. Specifically, the sequence of the plasmid used to generate the transgenic mouse was obtained from http://www.addgene.org/browse/sequence/162422/. The 1680bp used sequence included the complete ZsGreen coding sequence, a downstream 589bp WPRE sequence, and the poly(A) signal. For cells isolated from 129 mice, variant calls from the Mouse Genomes Project (Keane et al., 2011) were obtained and g2gtools (https://github.com/churchill-lab/g2gtools) was used to replace single nucleotide variants, insertions, and deletions in the reference genome to create a 129-specific reference genome to which reads were aligned. Individual sequencing runs were processed using the “cellranger count” command, and aggregated runs from all time points processed using the “cellranger aggr” command, specifying argument “–normalize=mapped” for depth normalization.
Data quality control, normalization, clustering, and marker analysis
The Seurat software package version 2.3.4 (Butler et al., 2018, Macosko et al., 2015) was used in R version 3.4.1 (R Development Core Team, 2017) to analyze processed scRNA-Seq data. Data from 38,555 cells that passed CellRanger’s quality control steps were obtained. 36,847 cells were retained after filtering out cells in which < 500 or > 5,000 genes were detected; > 10% of reads derived from mitochondria; or > 15,000 UMIs were sequenced. Expression of 27,999 transcripts was quantified, of which 18,862 were expressed in at least one cell. Read counts were normalized using log transformation. Cell cycle stage was estimated and regressed out using methods implemented in Seurat (and detailed at https://satijalab.org/seurat/v3.0/cell_cycle_vignette.html). In addition to cell cycle stage, the number of genes detected, number of UMIs detected, and percentage of mitochondrial reads were also regressed out. Variable genes were detected using the Seurat function FindVariableGenes with default parameters except y.cutoff = 0.5. Dimensionality reduction was used to explore transcriptional heterogeneity and for clustering. Specifically, PCA was used for dimensionality reduction. The first 24 principal components (PCs) were used as input for a graph-based approach to cluster cells by cell type using resolution 0.5 and as input to t-SNE for reduction to two dimensions to facilitate visualization (Villani et al., 2017).
Average expression of all genes per time-point and per cluster were obtained. Two Seurat functions were employed to identify marker genes: FindAllMarkers() to compare each cluster with all the others, and FindMarkers() for pairwise comparisons among clusters/sub-clusters. For each marker gene of clusters, the average fold change (avg_logFC), percentage of expression in each specific cluster (pct.1), percentage of expression in all the other clusters (pct.2), and adjusted p-value (p_val_adj) were calculated, as reported in Tables S2, S3, and S4). Avg-logFC was chosen to represent cluster-specific markers.
SPRING visualization
The used SPRING (Weinreb et al., 2018) viewer web-interface that can be found at https://kleintools.hms.harvard.edu/tools/spring.html. For visualization, the following parameters were used: Number of PCA dimensions = 25; Gene filtering - minimum counts = 3; Gene filtering - gene variability percentile = 80.0; Number of nearest neighbors = 5; Cell filtering - minimum counts = 0.0; Gene filtering - minimum cells = 3.0. Data matrixes of clusters of interest retrieved from the Seurat object containing all time-points were uploaded. List of genes, clustering and temporal information derived from meta data associated with the Seurat objects were also provided.
Stromal cell sub-clustering
In order to explore transcriptional heterogeneity within stromal cell clusters, the complete matrix of single cell transcriptomes and the data from selected populations (Fibroblasts I, Fibroblasts II, Fibroblasts III, Myofibroblasts and Epicardium; clusters 0,4,6,7,12) were re-normalized and clustered. Specifically, highly variable genes were identified, and the gene expression matrix was reduced in dimensionality using PCA. The first 20 PCs were selected and a graph-based clustering method implemented in Seurat was employed to cluster cells (resolution 0.5).
Doublets prediction
Cell doublets were predicted using DoubletFinder version 2.0.2 (McGinnis et al., 2019, https://github.com/chris-mcginnis-ucsf/DoubletFinder). DoubletFinder identifies doublets according to each cell’s gene expression proximity to artificial doublets created by averaging the transcriptional profile of randomly chosen cell pairs. DoubletFinder was run independently on each single cell library from the 7 time point experiment, to ensure that simulated doublets did not include cells from different libraries which would be impossible to observe. For all libraries, a 6% (true) doublet rate was assumed, 25 principal components were used, and the default value of 25% was used for pN (the number of generated artificial doublets expressed as a proportion of the merged real-artificial data). For each library, the PC neighborhood size pK was estimated using as the maxima of the distribution of mean-variance normalized bimodality coefficient scores, as suggested by the developers.
Integration of data from different murine strains
Single cell transcriptomes derived from mice of different genetic backgrounds require careful integration before joint analysis can be performed. In particular, the same cell type may show variability in gene expression in genetically distinct mice due to genetic regulation of gene expression. The Harmony R package version 0.0.0.9000 (Korsunsky et al., 2019) was used to integrate data from B6J and 129 cells. This software takes cells from the strains and projects them onto a shared embedding, allowing for joint clustering and analysis of the combined data. Before running Harmony, data were processed using simple criteria with the Seurat package. First, raw data matrices were read from each 10x Chromium sample. 18,006 genes quantified in both B6J and 129 backgrounds were retained for further analysis. Second, cells were filtered using automated criteria. Cells with a very low or high number of UMIs or number of genes expressed were filtered (minimum 1000 UMI and 500 genes expressed; cells with a UMI [number of genes] count greater than three standard deviations from the mean UMI [number of genes] count of all cells were discarded). Furthermore, cells with > 30% mitochondrial reads were discarded. Third, the top 1000 variable genes were identified. Fourth, data were normalized, with signal due to the number of UMI and percent mitochondrial reads regressed out. Fifth, PCA was conducted on the complete dataset including B6J d0 - 6608 cells; B6J sham, n = 2 - 4710 cells; 129 sham - 4213 cells; d3 MI B6J - 3950 cells; d3 MI 129 - 4128 cells. To run Harmony, 80 PCs were used and the RunHarmony() function available at https://github.com/immunogenomics/harmony was used to integrate data with parameters: theta = 1; max.iter.harmony = 20. Finally, t-SNE was computed and cells were clustered using the graph-based clustering method implemented in Seurat.
Differential gene expression across different strains
The MAST software(Finak et al., 2015) was used to enquire differential gene expression between strains in different conditions (sham and d3 post-MI). Tests were carried out using the MASTcpmDetRate method (Soneson and Robinson, 2018).This method tests for differences using log- and library size-normalized counts, with cellular detection rate as a covariate, and was among the most powerful and accurate methods for differential expression analysis of single cell RNA-Seq (Soneson and Robinson, 2018). Analysis of the differentially expressed genes to identify enrichment of particular biological functions was performed using Ingenuity Pathway Analysis (QIAGEN) and Panther (Mi et al., 2019). The score of each relevant GO-term was calculated as the ratio of the number of query genes associated with the term divided by the total number of genes in the genome associated with the term. Lists of mouse genes associated with each GO term were obtained from the Mouse Genome Informatics database at the link http://www.informatics.jax.org/downloads/reports/gene_association.mgi.gz (accessed January 14, 2019).
Tissue processing for cryosectioning
Following animal euthanasia, hearts were perfused with 1x HBSS, transferred to 0.5mM KCl for cardiac cycle arrest in diastole, fixed in 4% paraformaldehyde (PFA) for 30min-1 hour at 4°C, permeated with 30% sucrose overnight at 4°C and embedded in Fisher Healthcare Tissue OCT Compound on dry ice. 8 μm cryosections were obtained using the Cryostar NX70 (Thermo Fisher).
Immunofluorescence
Cryosections were dried for two hours at room temperature, re-fixed in 2% PFA for 10 min, permeabilized with 0.5% Triton for 15 min, blocked with 5% BSA in 50mM Glycine PBS, and stained with primary antibodies diluted in blocking solution, overnight at 4°C. The following antibodies were used: WT1(1:100, Abcam, ab89901), DKK3 (1:100, R&D Systems, AF948), CTHRC1 (1:100, Thermo Fisher, PA5-49638), ACTA2 (1:100, Sigma Aldrich, A5228, clone 1A4), MT1a (1:100, Enzo Life Sciences, ADI-SPA-550-D), CD45 (1:100, BD Biosciences, 550539, clone 30-F11), CLU (1:100, MyBioSource, MBS9215265, clone RB18701), SFRP2 (1:50, R&D Systems, MAB1169, clone 331022). Used secondary antibodies were Invitrogen Alexa Fluor 568 Donkey anti-Goat (A-11057), Goat anti-Mouse (A-11031), Goat anti-Rabbit (A-11011); Alexa Fluor 647 Goat anti-Rat (A-21247), Goat anti-mouse IgG2a (A-21241), and Goat anti-Rabbit (A-21244) diluted 1:500 or 1:1000 in PBS. Nuclei were stained with DAPI (0.1μg/ml, Thermo Fisher, D1306).
Imaging
Bright field and fluorescent whole mount images of full hearts were captured on a stereo-microscope (Leica, MZ10F), equipped with a color/fluorescence camera (Leica, DFC 450c). Scale bars were added and images processed using the LAS software v4.8. Immunofluorescence images were acquired using either an upright fluorescent microscope (Zeiss, Axio Imager.Z2), equipped with X-Cite 120LED excitation source (Excelitas Technologies), using a 20x objective (Zeiss, Plan-Apochromat” 20x/0.8), and the ZEN2 software (Zeiss, blue edition) for acquisition, or using confocal imaging (SP8-AOBS, Leica) with 40x (Leica, HC PL APO 40x/1.30 Oil CS2, FWD = 0.24 mm) or 63x (Leica, HC PL APO 63x/1.40 Oil CS2, FWD = 0.14) objectives, using very-high sensitivity HyD detectors for the emission of 488, 561 and 633 lasers, and the LASX software. At least 3 independent rounds of stainings were done and images were acquired keeping same setting across all time-points used in the comparison analysis. All quantification and image processing were performed using Fiji version 1.0 (Schindelin et al., 2012). Z stacks with 0.5 μm step size were converted by Z-projection of the average intensity for each channel. Individual channels were merged and pseudo-colored.
Flow cytometry and cell sorting for bulk RNA isolation
For qPCR validations, interstitial cells were isolated as described above, from the whole ventricles of control mice or scar area and distal area in injured mice. In experiments with Coll1a1eGFP mice, GFP+DRAQ5+PI- cells were sorted on Aria II with 130 μm nozzle. In absence of a fluorescent reporter (129, B6J mice), cells were first resuspended in blocking solution containing anti-mouse CD16/CD32 (1:600, Leinco Technologies, C381, clone 2.4G2) in 2% FCS 5min at RT, then stained with APC/Cyanine7 anti-mouse CD45 (1:660, BioLegend, 103115, clone 30-F11), PE-Cy7 anti-mouse CD31 (1:800, BD Biosciences, 561410, clone 390) on ice for 15min. After washing in PBS, cells were resuspended in 2%FCS+2mM EDTA and DAPI (50ng/ml) before sorting on the AriaII for DAPI-CD45-CD31-cells.
RNA extraction and quantitative PCR
RNA was isolated from bulk sorted cells using the RNAqueous-Micro Total RNA Isolation Kit (Thermo Fisher, AM1931), according to manufacturer’s instructions. cDNA synthesis was performed using the SuperScript IV VILO Master Mix with ezDNase Enzyme (Thermo Fisher, 11766050). qPCR reactions were performed using Power SYBR Green PCR Master Mix (Thermo Fisher, 4367659) on ViiA 7 Real-Time PCR System with 384-Well Block (Thermo Fisher). 4ng of RNA were loaded per reaction. Primers were designed using IDT primer design tool and BLAST, tested with standard curves on 4 serial 5-fold dilutions. The following primers were used: Comp F: 5′-ACATAGATGGCGACCGAATAC-3′, R: 5′-CCTCTGGTCTGGGTTATCTTTC-3′; Acta2 F: 5′-TCTTTCATTGGGATGGAGTCAG-3′, R: 5′-GACAGGACGTTGTTAGCATAGA-3′; Cthrc1 5′-CCCATCGAAGCCATCATCTATC-3′, R: 5′-TCACAGAGTCCTTCCACAGA-3′; Sfrp2 F: 5′-AGAGGAAGCTCCCAAGGT-3′, R: 5′-GGTGTCTCTGTTGATGTACGTTAT-3′; Ecrg4 F: 5′-CTGGGTCCAGATGGCATAAG-3′, R: 5′- GTTCTCGGCTACAGCTACATT-3′; Wisp2 F: 5′-TTGAAGCTGGCTCCACAAG-3′; R: 5′-GGGCATACACCATTGAGAGAAT-3′; Meox1 F: 5′-GGGAGGATTGCATGGTACTT-3′, R: 5′-CTGGTTGTCTGACCTCTCTTT-3′; Col8a1 F: 5′-GCTCAAGAAGCTGTTCTGTAAATC-3′, R: 5′-CCAGTAGAATCGAGGACCAAAG-3′; Tnc F: 5′-CCAGGGTTGCCACCTATTT-3′, R: 5′-GTCTAGAGGATCCCACTCTACTT-3′; Thbs4 F: 5′-GCTCCTTGGAGAGGTGAAAG-3′, R: 5′-AAAGCTGAGAGGACCACAAG-3′; Cxcl14 F: 5′-GCTCTTGGTGGTGACGATAA-3′, R: 5′-GCTACAGCGACGTGAAGAA-3′; Saa3 F: 5′-GCCTTCCATTGCCATCATTC-3′, R: 5′-CACATGTCTCTAGACCCTTGAC-3′; Serpina3n F: 5′-TGCAGTCTACAGAGCTGAAACC-3′, R: 5′-CAACCCTGAACATCGGGAGT-3′; Fn1 F: 5′-TCCTGTCTACCTCACAGACTAC-3′, R: 5′-GTCTACTCCACCGAACAACAA-3′; F2r F: 5′-TGGAGGGTAGGGCAGTCTAC-3′, R: 5′-GTGTACACGGAGGGCATGAA-3′; Serpine1 F: 5′-TCCACAAGTCTGATGGCAGC-3′, R: 5′-TGGTAGGGCAGTTCCACAAC −3′; Plat F: 5′-CGAAAGCTGACGTGGGAATA-3′, R: 5′-GTGTGAGGTGATGTCTGTGTAG-3′; Anxa2 F: 5′-CAAGACCAAAGGAGTGGATGAG-3′, R: 5′-CTGATAGGCGAAGGCAATGT-3′; Dcn F: 5′-CTGGCCAATGTTCCTCATCT-3′, R: 5′- AAGGTAGACGACCTGGATATACT-3′;Col5a1 F: 5′-CACCTTGATCCTCGACTGTAAG-3′, R: 5′-TGTTGGATGTCACCCTCAAATA-3′; Col4a2 F: 5′-ACAATCACCACCAAAGGGGA-3′, R: 5′-GGAATCCATCCAGCCCATCC-3′; Fbln5 F: 5′-TGTCTGCGTTTGCTCTATGT-3′, R:5′-GAGTATCATGCGTCTCTGTCTG-3′; Mfap5 F: 5′-AGTCCTGCTTCACCAGTTTAC-3′, R: 5′-GGCAAAGCTCATCTTTCATAGC-3′; Thbs1 F: 5′-GCCTCTCCTGTGATGAACTATC −3′, R: 5′-CTCTGTTCTCTTCCGTCACTTT-3′; Serping1 F: 5′-GCTGAGAACACCAACCATAAGA-3′, R: 5′-CCACTTGGCACTCAAGTAGAC-3′; Tgfb1 F: 5′-CTGAACCAAGGAGACGGAATAC-3′,R: 5′-GGGCTGATCCCGTTGATTT-3′; Hprt1 (Furtado et al., 2014) F: 5′-GCGAGGGAGAGCGTTGGGCT-3′, R: 5′-CATCATCGCTAATCACGACGCTGGG-3′; Rpl4 (Ruiz-Villalba et al., 2017) F: 5′-GCCGCTGGTGGTTGAAGATAA-3′, R: 5′-CGTCGGTTTCTCATTTTGCCC-3′.
Quantification and Statistical Analysis
Number of biological replicates and statistical significance are specified in figures and figure legends. For Echocardiography baseline measurements of B6J (n = 14) and 129 (n = 13) strains, an average of 3 measurements of each parameter were obtained per animal (standard deviation < 0.5). To evaluate the response to MI of different inbred strains the following mice were used: NOD/ShiLtJ, n = 13, NZO/HILtJ, n = 16, 129S1/SvlmJ, n = 34, DBA/2J; n = 9, A/J; n = 14, CAST/EiJ, n = 18; WSB/EiJ, n = 12, PWK/PhJ, n = 11, C57BL/6J n = 13.
For immunostaining quantification, we used 5-6 fields per time-point and calculated mean and standard error of the mean. Unpaired, two-tailed Student’s t test was used for pairwise comparison of data between groups. P value of less than 0.05 was considered significant. For qPCR analysis we used 3 technical replicates of 3 biological replicates. We calculated eˆ- ΔΔCt, where e is the efficiency of each primer pair derived from the standard curve, ΔΔCt is obtained by normalizing Ct values on the geometric mean of two housekeeping genes (Rpl4 and Hprt1) over the refence sample. The median, 25th and 75th percentile, maximum and minimum values are represented with box and whisker plots. For statistical analysis, unpaired two-tailed Student’s t test, which compares the relative expression values of each gene to the values of the reference sample used for normalization. P-value of less than 0.05 was considered significant. Excel v16.16.7 and GraphPad Prism v7.0 were used for the analysis, generation of graphs and statistics. For differential gene expression analysis between 129 and B6J, a threshold of 2-fold expression change and P-value 0.01 were used. False discovery rate (FDR)-corrected P-values were used for sorting the results from Panther analysis. P-values of overlap and Benjamini-Hochberg (B-H) corrected P -values were used for the upstream regulators and canonical pathway analysis respectively (Ingenuity Pathway Analysis, QIAGEN). For the Kaplan-Meier survival plot, statistical significance was calculated using the Gehan-Breslow-Wilcoxon test.
Data and Code Availability
Data resources
R scripts utilized in the study can be obtained upon request. The accession number for the sequencing data reported in this paper is ArrayExpress: E-MTAB-7895.
Acknowledgments
We thank Dr. Susanne Sattler for insightful comments and Maureen Ekwebelem, intern with the Jackson Laboratory summer student program. We acknowledge the use of JAX Flow Cytometry, Microscopy, Single Cell Sequencing, and Computational Cores. JAX Cores are supported by the Jackson Laboratory Cancer Center grant (P30 CA034196). This work was further supported by the JAX Director’s Innovation Fund, the British Heart Foundation, and the Leducq Foundation Transatlantic Network of Excellence in Cardiac Research.
Author Contributions
Conceptualization, E.F. and M.B.F.; Methodology, E.F., D.A.S., and M.B.F.; Software, D.A.S., M.C., V.M.P., and E.F.; Investigation, E.F., K.A.M., S.D., M.B.F., and M.W.C.; Resources, O.H.; Data Curation, D.A.S. and M.C.; Writing – Original Draft, E.F., D.A.S., and M.B.F.; Writing – Review & Editing, E.F., D.A.S., and N.A.R.; Visualization, E.F. and M.B.F.; Supervision, E.F. and M.B.F.; Project Administration, M.B.F.; Funding Acquisition, N.A.R. and M.B.F.
Declaration of Interests
The authors declare no competing interests.
Published: March 3, 2020
Footnotes
Supplemental Information can be found online at https://doi.org/10.1016/j.celrep.2020.02.008.
Contributor Information
Elvira Forte, Email: elvira.forte@jax.org.
Milena B. Furtado, Email: mfurtado@amgen.com.
Supplemental Information
References
- Ackers-Johnson M., Tan W.L.W., Foo R.S. Following hearts, one cell at a time: recent applications of single-cell RNA sequencing to the understanding of heart disease. Nat. Commun. 2018;9:4434. doi: 10.1038/s41467-018-06894-8. [DOI] [PMC free article] [PubMed] [Google Scholar]
- Arlein W.J., Shearer J.D., Caldwell M.D. Continuity between wound macrophage and fibroblast phenotype: analysis of wound fibroblast phagocytosis. Am. J. Physiol. 1998;275:R1041–R1048. doi: 10.1152/ajpregu.1998.275.4.R1041. [DOI] [PubMed] [Google Scholar]
- Barrick C.J., Rojas M., Schoonhoven R., Smyth S.S., Threadgill D.W. Cardiac response to pressure overload in 129S1/SvImJ and C57BL/6J mice: temporal- and background-dependent development of concentric left ventricular hypertrophy. Am. J. Physiol. Heart Circ. Physiol. 2007;292:H2119–H2130. doi: 10.1152/ajpheart.00816.2006. [DOI] [PubMed] [Google Scholar]
- Bates E.R. Reperfusion therapy reduces the risk of myocardial rupture complicating ST-elevation myocardial infarction. J. Am. Heart Assoc. 2014;3:e001368. doi: 10.1161/JAHA.114.001368. [DOI] [PMC free article] [PubMed] [Google Scholar]
- Baum J., Duffy H.S. Fibroblasts and myofibroblasts: what are we talking about? J. Cardiovasc. Pharmacol. 2011;57:376–379. doi: 10.1097/FJC.0b013e3182116e39. [DOI] [PMC free article] [PubMed] [Google Scholar]
- Becker A.E., van Mantgem J.P. Cardiac tamponade. A study of 50 hearts. Eur. J. Cardiol. 1975;3:349–358. [PubMed] [Google Scholar]
- Bouzegrhane F., Thibault G. Is angiotensin II a proliferative factor of cardiac fibroblasts? Cardiovasc. Res. 2002;53:304–312. doi: 10.1016/s0008-6363(01)00448-5. [DOI] [PubMed] [Google Scholar]
- Brew K., Nagase H. The tissue inhibitors of metalloproteinases (TIMPs): an ancient family with structural and functional diversity. Biochim. Biophys. Acta. 2010;1803:55–71. doi: 10.1016/j.bbamcr.2010.01.003. [DOI] [PMC free article] [PubMed] [Google Scholar]
- Butler A., Hoffman P., Smibert P., Papalexi E., Satija R. Integrating single-cell transcriptomic data across different conditions, technologies, and species. Nat. Biotechnol. 2018;36:411–420. doi: 10.1038/nbt.4096. [DOI] [PMC free article] [PubMed] [Google Scholar]
- Chien K.R., Frisén J., Fritsche-Danielson R., Melton D.A., Murry C.E., Weissman I.L. Regenerating the field of cardiovascular cell therapy. Nat. Biotechnol. 2019;37:232–237. doi: 10.1038/s41587-019-0042-1. [DOI] [PubMed] [Google Scholar]
- Chong J.J., Chandrakanthan V., Xaymardan M., Asli N.S., Li J., Ahmed I., Heffernan C., Menon M.K., Scarlett C.J., Rashidianfar A. Adult cardiac-resident MSC-like stem cells with a proepicardial origin. Cell Stem Cell. 2011;9:527–540. doi: 10.1016/j.stem.2011.10.002. [DOI] [PMC free article] [PubMed] [Google Scholar]
- Cunnington R.H., Northcott J.M., Ghavami S., Filomeno K.L., Jahan F., Kavosh M.S., Davies J.J., Wigle J.T., Dixon I.M. The Ski-Zeb2-Meox2 pathway provides a novel mechanism for regulation of the cardiac myofibroblast phenotype. J. Cell Sci. 2014;127:40–49. doi: 10.1242/jcs.126722. [DOI] [PubMed] [Google Scholar]
- De S.K., McMaster M.T., Andrews G.K. Endotoxin induction of murine metallothionein gene expression. J. Biol. Chem. 1990;265:15267–15274. [PubMed] [Google Scholar]
- del Monte G., Casanova J.C., Guadix J.A., MacGrogan D., Burch J.B., Pérez-Pomares J.M., de la Pompa J.L. Differential Notch signaling in the epicardium is required for cardiac inflow development and coronary vessel morphogenesis. Circ. Res. 2011;108:824–836. doi: 10.1161/CIRCRESAHA.110.229062. [DOI] [PubMed] [Google Scholar]
- Dobin A., Davis C.A., Schlesinger F., Drenkow J., Zaleski C., Jha S., Batut P., Chaisson M., Gingeras T.R. STAR: ultrafast universal RNA-seq aligner. Bioinformatics. 2013;29:15–21. doi: 10.1093/bioinformatics/bts635. [DOI] [PMC free article] [PubMed] [Google Scholar]
- Dong K., Guo X., Chen W., Hsu A.C., Shao Q., Chen J.F., Chen S.Y. Mesenchyme homeobox 1 mediates transforming growth factor-β (TGF-β)-induced smooth muscle cell differentiation from mouse mesenchymal progenitors. J. Biol. Chem. 2018;293:8712–8719. doi: 10.1074/jbc.RA118.002350. [DOI] [PMC free article] [PubMed] [Google Scholar]
- Duerr G.D., Dewald D., Schmitz E.J., Verfuerth L., Keppel K., Peigney C., Ghanem A., Welz A., Dewald O. Metallothioneins 1 and 2 Modulate Inflammation and Support Remodeling in Ischemic Cardiomyopathy in Mice. Mediators Inflamm. 2016;2016:7174127. doi: 10.1155/2016/7174127. [DOI] [PMC free article] [PubMed] [Google Scholar]
- Farbehi N., Patrick R., Dorison A., Xaymardan M., Janbandhu V., Wystub-Lis K., Ho J.W.K., Nordon R.E., Harvey R.P. Single-cell expression profiling reveals dynamic flux of cardiac stromal, vascular and immune cells in health and injury. eLife. 2019;8:e43882. doi: 10.7554/eLife.43882. [DOI] [PMC free article] [PubMed] [Google Scholar]
- Fernández-Borja M., Bellido D., Vilella E., Olivecrona G., Vilaró S. Lipoprotein lipase-mediated uptake of lipoprotein in human fibroblasts: evidence for an LDL receptor-independent internalization pathway. J. Lipid Res. 1996;37:464–481. [PubMed] [Google Scholar]
- Finak G., McDavid A., Yajima M., Deng J., Gersuk V., Shalek A.K., Slichter C.K., Miller H.W., McElrath M.J., Prlic M. MAST: a flexible statistical framework for assessing transcriptional changes and characterizing heterogeneity in single-cell RNA sequencing data. Genome Biol. 2015;16:278. doi: 10.1186/s13059-015-0844-5. [DOI] [PMC free article] [PubMed] [Google Scholar]
- Foglia M.J., Poss K.D. Building and re-building the heart by cardiomyocyte proliferation. Development. 2016;143:729–740. doi: 10.1242/dev.132910. [DOI] [PMC free article] [PubMed] [Google Scholar]
- Forte E., Furtado M.B., Rosenthal N. The interstitium in cardiac repair: role of the immune-stromal cell interplay. Nat. Rev. Cardiol. 2018;15:601–616. doi: 10.1038/s41569-018-0077-x. [DOI] [PubMed] [Google Scholar]
- Fu X., Khalil H., Kanisicak O., Boyer J.G., Vagnozzi R.J., Maliken B.D., Sargent M.A., Prasad V., Valiente-Alandi I., Blaxall B.C., Molkentin J.D. Specialized fibroblast differentiated states underlie scar formation in the infarcted mouse heart. J. Clin. Invest. 2018;128:2127–2143. doi: 10.1172/JCI98215. [DOI] [PMC free article] [PubMed] [Google Scholar]
- Furtado M.B., Costa M.W., Pranoto E.A., Salimova E., Pinto A.R., Lam N.T., Park A., Snider P., Chandran A., Harvey R.P. Cardiogenic genes expressed in cardiac fibroblasts contribute to heart development and repair. Circ. Res. 2014;114:1422–1434. doi: 10.1161/CIRCRESAHA.114.302530. [DOI] [PMC free article] [PubMed] [Google Scholar]
- Furtado M.B., Nim H.T., Boyd S.E., Rosenthal N.A. View from the heart: cardiac fibroblasts in development, scarring and regeneration. Development. 2016;143:387–397. doi: 10.1242/dev.120576. [DOI] [PubMed] [Google Scholar]
- Gao X.M., Dilley R.J., Samuel C.S., Percy E., Fullerton M.J., Dart A.M., Du X.J. Lower risk of postinfarct rupture in mouse heart overexpressing beta 2-adrenergic receptors: importance of collagen content. J. Cardiovasc. Pharmacol. 2002;40:632–640. doi: 10.1097/00005344-200210000-00018. [DOI] [PubMed] [Google Scholar]
- Gao X.M., Xu Q., Kiriazis H., Dart A.M., Du X.J. Mouse model of post-infarct ventricular rupture: time course, strain- and gender-dependency, tensile strength, and histopathology. Cardiovasc. Res. 2005;65:469–477. doi: 10.1016/j.cardiores.2004.10.014. [DOI] [PubMed] [Google Scholar]
- Gao X.M., Tsai A., Al-Sharea A., Su Y., Moore S., Han L.P., Kiriazis H., Dart A.M., Murphy A.J., Du X.J. Inhibition of the Renin-Angiotensin System Post Myocardial Infarction Prevents Inflammation-Associated Acute Cardiac Rupture. Cardiovasc. Drugs Ther. 2017;31:145–156. doi: 10.1007/s10557-017-6717-2. [DOI] [PubMed] [Google Scholar]
- Gerth J., Cohen C.D., Hopfer U., Lindenmeyer M.T., Sommer M., Gröne H.J., Wolf G. Collagen type VIII expression in human diabetic nephropathy. Eur. J. Clin. Invest. 2007;37:767–773. doi: 10.1111/j.1365-2362.2007.01864.x. [DOI] [PubMed] [Google Scholar]
- Halász K., Kassner A., Mörgelin M., Heinegård D. COMP acts as a catalyst in collagen fibrillogenesis. J. Biol. Chem. 2007;282:31166–31173. doi: 10.1074/jbc.M705735200. [DOI] [PubMed] [Google Scholar]
- Hara T., Tanegashima K. Pleiotropic functions of the CXC-type chemokine CXCL14 in mammals. J. Biochem. 2012;151:469–476. doi: 10.1093/jb/mvs030. [DOI] [PubMed] [Google Scholar]
- Honda S., Asaumi Y., Yamane T., Nagai T., Miyagi T., Noguchi T., Anzai T., Goto Y., Ishihara M., Nishimura K. Trends in the clinical and pathological characteristics of cardiac rupture in patients with acute myocardial infarction over 35 years. J. Am. Heart Assoc. 2014;3:e000984. doi: 10.1161/JAHA.114.000984. [DOI] [PMC free article] [PubMed] [Google Scholar]
- Iqbal S.M., Leonard C., Regmi S.C., De Rantere D., Tailor P., Ren G., Ishida H., Hsu C., Abubacker S., Pang D.S. Lubricin/Proteoglycan 4 binds to and regulates the activity of Toll-Like Receptors In Vitro. Sci. Rep. 2016;6:18910. doi: 10.1038/srep18910. [DOI] [PMC free article] [PubMed] [Google Scholar]
- Jaitin D.A., Kenigsberg E., Keren-Shaul H., Elefant N., Paul F., Zaretsky I., Mildner A., Cohen N., Jung S., Tanay A., Amit I. Massively parallel single-cell RNA-seq for marker-free decomposition of tissues into cell types. Science. 2014;343:776–779. doi: 10.1126/science.1247651. [DOI] [PMC free article] [PubMed] [Google Scholar]
- Jamil S., Mousavizadeh R., Roshan-Moniri M., Tebbutt S.J., McCormack R.G., Duronio V., Scott A. Angiopoietin-like 4 Enhances the Proliferation and Migration of Tendon Fibroblasts. Med. Sci. Sports Exerc. 2017;49:1769–1777. doi: 10.1249/MSS.0000000000001294. [DOI] [PubMed] [Google Scholar]
- Jenne D.E., Tschopp J. Clusterin: the intriguing guises of a widely expressed glycoprotein. Trends Biochem. Sci. 1992;17:154–159. doi: 10.1016/0968-0004(92)90325-4. [DOI] [PubMed] [Google Scholar]
- Jones S.E., Jomary C. Clusterin. Int. J. Biochem. Cell Biol. 2002;34:427–431. doi: 10.1016/s1357-2725(01)00155-8. [DOI] [PubMed] [Google Scholar]
- Jugdutt B.I. Ventricular remodeling after infarction and the extracellular collagen matrix: when is enough enough? Circulation. 2003;108:1395–1403. doi: 10.1161/01.CIR.0000085658.98621.49. [DOI] [PubMed] [Google Scholar]
- Keane T.M., Goodstadt L., Danecek P., White M.A., Wong K., Yalcin B., Heger A., Agam A., Slater G., Goodson M. Mouse genomic variation and its effect on phenotypes and gene regulation. Nature. 2011;477:289–294. doi: 10.1038/nature10413. [DOI] [PMC free article] [PubMed] [Google Scholar]
- Kittelberger R., Davis P.F., Flynn D.W., Greenhill N.S. Distribution of type VIII collagen in tissues: an immunohistochemical study. Connect. Tissue Res. 1990;24:303–318. doi: 10.3109/03008209009152157. [DOI] [PubMed] [Google Scholar]
- Koni P.A., Joshi S.K., Temann U.A., Olson D., Burkly L., Flavell R.A. Conditional vascular cell adhesion molecule 1 deletion in mice: impaired lymphocyte migration to bone marrow. J. Exp. Med. 2001;193:741–754. doi: 10.1084/jem.193.6.741. [DOI] [PMC free article] [PubMed] [Google Scholar]
- Koo B.H., Le Goff C., Jungers K.A., Vasanji A., O’Flaherty J., Weyman C.M., Apte S.S. ADAMTS-like 2 (ADAMTSL2) is a secreted glycoprotein that is widely expressed during mouse embryogenesis and is regulated during skeletal myogenesis. Matrix Biol. 2007;26:431–441. doi: 10.1016/j.matbio.2007.03.003. [DOI] [PubMed] [Google Scholar]
- Korsunsky I., Millard N., Fan J., Slowikowski K., Zhang F., Wei K., Baglaenko Y., Brenner M., Loh P.R., Raychaudhuri S. Fast, sensitive and accurate integration of single-cell data with Harmony. Nat. Methods. 2019;16:1289–1296. doi: 10.1038/s41592-019-0619-0. [DOI] [PMC free article] [PubMed] [Google Scholar]
- Kretzschmar K., Post Y., Bannier-Hélaouët M., Mattiotti A., Drost J., Basak O., Li V.S.W., van den Born M., Gunst Q.D., Versteeg D. Profiling proliferative cells and their progeny in damaged murine hearts. Proc. Natl. Acad. Sci. USA. 2018;115:E12245–E12254. doi: 10.1073/pnas.1805829115. [DOI] [PMC free article] [PubMed] [Google Scholar]
- Le Goff C., Morice-Picard F., Dagoneau N., Wang L.W., Perrot C., Crow Y.J., Bauer F., Flori E., Prost-Squarcioni C., Krakow D. ADAMTSL2 mutations in geleophysic dysplasia demonstrate a role for ADAMTS-like proteins in TGF-beta bioavailability regulation. Nat. Genet. 2008;40:1119–1123. doi: 10.1038/ng.199. [DOI] [PMC free article] [PubMed] [Google Scholar]
- Li Y.S., Ni S.Y., Meng Y., Shi X.L., Zhao X.W., Luo H.H., Li X. Angiotensin II facilitates fibrogenic effect of TGF-β1 through enhancing the down-regulation of BAMBI caused by LPS: a new pro-fibrotic mechanism of angiotensin II. PLoS One. 2013;8:e76289. doi: 10.1371/journal.pone.0076289. [DOI] [PMC free article] [PubMed] [Google Scholar]
- Lijnen P.J., Petrov V.V., Fagard R.H. Angiotensin II-induced stimulation of collagen secretion and production in cardiac fibroblasts is mediated via angiotensin II subtype 1 receptors. J. Renin Angiotensin Aldosterone Syst. 2001;2:117–122. doi: 10.3317/jraas.2001.012. [DOI] [PubMed] [Google Scholar]
- Lopes J., Adiguzel E., Gu S., Liu S.L., Hou G., Heximer S., Assoian R.K., Bendeck M.P. Type VIII collagen mediates vessel wall remodeling after arterial injury and fibrous cap formation in atherosclerosis. Am. J. Pathol. 2013;182:2241–2253. doi: 10.1016/j.ajpath.2013.02.011. [DOI] [PMC free article] [PubMed] [Google Scholar]
- Lu P., Takai K., Weaver V.M., Werb Z. Extracellular matrix degradation and remodeling in development and disease. Cold Spring Harb. Perspect. Biol. 2011;3:a005058. doi: 10.1101/cshperspect.a005058. [DOI] [PMC free article] [PubMed] [Google Scholar]
- Lu J., Chatterjee M., Schmid H., Beck S., Gawaz M. CXCL14 as an emerging immune and inflammatory modulator. J. Inflamm. (Lond.) 2016;13:1. doi: 10.1186/s12950-015-0109-9. [DOI] [PMC free article] [PubMed] [Google Scholar]
- Lu D., Wang J., Li J., Guan F., Zhang X., Dong W., Liu N., Gao S., Zhang L. Meox1 accelerates myocardial hypertrophic decompensation through Gata4. Cardiovasc. Res. 2018;114:300–311. doi: 10.1093/cvr/cvx222. [DOI] [PubMed] [Google Scholar]
- Lum C., Shesely E.G., Potter D.L., Beierwaltes W.H. Cardiovascular and renal phenotype in mice with one or two renin genes. Hypertension. 2004;43:79–86. doi: 10.1161/01.HYP.0000107401.72456.50. [DOI] [PubMed] [Google Scholar]
- Macosko E.Z., Basu A., Satija R., Nemesh J., Shekhar K., Goldman M., Tirosh I., Bialas A.R., Kamitaki N., Martersteck E.M. Highly Parallel Genome-wide Expression Profiling of Individual Cells Using Nanoliter Droplets. Cell. 2015;161:1202–1214. doi: 10.1016/j.cell.2015.05.002. [DOI] [PMC free article] [PubMed] [Google Scholar]
- Madisen L., Zwingman T.A., Sunkin S.M., Oh S.W., Zariwala H.A., Gu H., Ng L.L., Palmiter R.D., Hawrylycz M.J., Jones A.R. A robust and high-throughput Cre reporting and characterization system for the whole mouse brain. Nat. Neurosci. 2010;13:133–140. doi: 10.1038/nn.2467. [DOI] [PMC free article] [PubMed] [Google Scholar]
- McGinnis C.S., Murrow L.M., Gartner Z.J. DoubletFinder: Doublet Detection in Single-Cell RNA Sequencing Data Using Artificial Nearest Neighbors. Cell Syst. 2019;8:329–337.e4. doi: 10.1016/j.cels.2019.03.003. [DOI] [PMC free article] [PubMed] [Google Scholar]
- Mehta P.K., Griendling K.K. Angiotensin II cell signaling: physiological and pathological effects in the cardiovascular system. Am. J. Physiol. Cell Physiol. 2007;292:C82–C97. doi: 10.1152/ajpcell.00287.2006. [DOI] [PubMed] [Google Scholar]
- Mi H., Muruganujan A., Ebert D., Huang X., Thomas P.D. PANTHER version 14: more genomes, a new PANTHER GO-slim and improvements in enrichment analysis tools. Nucleic Acids Res. 2019;47(D1):D419–D426. doi: 10.1093/nar/gky1038. [DOI] [PMC free article] [PubMed] [Google Scholar]
- Mirotsou M., Zhang Z., Deb A., Zhang L., Gnecchi M., Noiseux N., Mu H., Pachori A., Dzau V. Secreted frizzled related protein 2 (Sfrp2) is the key Akt-mesenchymal stem cell-released paracrine factor mediating myocardial survival and repair. Proc. Natl. Acad. Sci. USA. 2007;104:1643–1648. doi: 10.1073/pnas.0610024104. [DOI] [PMC free article] [PubMed] [Google Scholar]
- Oh H., Bradfute S.B., Gallardo T.D., Nakamura T., Gaussin V., Mishina Y., Pocius J., Michael L.H., Behringer R.R., Garry D.J. Cardiac progenitor cells from adult myocardium: homing, differentiation, and fusion after infarction. Proc. Natl. Acad. Sci. USA. 2003;100:12313–12318. doi: 10.1073/pnas.2132126100. [DOI] [PMC free article] [PubMed] [Google Scholar]
- Park S.Y., Lee S.J., Cho H.J., Kim T.W., Kim J.T., Kim J.W., Lee C.H., Kim B.Y., Yeom Y.I., Lim J.S. Dehydropeptidase 1 promotes metastasis through regulation of E-cadherin expression in colon cancer. Oncotarget. 2016;7:9501–9512. doi: 10.18632/oncotarget.7033. [DOI] [PMC free article] [PubMed] [Google Scholar]
- Pinto A.R., Paolicelli R., Salimova E., Gospocic J., Slonimsky E., Bilbao-Cortes D., Godwin J.W., Rosenthal N.A. An abundant tissue macrophage population in the adult murine heart with a distinct alternatively-activated macrophage profile. PLoS One. 2012;7:e36814. doi: 10.1371/journal.pone.0036814. [DOI] [PMC free article] [PubMed] [Google Scholar]
- Pinto A.R., Ilinykh A., Ivey M.J., Kuwabara J.T., D’Antoni M.L., Debuque R., Chandran A., Wang L., Arora K., Rosenthal N.A., Tallquist M.D. Revisiting Cardiac Cellular Composition. Circ. Res. 2016;118:400–409. doi: 10.1161/CIRCRESAHA.115.307778. [DOI] [PMC free article] [PubMed] [Google Scholar]
- R Development Core Team . R Foundation for Statistical Computing; 2017. R: A language and environment for statistical computing. [Google Scholar]
- Regn M., Laggerbauer B., Jentzsch C., Ramanujam D., Ahles A., Sichler S., Calzada-Wack J., Koenen R.R., Braun A., Nieswandt B., Engelhardt S. Peptidase inhibitor 16 is a membrane-tethered regulator of chemerin processing in the myocardium. J. Mol. Cell. Cardiol. 2016;99:57–64. doi: 10.1016/j.yjmcc.2016.08.010. [DOI] [PubMed] [Google Scholar]
- Richardson W.J., Holmes J.W. Emergence of Collagen Orientation Heterogeneity in Healing Infarcts and an Agent-Based Model. Biophys. J. 2016;110:2266–2277. doi: 10.1016/j.bpj.2016.04.014. [DOI] [PMC free article] [PubMed] [Google Scholar]
- Rosenkranz S. TGF-beta1 and angiotensin networking in cardiac remodeling. Cardiovasc. Res. 2004;63:423–432. doi: 10.1016/j.cardiores.2004.04.030. [DOI] [PubMed] [Google Scholar]
- Ruiz-Villalba A., Mattiotti A., Gunst Q.D., Cano-Ballesteros S., van den Hoff M.J., Ruijter J.M. Reference genes for gene expression studies in the mouse heart. Sci. Rep. 2017;7:24. doi: 10.1038/s41598-017-00043-9. [DOI] [PMC free article] [PubMed] [Google Scholar]
- Salimova E., Nowak K.J., Estrada A.C., Furtado M.B., McNamara E., Nguyen Q., Balmer L., Preuss C., Holmes J.W., Ramialison M. Variable outcomes of human heart attack recapitulated in genetically diverse mice. NPJ Regen. Med. 2019;4:5. doi: 10.1038/s41536-019-0067-6. [DOI] [PMC free article] [PubMed] [Google Scholar]
- Schindelin J., Arganda-Carreras I., Frise E., Kaynig V., Longair M., Pietzsch T., Preibisch S., Rueden C., Saalfeld S., Schmid B. Fiji: an open-source platform for biological-image analysis. Nat. Methods. 2012;9:676–682. doi: 10.1038/nmeth.2019. [DOI] [PMC free article] [PubMed] [Google Scholar]
- Skelly D.A., Squiers G.T., McLellan M.A., Bolisetty M.T., Robson P., Rosenthal N.A., Pinto A.R. Single-Cell Transcriptional Profiling Reveals Cellular Diversity and Intercommunication in the Mouse Heart. Cell Rep. 2018;22:600–610. doi: 10.1016/j.celrep.2017.12.072. [DOI] [PubMed] [Google Scholar]
- Smith C.L., Baek S.T., Sung C.Y., Tallquist M.D. Epicardial-derived cell epithelial-to-mesenchymal transition and fate specification require PDGF receptor signaling. Circ. Res. 2011;108:e15–e26. doi: 10.1161/CIRCRESAHA.110.235531. [DOI] [PMC free article] [PubMed] [Google Scholar]
- Smith S.W., Croft A.P., Morris H.L., Naylor A.J., Huso D.L., Isacke C.M., Savage C.O., Buckley C.D. Genetic Deletion of the Stromal Cell Marker CD248 (Endosialin) Protects against the Development of Renal Fibrosis. Nephron. 2015;131:265–277. doi: 10.1159/000438754. [DOI] [PMC free article] [PubMed] [Google Scholar]
- Soneson C., Robinson M.D. Bias, robustness and scalability in single-cell differential expression analysis. Nat. Methods. 2018;15:255–261. doi: 10.1038/nmeth.4612. [DOI] [PubMed] [Google Scholar]
- Subramanian Vignesh K., Deepe G.S., Jr. Metallothioneins: Emerging Modulators in Immunity and Infection. Int. J. Mol. Sci. 2017;18:E2197. doi: 10.3390/ijms18102197. [DOI] [PMC free article] [PubMed] [Google Scholar]
- Suchanski J., Tejchman A., Zacharski M., Piotrowska A., Grzegrzolka J., Chodaczek G., Nowinska K., Rys J., Dziegiel P., Kieda C., Ugorski M. Podoplanin increases the migration of human fibroblasts and affects the endothelial cell network formation: A possible role for cancer-associated fibroblasts in breast cancer progression. PLoS One. 2017;12:e0184970. doi: 10.1371/journal.pone.0184970. [DOI] [PMC free article] [PubMed] [Google Scholar]
- Swirski F.K., Nahrendorf M., Etzrodt M., Wildgruber M., Cortez-Retamozo V., Panizzi P., Figueiredo J.L., Kohler R.H., Chudnovskiy A., Waterman P. Identification of splenic reservoir monocytes and their deployment to inflammatory sites. Science. 2009;325:612–616. doi: 10.1126/science.1175202. [DOI] [PMC free article] [PubMed] [Google Scholar]
- Tang J., Li Y., Huang X., He L., Zhang L., Wang H., Yu W., Pu W., Tian X., Nie Y. Fate Mapping of Sca1+ Cardiac Progenitor Cells in the Adult Mouse Heart. Circulation. 2018;138:2967–2969. doi: 10.1161/CIRCULATIONAHA.118.036210. [DOI] [PubMed] [Google Scholar]
- Teo Z., Chan J.S.K., Chong H.C., Sng M.K., Choo C.C., Phua G.Z.M., Teo D.J.R., Zhu P., Choong C., Wong M.T.C., Tan N.S. Angiopoietin-like 4 induces a β-catenin-mediated upregulation of ID3 in fibroblasts to reduce scar collagen expression. Sci. Rep. 2017;7:6303. doi: 10.1038/s41598-017-05869-x. [DOI] [PMC free article] [PubMed] [Google Scholar]
- Terao M., Tani M., Itoi S., Yoshimura T., Hamasaki T., Murota H., Katayama I. 11β-hydroxysteroid dehydrogenase 1 specific inhibitor increased dermal collagen content and promotes fibroblast proliferation. PLoS One. 2014;9:e93051. doi: 10.1371/journal.pone.0093051. [DOI] [PMC free article] [PubMed] [Google Scholar]
- Thygesen K., Alpert J.S., Jaffe A.S., Chaitman B.R., Bax J.J., Morrow D.A., White H.D., Executive Group on behalf of the Joint European Society of Cardiology (ESC)/American College of Cardiology (ACC)/American Heart Association (AHA)/World Heart Federation (WHF) Task Force for the Universal Definition of Myocardial Infarction Fourth Universal Definition of Myocardial Infarction (2018) Circulation. 2018;138:e618–e651. doi: 10.1161/CIR.0000000000000617. [DOI] [PubMed] [Google Scholar]
- van den Borne S.W., Cleutjens J.P., Hanemaaijer R., Creemers E.E., Smits J.F., Daemen M.J., Blankesteijn W.M. Increased matrix metalloproteinase-8 and -9 activity in patients with infarct rupture after myocardial infarction. Cardiovasc. Pathol. 2009;18:37–43. doi: 10.1016/j.carpath.2007.12.012. [DOI] [PubMed] [Google Scholar]
- van Nieuwenhoven F.A., Munts C., Op’t Veld R.C., González A., Díez J., Heymans S., Schroen B., van Bilsen M. Cartilage intermediate layer protein 1 (CILP1): a novel mediator of cardiac extracellular matrix remodelling. Sci. Rep. 2017;7:16042. doi: 10.1038/s41598-017-16201-y. [DOI] [PMC free article] [PubMed] [Google Scholar]
- Villani A.C., Satija R., Reynolds G., Sarkizova S., Shekhar K., Fletcher J., Griesbeck M., Butler A., Zheng S., Lazo S. Single-cell RNA-seq reveals new types of human blood dendritic cells, monocytes, and progenitors. Science. 2017;356:eaah4573. doi: 10.1126/science.aah4573. [DOI] [PMC free article] [PubMed] [Google Scholar]
- Wang Q., Hummler E., Nussberger J., Clément S., Gabbiani G., Brunner H.R., Burnier M. Blood pressure, cardiac, and renal responses to salt and deoxycorticosterone acetate in mice: role of Renin genes. J. Am. Soc. Nephrol. 2002;13:1509–1516. doi: 10.1097/01.asn.0000017902.77985.84. [DOI] [PubMed] [Google Scholar]
- Weinreb C., Wolock S., Klein A.M. SPRING: a kinetic interface for visualizing high dimensional single-cell expression data. Bioinformatics. 2018;34:1246–1248. doi: 10.1093/bioinformatics/btx792. [DOI] [PMC free article] [PubMed] [Google Scholar]
- Wessels A., van den Hoff M.J., Adamo R.F., Phelps A.L., Lockhart M.M., Sauls K., Briggs L.E., Norris R.A., van Wijk B., Perez-Pomares J.M. Epicardially derived fibroblasts preferentially contribute to the parietal leaflets of the atrioventricular valves in the murine heart. Dev. Biol. 2012;366:111–124. doi: 10.1016/j.ydbio.2012.04.020. [DOI] [PMC free article] [PubMed] [Google Scholar]
- Witke W., Sharpe A.H., Hartwig J.H., Azuma T., Stossel T.P., Kwiatkowski D.J. Hemostatic, inflammatory, and fibroblast responses are blunted in mice lacking gelsolin. Cell. 1995;81:41–51. doi: 10.1016/0092-8674(95)90369-0. [DOI] [PubMed] [Google Scholar]
- Xie T., Wang Y., Deng N., Huang G., Taghavifar F., Geng Y., Liu N., Kulur V., Yao C., Chen P. Single-Cell Deconvolution of Fibroblast Heterogeneity in Mouse Pulmonary Fibrosis. Cell Rep. 2018;22:3625–3640. doi: 10.1016/j.celrep.2018.03.010. [DOI] [PMC free article] [PubMed] [Google Scholar]
- Yata Y., Scanga A., Gillan A., Yang L., Reif S., Breindl M., Brenner D.A., Rippe R.A. DNase I-hypersensitive sites enhance alpha1(I) collagen gene expression in hepatic stellate cells. Hepatology. 2003;37:267–276. doi: 10.1053/jhep.2003.50067. [DOI] [PubMed] [Google Scholar]
- Zhang C.L., Zhao Q., Liang H., Qiao X., Wang J.Y., Wu D., Wu L.L., Li L. Cartilage intermediate layer protein-1 alleviates pressure overload-induced cardiac fibrosis via interfering TGF-β1 signaling. J. Mol. Cell. Cardiol. 2018;116:135–144. doi: 10.1016/j.yjmcc.2018.02.006. [DOI] [PubMed] [Google Scholar]
- Zheng G.X., Terry J.M., Belgrader P., Ryvkin P., Bent Z.W., Wilson R., Ziraldo S.B., Wheeler T.D., McDermott G.P., Zhu J. Massively parallel digital transcriptional profiling of single cells. Nat. Commun. 2017;8:14049. doi: 10.1038/ncomms14049. [DOI] [PMC free article] [PubMed] [Google Scholar]
Associated Data
This section collects any data citations, data availability statements, or supplementary materials included in this article.
Supplementary Materials
Data Availability Statement
Data resources
R scripts utilized in the study can be obtained upon request. The accession number for the sequencing data reported in this paper is ArrayExpress: E-MTAB-7895.