Abstract
We report observation of high quantum yield, long-lifetime fluorescence from a red dye BO-PRO-3 excited by resonance energy transfer (RET). The acceptor fluorescence was highly enhanced upon binding to the donor-labeled DNA. A ruthenium complex (Ru) was chosen as a donor in this system because of its long fluorescence lifetime. Both donor and acceptor were non-covalently bound to DNA. Emission from the donor-acceptor system (DA) at wavelengths exceeding 600 nm still preserves the long-lifetime component of the Ru donor, retaining average fluorescence lifetimes in the range of 30–50 ns. Despite the low quantum yield of the Ru donor in the absence of acceptor, its overall quantum yield of the DA pair was increased by energy transfer to the higher quantum yield acceptor BO-PRO-3. The wavelength-integrated intensity of donor and acceptor bound to DNA was many-fold greater than the intensity of the donor and acceptor separately bound to DNA. The origin of this effect is due to an efficient energy transfer from the donor, competing with non-radiative depopulation of the donor excited state. The distinctive features of DA complexes can be used in the development of a new class of engineered luminophores that display both long lifetime and long-wavelength emission. Similar DA complexes can be applied as proximity indicators, exhibiting strong fluorescence of adjacently located donors and acceptors over the relatively weak fluorescence of separated donors and acceptors.
Keywords: Enhanced emission, fluorescence resonance energy transfer, metal-ligand complex, BO-PRO-3, DNA
INTRODUCTION
Fluorophores with red or near infrared (NIR) emission are desirable for the biotechnology and medical applications of fluorescence. Red and NIR5 probes are now routinely used in protein labeling, medical testing, and DNA analysis [1–2]. An advantage of many red-NIR fluorophores is their high extinction coefficient, which in turn allows high-sensitivity detection. However, the high extinction coefficients are also a disadvantage because a high probability for absorption also results in a high rate of emission, which results in short decay times [3], and most known red-NIR fluorophores display lifetimes below 4 ns. Red and NIR fluorophores typically display small Stokes’ shifts, and scattered light is most difficult to eliminate at wavelengths close to the excitation wavelength.
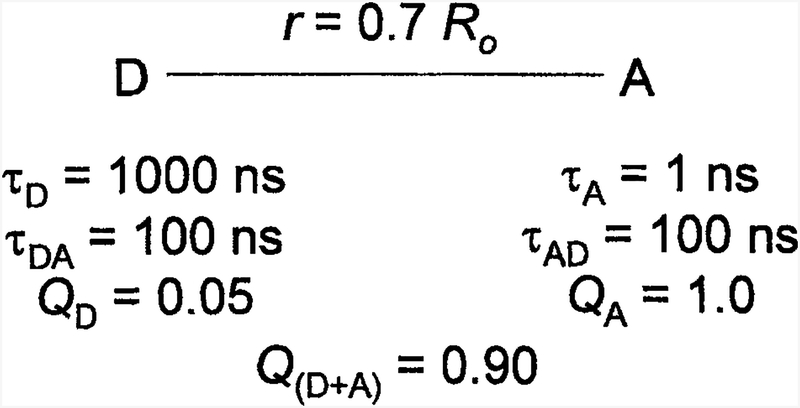
In recent publications we described a new approach to creating fluorophores that display larger Stokes’ shifts, red or NIR emission, and decay times over 30 ns [4–5]. These probes are based on resonance energy transfer (RET) using a long-lifetime donor and a red-emitting high quantum yield acceptor. These luminophores are typified in scheme I, which shows a long-lifetime donor (D) that is covalently linked to an acceptor (A). In this example the D-to-A distance is assumed to be 0.7 R0, where R0 is the Förster distance. This separation results in approximately 90% transfer efficiency. The donor is a luminescent transition metal-ligand complex (MLC), which can display a wide range of absorption and emission wavelengths and long decay times ranging from 100 ns to 10 μs [6–7]. These complexes have been developed for use as luminescent probes [8–9] for studies of protein dynamics, immunoassays, and chemical sensing [10–13].
Scheme I.
A potential long-wavelength, long-lifetime luminophore based on a long-lifetime donor (D) and a short-lifetime acceptor (A).
Although the MLCs are useful luminophores, they possess several disadvantages. The extinction coefficients are low, typically near 10,000 M−1 cm−1, and the emission spectra are broad. Broad emission spectra result in significant spectral overlap of the emission spectra of different MLCs and an inability to use at multiple-emission wavelengths to resolve multiple species. Broad emission spectra also reduce sensitivity because the autofluorescence over the wide range of wavelengths contributes to the measured intensity.
We circumvented the disadvantages of the MLCs by the use of a tandem probe in which a long-lifetime MLC is the donor and a high quantum yield but short-lifetime fluorophore is the acceptor (Scheme I). In such luminophores, RET occurs throughout the donor decay, providing a long-lifetime component in the acceptor emission. Assume the donor lifetime in the absence of acceptor is τD = 1000 ns. The presence of a single acceptor at a distance of 0.7 R0 will reduce the lifetime to about 100 ns. Because the acceptor lifetime is short (τA = 1 ns), the acceptor intensity will closely follow the donor intensity. Hence the acceptor will display the same decay time(s) as the donor. Most will display some absorption at the donor excitation wavelength. In this case the acceptor emission will typically display an ns component as a result of a directly excited acceptor, and a long decay time near 100 ns resulting from RET from the donor. The long-lifetime emission acceptor can be readily isolated with gated detection, which is readily accomplished with photomultiplier tubes (PMTs) [14–16].
An important advantage of such a RET probe (scheme I) is an increase in the effective quantum yield of the long-lifetime D-A pairs. This increase in quantum yield occurs because the transfer efficiency can approach unity even though the donor quantum yield is low. The result of efficient RET from the donor is that the wavelength integrated intensity of the D-A pair can be larger than that of the donor or acceptor alone. For 100% transfer efficiency the overall quantum yield becomes the quantum yield of the acceptor. Thus tandem RET probes based on MLC donors can be used to create long-lifetime probes, with red-NIR emission, with the added advantage of an increased quantum yield for the DA pair. The modular design of these probes allows adjustment of the spectral properties, including the excitation and emission wavelengths and the decay times.
Given the simplicity of this idea, we examined the literature for suggestions of designing luminophores using low quantum yield donors. There are numerous primary reports and review articles on RET, and the concept of using the acceptor emission is not new [17–20]. The novelty of our approach is recognition that the effective quantum yield of the luminophore could be increased by rapid energy transfer. Such an increase in effective quantum yield was not important for the biochemical uses of RET [17–20], because most donors had good quantum yields. The value of the RET-enhanced quantum yield becomes apparent because of the development of the long-lifetime MLC probes and their low quantum yields. In retrospect, the possibility of increasing the effective quantum yield of the donor was observed by the enhancement of lanthanide emission when bound to essentially non-luminescent DNA or nucleotides [21–23]. However, to the best of our knowledge, our use of the RET-enhanced effective quantum yield with low quantum yield donors to create long-lived red-NIR emission is novel.
THEORY
The theory and application of RET have been described in numerous reviews [24–26]. Here we discuss those aspects of RET needed to demonstrate the occurrence of the RET-enhanced quantum yield and long acceptor decay time. The rate of energy transfer from a donor to an acceptor is given by:
| (1) |
where τD is the donor lifetime in the absence of acceptor, r is the donor-to-acceptor distance, and R0 is the Förster distance at which RET is 50% efficient.
It is known that the transfer efficiency can be measured using the intensity of the acceptor emission [17]. The transfer efficiency as seen from the acceptor (EA) is given by
| (2) |
where εA and εD are the molar extinction coefficients of the acceptor and donor at the excitation wavelength, respectively, and FA and FAD are the acceptor intensities in the absence and presence of the donor, respectively. The use of εA and εD is only appropriate for a one-to one ratio of donor to acceptor. In the present report the donors and acceptors are not covalently linked and are not present in a one-to-one molar ratio. In this case, Eq. (2) becomes:
| (3) |
where ODD and ODA refer to the optical density of the donor or acceptor at the donor excitation wavelength.
What is the overall quantum yield for the tandem luminophore? One can readily show that the total emission from a tandem luminophore FT = FD + FA is given by
| (4) |
where QD and QA are the quantum yields of the donors and acceptors, respectively, E is the actual transfer efficiency, and k is a constant containing the excitation intensity, concentration, and instrumental factors. This expression assumes the sample is dilute so that the amount of light absorbed is directly proportional to the concentration. In the absence of energy transfer the total intensity is given by:
| (5) |
as expected for a mixture of two non-interacting fluorophores. Suppose the transfer efficiency is 100%. In this case the overall quantum yield of the tandem luminophore becomes:
| (6) |
This result shows that all the photons absorbed by the donor are transferred to the acceptor, and the effective quantum yield becomes that of the acceptor. Examination of Eq. (4) shows that as the transfer efficiency increases the absorbed energy is shifted from the low quantum yield donor to the high quantum yield acceptor, irrespective of the quantum yield of the donor.
It is informative to consider the time-dependent decays of the donor and acceptor in the presence of energy transfer. These expressions can be obtained using the known solution for a reversible excited state reaction [27–29] and setting the reverse transfer rate to zero. Assuming the donor emission and the acceptor emission can be observed separately, the time-dependent changes of the donor and acceptor are then given by:
| (7) |
| (8) |
In these expressions αD and βA are the time zero amplitudes of the intensity decays, and CD and CA are constants that depend on the sample concentration and the experimental apparatus. Also, we have assumed the donor and directly excited acceptors display a single exponential decay. The pre-exponential factors for the acceptor decay are equal and opposite and are given by:
| (9) |
In this expression λA is the radiative decay rate of the acceptor, and ΓD and ΓA are the decay rates of the donor in the absence of acceptors and of the directly excited acceptor, respectively. These values are the reciprocals of the decay times in the absence of energy transfer, ΓD = τD−1 and ΓA = τA −1.
Suppose the rate of transfer is very rapid (τDA → or kT → ∞). Then the acceptor decay becomes such that would be observed if the acceptor were directly excited:
| (10) |
The more interesting result occurs when the decay time of the donor is much longer than that of the acceptor, that is, τD ≫ τA. The acceptor decay becomes:
| (11) |
Following decay of the short component with a decay time τA the acceptor decay displays a lifetime equivalent to the donor decay time in the presence of energy transfer:
| (12) |
where C is a constant.
MATERIALS AND METHODS
Materials
Calf thymus DNA (CT-DNA), Tris-HCl and ethylenediaminetetraacetic acid (EDTA) were obtained from Sigma (St. Louis, MO). [Ru(bpy)2(dppz)]2+ (bpy = 2,2′-bipyridine, dppz = dipyrido[3,2-a:2′,3′-c]phenazine) (Ru-BD) was synthesized by the method described previously [30–31] and BO-PRO-3 was purchased from Molecular Probes, Inc. (Eugene, OR). All reagents were used without further purification, and water was deionized with a Milli-Q system. To convert CT-DNA into linear fragments comparable in length to one persistent length, about 5 mg/ml solution of CT-DNA was sonicated approximately 10 minutes while submerged in an ice bath. The sonicated DNA solution was centrifuged for 1 hour at 75,000 × g to remove titanium particles and undissolved DNA. All experiments were undertaken at room temperature in 2 mM Tris-HCl, pH 8.0, containing 0.1 mM EDTA.
Absorption and Steady-State Fluorescence Measurement
Ru-BD served as a donor, and BO-PRO-3 was used as an acceptor. About 5–10 mM stock solution of Ru-BD was prepared in dimethylformamide, and the concentration of DNA was quantified using a molar extinction coefficient of 13,300 M−1cm−1 (expressed as bp) at 260 nm. The DNA concentration was 1 mM base pair (bp) while the concentration of Ru-BD was 20 μM. Concentrations of Ru-BD and BO-PRO-3 were determined using the extinction coefficients in Table I. The highest BO-PRO-3 concentration was 120 μM. Because BO-PRO-3 was supplied as a 1-mM stock solution in dimethyl sulfoxide (DMSO), the maximum percentage of DMSO in DA pairs was 12%(v/v). In preliminary experiment, we found that DMSO increases the steady-state fluorescence intensity of Ru-BD (data not shown). So, we added aliquots of DMSO to make 12%(v/v) DMSO in all Ru-BD-BO-PRO-3 DA pairs to equalize the effect of DMSO. UV/visible absorption spectra were measured with a Hewlett-Packard 8453 diode array spectrophotometer. Steady-state fluorescence measurements were carried out using an SLM Model 8000 spectrofluorometer (Spectronic Instruments, Inc., Rochester, NY) using magic angle conditions. The excitation wavelength of Ru-BD was 423 nm.
Table I.
Quantum Yields (Q), Decay Times (t), and Molar Extinction Coefficients (ε/λmax) of Fluorophores in DNA
| Probe | Donor/Acceptor | Q | 〈τ〉a (ns) | ε/λex (M−1cm−1/nm) | ε/λmax (M−1cm−1/nm) |
|---|---|---|---|---|---|
| RuBD | Donor | 0.008b | 124.0 | 12,400/423 | 13,000/440 |
| BO-PRO-3 | Acceptor | 0.62c | 4.4 | 290/423 | 81,000/575 |
Mean lifetimes were calculated using , where fi is the fractional steady-state contribution of each component to the total emission.
Quantum yield reference: 4-dicyanomethylene-2-methyl-6-(p-dimethylaminostyryl)4H-pyran in methanol (Q = 0.38).
From Molecular Probes, Inc.
Frequency-Domain Fluorescence Measurements
Measurements were performed using the instruments described previously [32] and modified with a data acquisition card from ISS, Inc. (Urbana, IL) [33]. The excitation source was a blue light-emitting diode (LED) LNG992CFBW (Panasonic, Japan) with luminous intensity of 1,500 mcd, and an LED driver LDX-3412 (ILX Lightwave, Boseman, MO) provided 30 mA of current at frequencies from 1–9.3 MHz. A 450RD55 interference filter (Omega Optical, Inc., Brattleboro, VT) and a 4–96 color glass filter (Corning Glass Work, Corning, NY) were used to isolate excitation wavelength. Sample fluorescence was observed through a 640 ± 10 nm interference filter (Intor Inc., Socorro, NM). Rhodamine B in water (τ = 1.68 ns) was utilized as a lifetime standard.
RESULTS
Steady-State Spectra
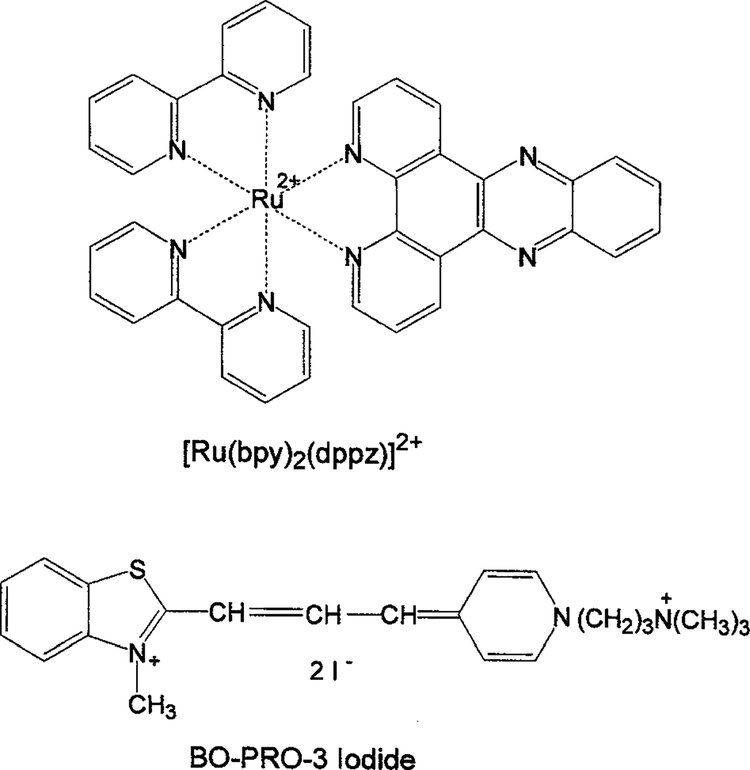
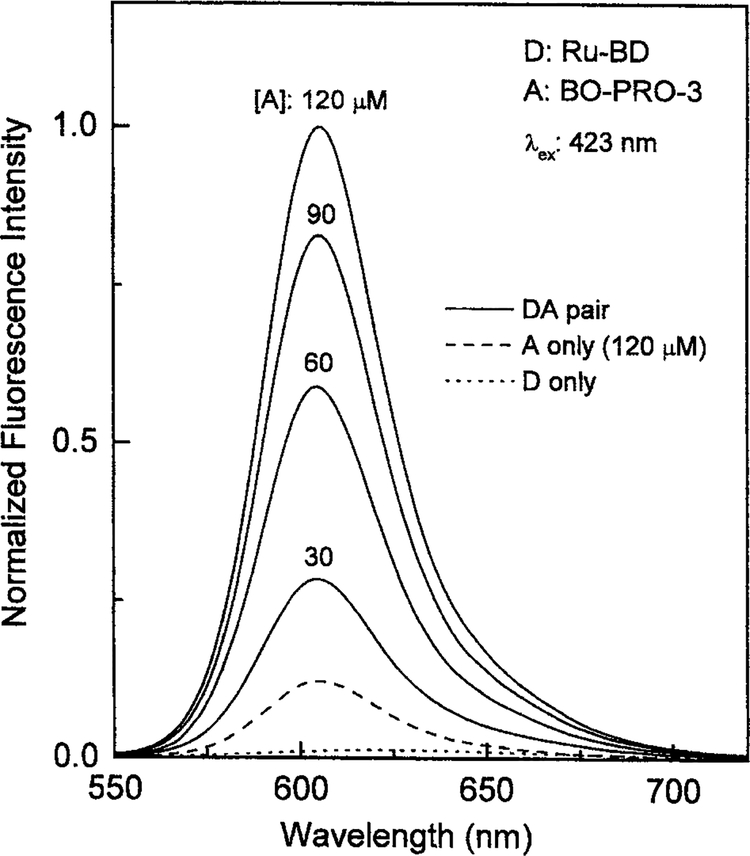
We used DNA with a non-covalently bound donor and acceptor to create a long-lifetime luminophore with high quantum yield. We chose Ru-BD as the donor and BO-PRO-3 as the acceptor (Fig. 1). Figure 2 shows the emission spectra of Ru-BD bound to DNA with increasing amounts of acceptor. The emission from the D-A system is considerably larger than that of the donor alone bound to DNA or the acceptor alone bound to DNA (dashed line).
Fig. 1.
Chemical structures of [Ru(bpy)2(dppz)]2+ (Ru-BD) and BO-PRO-3.
Fig. 2.
Emission spectra of Ru-BD in the presence and absence of varying concentrations of the BO-PRO-3 acceptor bound to calf thymus DNA. The long dashed line shows the emission spectrum of the acceptor alone, 120 μM BO-PRO-3. The BO-PRO-3 concentrations are shown in μM.
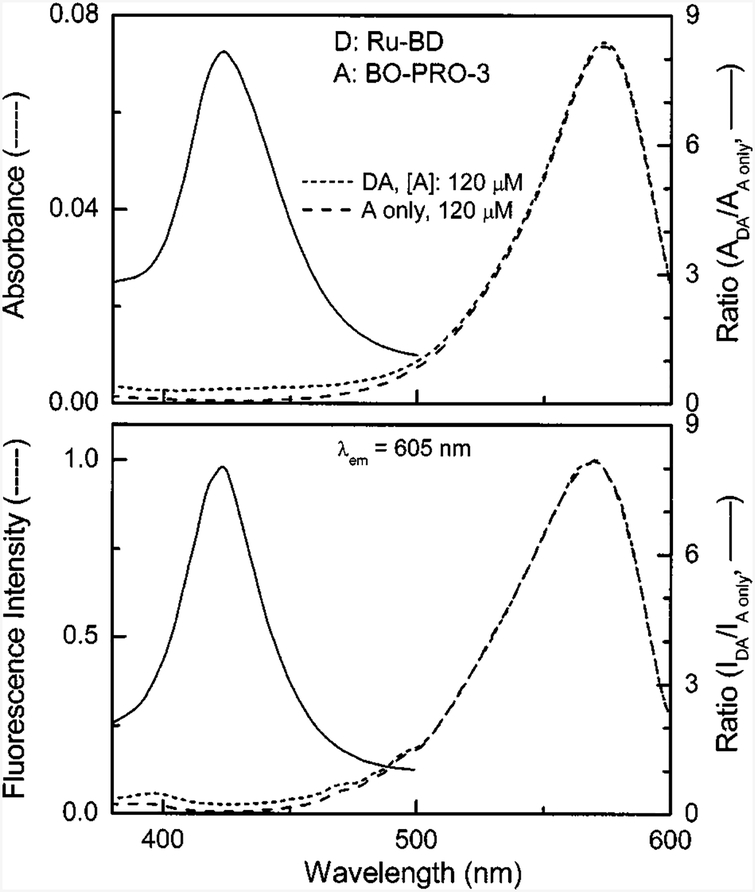
The absorption and excitation spectra are shown in Fig. 3 (dashed lines). If the transfer is 100% effective, the intensity of the acceptor is proportional to (εA + εD)/εA. According to Table I, this ratio is near 44. Examination of Fig. 3 (bottom) indicates that the acceptor intensity enhancement is near 8. On the same relative scale the acceptor alone displays essentially no emission upon excitation at 423 nm (Fig. 3, bottom).
Fig. 3.
Absorption (top) and uncorrected excitation (bottom) spectra of Ru-BD with 120 μM BO-PRO-3 donor-acceptor pair (short dashed lines) and the acceptor alone, 120 μM BO-PRO-3 (long dashed line) bound to calf thymus DNA. Ratios of two absorption (top) and two excitation (bottom) spectra are shown in solid lines.
Time-Resolved Decays
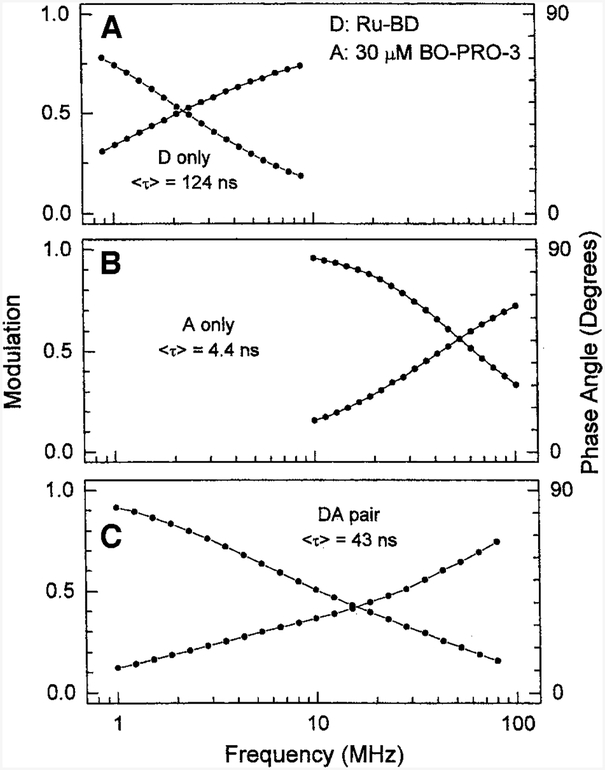
We examined the time-resolved decay of the donor, acceptor, and combined emission. Frequency-domain intensity decays are shown in Fig. 4. In the absence of acceptor, the mean Ru-BD lifetime is near 124 ns. The Ru-BD lifetime is decreased by the acceptor. For instance, a ratio of 0.03 acceptors per bp results in a mean donor lifetime of near 43 ns (Table II). The directly excited acceptor shows a lifetime of 4.4 ns. Hence it is clear the BO-PRO-3 is being excited by RET from the Ru donor.
Fig. 4.
Frequency-domain intensity decays of Ru-BD in the absence (top) and presence (bottom) of 30 μM BO-PRO-3 bound to calf thymus DNA. The middle panel presents the frequency responses of the BO-PRO-3 acceptor alone bound to DNA. The solid circles represent the phase or modulation values, and the solid lines show the best multi-exponential fits to the data.
Table II.
Multiexponential Intensity Decay Analyses of the Donor (Ru-BD), Acceptor (BO-PRO-3), and Donor-Acceptor (DA) Pairs Bound to Calf Thymus DNAa
| Sample | Acceptor concentration (bp−1) | τ1 | α1 | SSI1 | τ2 | α2 | SSI2 | τ3 | α3 | SSI3 | 〈τ〉b | |
|---|---|---|---|---|---|---|---|---|---|---|---|---|
| Donor | 0 | 157 | 0.41 | 0.71 | 46.0 | 0.59 | 0.29 | 124.0 | 1.4 | |||
| Acceptor | 0.09 | 4.4 | 1.00 | 1.00 | 4.4 | 1.2 | ||||||
| DA | 0.03 | 119 | 0.03 | 0.24 | 30.7 | 0.16 | 0.41 | 5.2 | 0.81 | 0.35 | 43.4 | 0.9 |
| DA | 0.06 | 114 | 0.02 | 0.19 | 30.0 | 0.16 | 0.41 | 5.8 | 0.82 | 0.40 | 35.6 | 0.8 |
| DA | 0.09 | 131 | 0.01 | 0.18 | 26.6 | 0.17 | 0.40 | 5.7 | 0.82 | 0.42 | 36.2 | 0.7 |
LED excitation was at 440 nm, and emission was observed at 640 ± 10 nm. There was no spectral separation between the donor and acceptor fluorescence.
Mean lifetimes were calculated using 〈τ〉= fi τi, where fi is the fractional steady-state contribution of each component of the total emission.
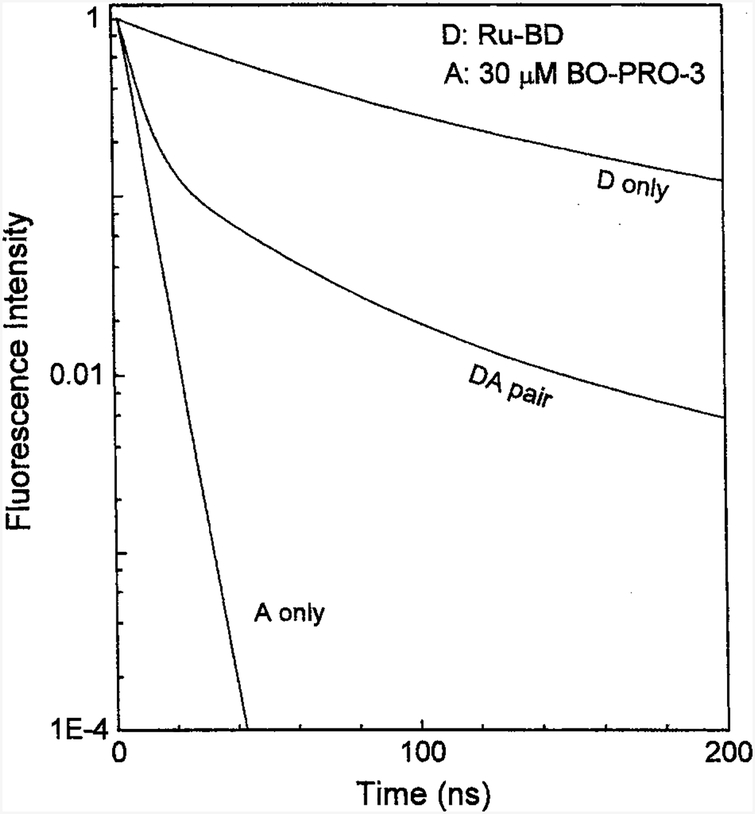
It is informative to examine the intensity decays in the time-domain reconstructed from the frequency-domain data (Fig. 5). The decays of the directly excited acceptors are short, and emission from the directly excited acceptors will not be observed if the detection is off-gated for the first 10–20 ns after the excitation pulse. The donor decays, even in the presence of acceptors, are long lived. Also, after a brief transition period out to 40 ns, the acceptor decay rates are comparable to those of the quenched donors. This long-lived emission from the donor can be used for biophysical or analytical purposes. An important conclusion from this experiment is that the apparent acceptor decays are adequately long for off-gating of the autofluorescence from biological samples. Hence the use of MLC-acceptor pairs can be used to obtain luminophores that display long lifetimes, high quantum yields, and long-emission wavelengths.
Fig. 5.
Time-domain representation of intensity decays of Ru-BD bound to DNA in the absence and presence of 30 μM BO-PRO-3 bound to calf thymus DNA. The intensity decay of the BO-PRO-3 acceptor alone is also shown.
DISCUSSION
An advantage of the RET probes described above is that the emission spectra of red and NIR fluorophores are typically narrow on the wavelength scale, whereas the emission spectra of the MLCs are broad. Because autofluorescence from biological samples is typically distributed broadly on the wavelength scale, the concentration of the emission into a narrow spectral range by the acceptor should improve detectability. These luminophores may be used for DNA hybridization [34–35], fluorescence in-situ hybridization (FISH) [36], or as molecular beacons [37]. When using our approach, most of the species labeled with donor or acceptor alone will display little emission. In contrast the D-A pairs due to macromolecular association will be brightly fluorescent. Additionally, the acceptor emission will be long lived. Using time-gated detection brightly fluorescent spots may become apparent against background of weakly stained chromatin and/or short decay time. These spectral properties could be useful for detection of oligonucleotide hybridization on DNA arrays [38–39], which are becoming widely used for analysis of gene expression [40–41]. This approach can also be used to create D-A pairs that act as a single luminophore, or this effect can be used to detect interactions in samples containing species labeled with the donor or acceptor. And, finally, one can imagine the use of the enhanced emission, and inhibition of the enhancement, for use in macromolecular binding assays in high-throughput screening [42–43]. There appear to be numerous applications of long-wavelength long-lifetime probes in biochemical and biomedical research.
ACKNOWLEDGMENTS
This work was supported by the NIH, NCRR RR-08119 and GM-35154. The authors also thank Drs. Ignacy Gryczynski, Zygmunt Gryczynski, and Badri Maliwal for their valuable suggestions.
Footnotes
ABBREVIATIONS: A, acceptor; bp, base pair; bpy, 2,2′-bipyridine; CT-DNA, calf thymus DNA; D, donor; DA, donor-acceptor; dppz, dipyrido[3,2-a:2′,3′-c]phenazine; DMSO, dimethyl sulfoxide; EDTA, ethylenediaminetetraacetic acid; LED, light-emitting diode; MLC, metal-ligand complex; RET, resonance energy transfer; NIR, near infrared; PMT, photomultiplier tube.
REFERENCES
- 1.Thompson RB (1994) In Lakowicz JR (Ed.) Topics in Fluorescence Spectroscopy, Vol. 4: Probe Design and Chemical Sensing, Plenum Press, New York, pp. 151–222. [Google Scholar]
- 2.Daehne S, Resch-Genger U, and Wolfbeis OS (1998) NearInfrared Dyes for High Technology Applications, Kluwer Academic Publishers, Boston, pp. 458. [Google Scholar]
- 3.Strickler SJ and Berg RA (1962) J. Chem. Phys 37, 814–822. [Google Scholar]
- 4.Lakowicz JR, Piszczek G, and Kang JS (2001) Anal. Biochem 288, 62–75. [DOI] [PMC free article] [PubMed] [Google Scholar]
- 5.Maliwal BP, Gryczynski Z, and Lakowicz JR (2001) Anal. Chem 73, 4277–4285. [DOI] [PMC free article] [PubMed] [Google Scholar]
- 6.Kalayanasundarm K (1992) Photochemistry of Polypyridine and Porphyrin Complexes, Academic Press, New York. [Google Scholar]
- 7.Juris A, Balzani V, Barigelletti F, Campagna S, Belser P, and Von Zelewsky A (1988) Coord. Chem. Rev 84, 85–277. [Google Scholar]
- 8.Demas JN and DeGraff BA(1991) Anal. Chem 63,829A–837A. [Google Scholar]
- 9.Demas JN and DeGraff BA (1994) in Lakowicz JR (Ed.) Topics in Fluorescence Spectroscopy, Vol. 4: Probe Design and Chemical Sensing, Plenum Press, New York, pp. 71–107. [Google Scholar]
- 10.Terpetschnig E, Szmacinski H, Malak H, and Lakowicz JR(1995) Biophys. J 68, 342–350. [DOI] [PMC free article] [PubMed] [Google Scholar]
- 11.Szmacinski H, Terpetschnig E, and Lakowicz JR (1996) Biophys. Chem 62, 109–120. [DOI] [PMC free article] [PubMed] [Google Scholar]
- 12.Grigg R and Norbert WDJA (1992) J. Chem. Soc. Chem. Commun 1992, 1300–1302. [Google Scholar]
- 13.Lippitsch ME and Wolfbeis OS (1988) Anal. Chim 205, 1–6. [Google Scholar]
- 14.Haugen GR, Wallin BW, and Lytle FE (1979) Rev. Sci. Instrum 50, 64–72. [DOI] [PubMed] [Google Scholar]
- 15.Barisasand BG Lauther MD (1980) Rev. Sci. Instrum 51,74–78. [Google Scholar]
- 16.James DR, Siemiarczuk A, and Ware WR (1992) Rev. Sci. Instrum 63, 1710–1716. [Google Scholar]
- 17.Cheung HC (1991) in Lakowicz JR (Ed.) Topics in Fluorescence Spectroscopy, Vol. 2 Principles, Plenum Press, New York, pp. 127–176. [Google Scholar]
- 18.Clegg RM (1992) Proc. Natl. Acad. Sci 211, 353–388. [Google Scholar]
- 19.Selvin PR (1996) IEEE J. Selected Topics in Quantum Electronics 2(4), 1077–1087. [Google Scholar]
- 20.Ju J, Ruan C, Fuller CW, Glazer AN, and Mathies RA(1995) Proc. Natl. Acad. Sci. USA 92, 4347–4351. [DOI] [PMC free article] [PubMed] [Google Scholar]
- 21.Klakamp SL and Horrocks W. DeW. (1992) J. Inorg. Biochem 46, 175–192. [DOI] [PubMed] [Google Scholar]
- 22.Klakamp SL and Horrocks W. DeW. (1992) J. Inorg. Biochem 46, 193–205. [DOI] [PubMed] [Google Scholar]
- 23.Fu PKL and Turro C (1999) J. Am. Chem. Soc 121(1), 1–7. [Google Scholar]
- 24.Stryer L (1978) Annu. Rev. Biochem 47, 819–846. [DOI] [PubMed] [Google Scholar]
- 25.Clegg RM (1996) in Wang XF and Herman B (Eds.) Fluorescence Imaging Spectroscopy and Microscopy, John Wiley & Sons, New York, pp. 179–252. [Google Scholar]
- 26.Lakowicz JR (1999) Principles of Fluorescence Spectroscopy, 2nd ed., Kluwer Academic/Plenum Publishers, New York, chapters 13–15, pp. 367–443. [Google Scholar]
- 27.Laws JR and Brand L (1979) J. Physiol. Chem 83, 795–802. [Google Scholar]
- 28.Gafni A and Brand L (1978) Chem. Phys. Letts 58, 346–350. [Google Scholar]
- 29.Lakowicz JR (1983) Principles of Fluorescence Spectroscopy, Plenum Press, New York, pp. 496. [Google Scholar]
- 30.Malak H, Gryczynski I, Lakowicz JR, Meyers GJ, and Castellano FN (1997) J. Fluorescence 7(2), 107–112. [DOI] [PMC free article] [PubMed] [Google Scholar]
- 31.Lakowicz JR, Malak H, Gryczynski I, Castellano FN, and Meyer GJ (1995) Biospectroscopy 1, 163–168. [Google Scholar]
- 32.Lakowicz JR and Maliwal BP (1985) Biophys. Chem 21, 61–78. [DOI] [PubMed] [Google Scholar]
- 33.Feddersen BA, Piston DW, and Gratton E (1989) Rev. Sci. Instrum 60(9), 2929–2936. [Google Scholar]
- 34.Parkhurst KM and Parkhurst LJ (1996) J. Biomed. Opt 1, 435–441. [DOI] [PubMed] [Google Scholar]
- 35.Ota N, Hirano K, Warashina M, Andrus A, Mullah B, Hatanaka K, and Taira K (1998) Nucleic Acids Res. 26(3), 735–743. [DOI] [PMC free article] [PubMed] [Google Scholar]
- 36.Kostrikis L, Tyagi S, Mhlanga MM, Ho DD, and Kramer FR(1998) Science 279, 1228–1229. [DOI] [PubMed] [Google Scholar]
- 37.Tyagi S, Bratu DP, and Kramer FR (1998) Nature Biotechnol. 16, 49–52. [DOI] [PubMed] [Google Scholar]
- 38.Brown PO and Botstein D (1999) Nature Genet. Suppl 21, 33–37. [DOI] [PubMed] [Google Scholar]
- 39.Cheung VG, Morley M, Aguilar F, Massimi A, Kucherlapati R, and Childs G (1999) Nature Genet. Suppl 21, 15–19. [DOI] [PubMed] [Google Scholar]
- 40.Hacia JG, Brody LC, and Collins FS (1998) Molec. Psychiatry 3, 483–492. [DOI] [PubMed] [Google Scholar]
- 41.Harrington CA, Rosenow C, and Retief J (2000) Curr. Opin. Microbiol 3, 285–291. [DOI] [PubMed] [Google Scholar]
- 42.Pope AJ, Haupts UM, and Moore KJ (1999) DDT 4(8), 350–362. [DOI] [PubMed] [Google Scholar]
- 43.Mere L, Bennett T, Coassin P, England P, Hamman B, Rink T,Zimmerman S, and Negulescu P (1999) DDT 4(8), 363–367. [DOI] [PubMed] [Google Scholar]


