

Abstract
Pseudomonas aeruginosa is a Gram‐negative bacterium of the proteobacteria class, and one of the most common causes of nosocomial infections. For example, it causes chronic pneumonia in cystic fibrosis patients. Patient sputum contains 2‐heptyl‐4‐hydroxyquinoline N‐oxide [HQNO] and Pseudomonas quorum sensing molecules such as the Pseudomonas quinolone signal [PQS]. It is known that HQNO inhibits the enzyme activity of mitochondrial and bacterial complex III at the Qi (quinone reduction) site, but the target of PQS is not known. In this work we have shown that PQS has a negative effect on mitochondrial respiration in HeLa and A549 cells. It specifically inhibits the complex I of the respiratory chain. In vitro analyses showed a partially competitive inhibition with respect to ubiquinone at the IQ site. In competing studies with Rotenone, PQS suppressed the ROS‐promoting effect of Rotenone, which is typical for a B‐type inhibitor. Prolonged incubation with PQS also had an effect on the activity of complex III.
Keywords: HyPer‐3, IQ site inhibition, mitochondria, Pseudomonas aeruginosa, Pseudomonas quinolone signal (PQS), Respiratory complex I, ROS
Abbreviations
- AHL
N‐acylhomoserine lactones
- AQ
2‐n‐alkyl‐4(1H)‐quinolones
- CF
Cistic fibrosis
- CI
mitochondrial complex I
- CII
mitochondrial complex II
- CIII
mitochondrial complex III
- CIV
mitochondrial complex IV
- cLSM
confocal laser scanning microscope
- DAPI
4′,6‐diamidino‐2‐phenylindole
- DCPIP
2,6‐dichlorophenol indophenol
- DFX
Deferroxamine
- DMEM
Dulbecco’s modified Eagle’s Medium
- DMSO
dimethylsulfoxide
- DPI
diphenyleneiodonium chloride
- DSMZ
Deutsche Sammlung von Mikroorganismen und Zellkulturen
- ECAR
extracellular acidification rate
- ETC
electron transport chain
- FBS
Fetal bovine sérum
- FC
ferric citrate
- FCCP
Carbonyl cyanide 4‐(trifluoromethoxy)phenylhydrazone
- FET
forward electron transfer
- FMN
Flavin mononucleotide
- G‐3‐P
Glycerol‐3 phosphate
- HEPES
4‐(2‐hydroxyethyl)‐1‐piperazineethanesulfonic acid
- HEt
Hydroethidine
- HHQ
2‐heptyl‐4‐(1H)‐quinolone
- H2O2
hydrogen peroxide
- HQNO
2‐heptyl‐4‐hydroxyquinoline N‐oxide
- IF site
flavin mononucleotide binding site
- IQ site
Q‐binding site
- LC3
Microtubule‐associated protein 1A/1B‐light chain 3
- MAS
Mitochondrial assay solution
- MEM
Minimal Essential Medium Eagle with Earle′s salts
- MPP
mitochondrial processing peptidase
- MTG
MitoTracker® Green FM
- MTS
mitochondrial‐targeting sequence
- NA
numerical aperture
- NADH
Nicotinamide adenine dinucleotide
- NEAA
non-essential amino acids
- n.s.
non-significant
- OCR
oxygen consumption rate
- PBS
Phosphate Buffered Saline
- PQS
Pseudomonas quinolone signal 2‐heptyl‐3‐hydroxy‐4(1H)‐quinolone
- PCR
polymerase chain reaction
- Q
Ubiquinone
- QS
Quorum sensing communication system
- RET
reverse electron transfer
- ROS
reactive oxygen species
- sEcGFP
superecliptic pHluorin
- MIP
maximal density structure
- t‐BHP
tert‐Butylhydroperoxide
- TCSPC
Time‐Correlated Single Photon Counting
- TMPD
tetramethyl‐p‐phenylenediamine
1. INTRODUCTION
Pseudomonas aeruginosa is a Gram‐negative bacterium of the γ‐proteobacteria class that is one of the most common causes of nosocomial infections.1, 2 In cystic fibrosis (CF) patients, P aeruginosa causes chronic pneumonia.3, 4 Due to its multiple drug resistance, P aeruginosa is difficult to treat. The bacteria have an intercellular quorum sensing communication system (QS),5 with QS molecules belonging to the N‐acylhomoserine lactones (AHL) and 2‐n‐alkyl‐4(1H)‐quinolones (AQ).4, 6 Both play a crucial role for the synthesis of many virulence factors, antibiotic resistance, and biofilm formation in P aeruginosa.1, 7 The Pseudomonas quinolone signal (PQS), 2‐heptyl‐3‐hydroxy‐4(1H)‐quinolone, is the major AQ‐type signal 5 (Figure 1). The precursor of PQS, 2‐heptyl‐4‐(1H)‐quinolone (HHQ), also acts as QS signal.5 PQS has amphiphilic properties and modulates membrane properties and intracellular packing and trafficking of antimicrobials and toxins.8 Furthermore, PQS controls the expression of its own biosynthesis gene cluster.9, 10
Figure 1.

Structural formula of the Pseudomonas quinolone signal (PQS)
PQS as well as other QS‐associated secondary metabolites of P aeruginosa do not only affect the pathogen itself but also other bacterial and host cells.11 For example, PQS was demonstrated to repress growth of other bacteria, likely by an iron‐chelating activity.12, 13, 14 A reduction in oxygen consumption was also observed.15 Effects on eukaryotic hosts include immunomodulatory activities.16, 17 In clinical samples of CF patients, 2‐heptyl‐4‐hydroxyquinoline N‐oxide (HQNO), another AQ type molecule produced by P aeruginosa, was identified. 3, 18, 19 2‐Alkyl‐4‐hydroxyquinoline N‐oxides are known to inhibit the enzyme activity of mitochondrial and bacterial complex III (CIII) at the Qi (quinone reduction) site,20, 21 which results in the formation of reactive oxygen species (ROS). ROS in mitochondria is mainly generated by the activities of the respiratory complexes I and III.22, 23 At complex I, superoxide (O2 −) and hydrogen peroxide (H2O2) are produced at substrate oxidation sites.24, 25 Complex I has two different substrate oxidation sites, the IF site, where NADH binds, and the IQ site, where the electrons are transferred to ubiquinone. Inhibitors of complex I can be categorized by their effect on ROS formation: while class A (eg, Piericidin A and Rotenone) increases ROS and class B (eg, Capsain and Stigmatellin) had no effect on ROS levels.26 IF site inhibitors, eg, diphenyleneiodonium chloride (DPI), lower ROS levels.26 With reverse electron flow, the effects of the various inhibitors on ROS production are inverted.27, 28
A recent study reported that PQS increases ROS levels in lung epithelial cells,29 but the specific target of PQS in epithelial cells was not identified. Here, we tested the hypothesis that PQS, like HQNO, affects mitochondrial respiration or the activity of respiratory complexes. Indeed, oxygen consumption measurements and activity assays of respiratory complexes revealed a strong inhibitory effect of PQS on mitochondrial respiration. Predominantly, complex I of the respiratory chain in mammalian mitochondria was inhibited but longer incubation times also affected complex III activity. In concentrations as found in the sputum of CF patients, PQS did not enhance ROS formation and suppressed the ROS promoting effect of Rotenone, leading us to conclude that PQS is a class B inhibitor.
2. MATERIAL AND METHODS
2.1. Cell culture
HeLa cells were purchased from the DSMZ (Deutsche Sammlung von Mikroorganismen und Zellkulturen). A549 cells were a kind gift of Barbara Kahl, Medizinische Mikrobiologie, University of Münster. Cells were cultured in Minimal Essential Medium Earle`s Salt (MEM++) containing 5.6 mmol/L glucose and L‐glutamine supplemented with 10% Fetal bovine serum (FBS), 1% HEPES, and 1% non‐essential amino acids (NEAA) at 37°C and 5% CO2. Cells were passaged at 90%‐95% of confluency. To detach adherent cells for splitting, cells were washed once with Dulbecco`s Phosphate Buffered Saline (PBS) and Trypsin/EDTA was used. Detached cells were transferred into new flasks after adding an appropriate volume of culture media. The day before fluorescence imaging at the confocal laser scanning microscope (cLSM), HeLa wt, and A549 cells, cells were seeded into 3 cm dishes with an initial cell count of 200.000 cells per dish (2 d before experiment 100.000 cells/dish). Cells were counted using a Neubauer chamber. For respiration measurements, cells were seeded into 96‐well plates to automatically determine oxygen consumption rates and extracellular acidification rates in an automatic analyzer (Seahorse/Agilent XFe96 Flux Analyzer). The number of cells was adapted (30.000 cells/well HeLa wt and 50.000 cells/well A549) for the automatic flux analysis in 96‐well plates. Seeded cells were incubated at 37°C and 5% CO2 until treatment/analysis. Cells were treated with 2, 10, or 100 µmol/L PQS, 10 µmol/L HQNO, 10 µmol/L HHQ, 1 or 10 µmol/L Rotenone, 10 µmol/L DPI, 300 µmol/L FC, 75 µmol/L DFX (all from Sigma), and DMSO (as solvent control) in indicated media (acute or for 1 day, indicated). For induction of reverse electron transfer (RET), cells were cultured for 1‐5 hours in Dulbecco’s Modified Eagle’s Medium (DMEM) supplemented with 1 mg/mL lipid‐rich bovine serum AlbuMAX (GIBCO) plus 0.5 mmol/L L‐carnitine hydrochloride (Sigma).
2.2. Oxygen consumption measurements
Oxygen consumption rates (OCR) and extracellular acidification rates (ECAR) of intact cells were recorded with the Seahorse XFe96 Extracellular Flux Analyzer (Agilent Technologies). A total of 30.000 cells were seeded per well of a 96‐well XF cell culture microplate 24 hours before the experiment. On the day of measurement, culture media were aspirated and cells were incubated in assay media at 37°C and 5% CO2 for 1 hour. The Mitochondrial Stress Test™ (Agilent/Seahorse) was used to determine the basal bioenergetic profile of cells. Final concentrations of injected compounds were as follows: 1 µmol/L oligomycin in port A, 0.5 µmol/L carbonyl cyanide 4‐(trifluoromethoxy)phenylhydrazone (FCCP) (HeLa wt) or 1 µmol/L FCCP (A549) in port B, and 0.5 µmol/L Rotenone/antimycin A in port C. To determine the effects of PQS, cells were treated with the inhibitor compound as indicated and incubated in MEM++ at 37°C and 5% CO2. DMSO as solvent was used as a control with a final concentration not higher than 0.05%. The sensor cartridge was calibrated with 200 µL XF Calibrant (Agilent) per well over night at 37°C and environmental CO2. Basal respiration (in 180 µL per well DMEM, Agilent), maximal respiration/spare respiratory capacity, proton leak, and non‐mitochondrial respiration were measured in the cell plate upon injections of compounds from the different ports at 37°C. For media composition, see supplementary information.
2.3. Determination of OXPHOS complexes' activity
The substrate test (Seahorse/Agilent™) is used to determine specific respiratory complex activities in cells. Therefore, oxygen consumption rate (OCR) is analyzed after permeabilization of membranes with digitonin and successive addition of specific substrates and inhibitors for individual OXPHOS complexes. Digitonin ensures access of substances by binding to cholesterol and causing formation of membrane pores. In this assay, complex I substrates, glutamate and malate, and complex II substrates, succinate and glycerol‐3‐phosphate (G‐3‐P), were added to drive complexes I + III/IV or complexes II/III/IV electron transport and oxygen consumption. Complex I was inhibited by addition of Rotenone and complex III by antimycin A. This specific inhibition leads to a reduction in oxygen consumption in presence of the substrates. To evaluate only complex IV activity (together with cytochrome c), tetramethyl‐p‐phenylenediamine (TMPD) and ascorbate were injected. TMPD is an artificial electron donor that transfers electrons directly to cytochrome c, which further transfers electrons to complex IV. Ascorbate was used to continuously reduce TMPD. Final concentrations of injected compounds were as follows: 0.5 µmol/L Rotenone in port A, 10 mmol/L Succinate plus 5‐10 mmol/L Glycerol‐3‐Phosphate in port B, 0.5 µmol/L Antimycin A in port C, and 10 mmol/L Ascorbate and 100 µmol/L TMPD in port D. After calibration and directly before the experiment, 180 µL MAS++ assay media (220 mmol/L Mannitol, 70 mmol/L Sucrose, 10 mmol/L KH2PO4, 2 mmol/L HEPES, 1 mmol/L EGTA, and 5 mmol/L MgCl2) supplemented with glutamate, malate, 0.5/1 µmol/L FCCP (HeLa wt/ A549), and 0.0006%/ 0.0012% Digitonin (HeLa wt/ A549), as well as PQS or other substances where indicated were added to the cells. Then, oxygen consumption was measured over time and upon port injections at 37°C. For media composition, inhibitor, and substrate conditions see supplementary information.
2.4. Cloning of MT‐HyPer‐3
To generate a matrix‐targeted HyPer‐3, the encoding sequence was genetically fused to a mitochondrial‐targeting sequence (mts) of the mitochondrial processing peptidase (MPP60) resulting in a MT‐HyPer‐3. This mts was already successfully used to target superecliptic pHluorin (sEcGFP) into the mitochondrial matrix.48 To generate MT‐HyPer‐3, sEcGFP was cut out from MT‐sEcGFP using EcoRI and NotI as restriction enzymes, and the sequence of HyPer‐3 was introduced. The insert HyPer‐3 was generated by PCR with pC1‐HyPer‐3 as a template using the following primers: atcggaattcatggagatggcaagccagcag (forward) and gcttgcggccgcttaaaccgcctgttttaaaacttttaaaacttttatc (reverse). pC1‐HyPer‐3 was a gift from Vsevolod Belousov (Addgene plasmid # 42131; http://n2t.net/addgene:42131; RRID:Addgene_42131). Before ligation, the HyPer‐3 PCR product was cut with NotI and EcoRI.
2.5. Fluorescence imaging
Fluorescence imaging was performed with a TCS SP8 SMD confocal laser scanning microscope (cLSM, Leica). A 63x water objective (NA 1.2) was used. Living cells were imaged at 37°C supplied with 5% CO2. HyD's with GaAsP photocathodes were used as detectors for dual‐color recording and FLIM (fluorescence lifetime imaging microscopy).
2.6. In situ ROS detection
In situ staining for superoxide (O2.‐) was performed with MitoSOX™ Red (Invitrogen). MitoSOX™ is cell permeable and accumulates in mitochondria. It is rapidly oxidized by superoxide (but not by different ROS) resulting in a highly fluorescent product.49 Cells grown on glass coverslips were treated with the compounds of interest for the indicated times. Before ROS detection, cells were stained in fresh medium for 30 minutes at 37°C with 2.5 μmol/L MitoSOX, washed once with PBS and once with medium, and then imaged in fresh medium. MitoSOX (ex./em. maxima: 510/580 nm) was excited with 510 nm and emission was collected between 530 and 630 nm. In addition, cells were stained with 1 μg/mL DAPI (ex./em. maxima: 350/470 nm) for 30 minutes at 37°C. DAPI was excited with 405 nm and emission was collected between 420 and 500 nm. Measurements of DAPI and MitoSOX fluorescence were performed consecutively.
Hydrogen peroxide (H2O2) was detected with HyPer‐3.41 Therefore, cells grown on glass coverslips were transfected with MT‐HyPer‐3. HeLa cells were transfected with calcium phosphate overnight, whereas A 549 were transfected with jetPRIME® (Polyplus transfection) for 4 hours. Cells were imaged after 24 (A549) or 48 (HeLa) hours in fresh medium. To induce oxidative stress and H2O2 production, cells expressing MT‐HyPer‐3 were treated with tert‐Butylhydroperoxide (t‐BHP; 100 μmol/L, Sigma) for up to 45 minutes. Cells were imaged at 37°C and 5% CO2. MT‐HyPer‐3 was excited corresponding to the two peaks in the absorption of the cpYFP chromophore (420 and 500 nm), using a laser diode (ex. 405 nm) and an argon laser (ex. 496 nm). The fluorescence emission was recorded from 510 to 550 nm. Instead of 420 nm excitation, we excited at 405 nm. The 405/516 emission corresponds to the protonated form of the cpYFP chromophore, the 500/516 emission to the deprotonated form of the cpYFP chromophore. Upon exposure to H2O2, the fluorescence excitation spectrum changes thereby shifting the fluorescence intensities after ratiometric excitation at 500 and 420 nm (F500/F420 ratio).41 Image analysis was done with the ImageJ open source software. To measure mitochondrial HyPer‐3 signal, the Otsu filter mask was used as a mask for mitochondria and the background was set to NaN. For ratiometric measurement, the signal 500/516 emission was divided by the signal from 405/516 nm. Recording of the fluorescence lifetime of excited MT‐HyPer‐3 was performed by Time‐Correlated Single Photon Counting (TCSPC). HyPer was excited at 488 nm using a pulsed white light laser, pulse rate 40 MHz, and the emission recorded between 500 and 550 nm. At least, 1000 photons were collected per pixel. As HyPer‐3 shows multiexponential decay,41 a tri‐exponential fitting was used for reconvolution. The resulting values for the average fluorescence lifetime were displayed using a false color scale [0.7‐2.3 ns].
2.7. Calibration of HyPer‐3 for different pH values
For calibration, MT‐HyPer‐3 expressing cells were incubated in different pH buffers. Therefore, a salt solution (125 mmol/L KCl, 20 mmol/L NaCl, 0.5 mmol/L CaCl2, and 0.5 mmol/L MgSO4) was supplemented with MES (20 mmol/L, pH 6.5), BES (20 mmol/L, pH 7.0), or HEPPSO buffer (25 mmol/L, pH 7.5 and 8.0) adjusted to the desired pH by 1 mol/L HCl or NaOH. Cellular equilibration was achieved by addition of FCCP (10 µmol/L), nigericin (1 µmol/L), and oligomycin (5 µg/mL) as previously reported for calibration of superecliptic pHluorin.50
2.8. Statistics
Data analysis was performed using Origin™. The data are presented as means in bar charts or in box‐and‐whisker plots, with boxes representing the 25th to 75th percentiles. To determine differences between treatment groups, Student t test or analysis of variance (ANOVA) for single factor (One‐way) were performed with hoc Scheffe test as a post‐test (indicated). Differences were considered to be statistically significant, if P < .05.
2.9. Preparation of mitochondria‐enriched fractions from bovine liver
Mitochondria were enriched from bovine liver tissue as described by Spinazzi et al.51 Briefly, the tissue was chopped using a tissue blender, diluted in ice‐cold homogenization buffer (10 mmol/L Tris, 40 mmol/L KCl, 2 mmol/L EDTA, 250 mmol/L sucrose, pH 7.4) and further homogenized with a pre‐cooled Potter‐type tissue grinder (15 strokes at 800 rpm). The cell homogenate was centrifuged at 1.000 × g for 10 minutes to remove debris, residual tissue, and intact cells. The supernatant was collected carefully and centrifuged at 20.000 × g for 25 minutes to yield the mitochondrial‐enriched pellet, which was washed one time with 10 mmol/L Tris (pH 7.6) and pelleted again. Finally, aliquots of the mitochondrial‐enriched suspension were flash frozen in liquid nitrogen and stored at −80°C. Before usage, mitochondria were subjected to five cycles of freeze thawing for disruption of membranes.
2.10. Isolation of mitochondria from cell culture
Mitochondria were isolated via the Qproteome Mitochondria Isolation Kit (Qiagen). Briefly, washed A549 cells were suspended in Lysis Buffer. Plasma membranes and compartmentalized organelles were pelleted by centrifugation. The resulting pellet was resuspended in Disruption Buffer and recentrifuged twice. For high‐purity preparations, the mitochondrial pellet was resuspended in Mitochondria Purification Buffer followed by subsequent density separation according to the kit. The high‐purity mitochondria were resuspended in MAS++ assay media with 10 mmol/L glutamate and 10 mmol/L malate. After staining with 2.5 µmol/L MitoSOX for 30 minutes, mitochondria were centrifuged (7000 g, 5 minutes), the pellet with mitochondria resuspended in MAS, and plated on a glass coverslip for imaging at the cLSM (λex. = 559 nm, λ em. = 620‐670 nm). Fluorescence signal intensities from mitochondria in at least 23 focal planes were analyzed with ImageJ after background subtraction.
2.11. ROS production in mitochondrial‐enriched fractions from bovine liver
Inhibitor‐induced ROS production was measured for PQS (10 µmol/L), Rotenone (10 µmol/L), or a combination of both using the ROS probe hydroethidine (HEt; 40 µmol/L). Increase in red fluorescence (λ ex/λ em: 525 nm/580‐625 nm) from oxidized HEt was followed with the plate reader Glomax® (Promega) for 30 minutes and the difference in fluorescence increase in inhibitor‐treated samples to the DMSO control were determined. Assays were carried out in modified activity buffer (50 mmol/L Tris, 0.3% w/v bovine serum albumin, pH 7.5) and conditions addressing ROS production by complex I + III/IV (400 µmol/L NADH), by complex III/IV alone (10 µmol/L Rotenone, 25 µg/mL diaphorase, and 400 µmol/L NADH), mitochondrial background (without respirable substrates), or non‐mitochondrial background (absence of mitochondria) have been applied.
2.12. Complex I activity in mitochondrial‐enriched fractions from bovine liver
Complex I activity of the mitochondrial suspension was measured by following reduction in 2,6‐dichlorophenol indophenol (DCPIP; 100 µmol/L) spectrophotometrically at 600 nm. Mitochondria were diluted in activity buffer (50 mmol/L Tris, 300 µmol/L KCN, 1 µmol/L Antimycin A, 0.3% w/v bovine serum albumin, pH 7.5) and mixed with DCPIP, decylubiquinone (DH), PQS, or DMSO as the control. The reaction was initiated by the addition of NADH (200 µmol/L). Reference samples additionally containing 10 µmol/L of the complex I–specific inhibitor Rotenone were measured in parallel to determine only Rotenone‐sensitive activity. The substrate kinetics were fitted best to Equation 1 describing mixed partial inhibition with competitive and uncompetitive inhibition constants, K i,c and Ki,u. The reaction velocity and the maximum velocity are represented by v and v max, whereas v R is the residual reaction velocity under saturating inhibitor (PQS) concentration [I]. The concentration of the substrate decylubiquinone and its Michaelis constant are [S] and K m.
| (1) |
2.13. ROS development in isolated mitochondria
Freshly isolated mitochondria from A549 and HeLa cells (n = 2 biological replicates) were stained with 500 nmol/L MitoTracker® Green (MTG, Thermo Fisher, M7514) and 2.5 µmol/L MitoSOX® in MAS buffer supplemented with glutamate and malate (MAS++) for 30 minutes. After centrifugation (2000 × g, 5 minutes), the pellet was resuspended in MAS++. Imaging was performed at a cLSM (Leica SP8 equipped with a tunable white light laser, a 63× water objective, NA: 1.2; and two GAsP detectors). Settings: λ ex. 488 nm, λ em. 500‐525 nm for MTG; λ ex. 559 nm, and λ em. 620‐670 nm for MitoSox. Fluorescence signals were analyzed with ImageJ; the mean grey value for each channel was determined for single mitochondria.
2.14. Mitophagy test
Cells were seeded on glass coverslips. 100 nmol/L MTG (30 minutes) was added to the culture medium to stain mitochondria and determine the mitochondrial area. For determination of the cell area, a dilution of 1:2000 of the CellMask™ Orange dye (Thermo Fisher, C100045) that stains the plasma membrane (10 minutes) was used. For recording the MTG fluorescence, MTG was excited with λ ex. = 488 nm, the emission was collected at λ em. 510‐530 nm; settings for the CellMask dye: λ ex = 561 nm, λ em = 620‐750 nm. To visualize autophagosomes, cells were transiently transfected with LC3::mCherry and with a plasmid encoding for the fluorescent protein clover genetically fused to subunit CoxVIIIa (CoxVIIIa::clover) in complex IV to visualize mitochondria. HeLa cells stably expressing Cox8a::clover and LC3::mCherry were imaged as following: Clover‐excitation at λ = 488 nm, emission λ = 510‐540 nm; mCherry: λ ex. = 561 nm, λ em. = 630‐700 nm with a cLSM (Leica SP8, 63× water objective, NA: 1.2; GAsP detectors).
3. RESULTS AND DISCUSSION
The effect of PQS on mitochondrial activity and respiratory complexes was tested with human lung epithelial (A549) cells and cervical cancer cells (HeLa). A549 cells were chosen as a cell model, as PQS is secreted into the lungs of patients.18, 29 The response of individual complexes to PQS was further analyzed via in vitro experiments using mitochondrial‐enriched fractions from bovine liver and from A549 cells.
3.1. PQS impairs mitochondrial respiration
We first tested the general effects of PQS on mitochondrial respiration by measuring oxygen consumption rates (OCR) with intact cells. A mitochondrial stress test with an automatic flux analyzer (Agilent/Seahorse XFe 96 Flux Analyzer) was conducted to reveal basal respiration, complex V–dependent oxygen consumption, respiratory capacity, and proton leak under control conditions and in the presence of PQS. A549 and HeLa cells showed no differences in oxygen consumption rates and response to inhibitors and the uncoupler FCCP (Figure 2A). In parallel to the OCR, the extracellular acidification rates (ECAR) were determined under the same conditions. After FCCP treatment, the ECAR of Hela cells showed a stronger drop than that of A549 cells (Figure 2B). The OCR/ECAR ratio indicates the metabolic footprint of cells: high OCR and ECAR are typical for metabolically highly active cells, high OCR and low ECAR for cells that mainly rely on oxidative phosphorylation for energy conversion, low OCR and ECAR for quiescent cells, and low OCR and high ECAR for highly glycolytic cells. To test possible effects of PQS on the metabolic state of cells, we compared the OCR/ECAR ratio (t = 15 minutes) in the absence and presence of PQS. For comparison, HQNO, a known inhibitor of respiratory complex III, and Rotenone, an inhibitor of complex I were tested. As PQS, HQNO, and Rotenone were dissolved in DMSO, DMSO was added to the medium as a control. In the following experiment, we chose a PQS concentration of 10 µmol/L PQS. However, 2 µmol/L and 100 µmol/L were also tested in some of the subsequent experiments. For sputum samples of CF patients, PQS concentrations of up to approximately 2 µmol/L were reported, however, this probably underestimates in situ concentrations due to inefficient PQS recovery during organic extraction.18 HQNO was tested at a concentration of 10 µmol/L, and Rotenone was added in a concentration of 1 µmol/L (later also 10 µmol/L). Without inhibitors, cells showed high respiratory activity. After the addition of the inhibitors, mitochondrial respiration significantly decreased. At the same time, the extracellular acidification rate increased suggesting a shift toward glycolysis and lactate production. The result was similar for all three inhibitors (Figure 2C‐D). Over time, this would probably result in an accumulation of Krebs cycle intermediates, which have signaling effect for the rebuilding of the metabolism.15 The stress test conducted in the absence and presence of PQS, HQNO, and Rotenone revealed a strong and comparable inhibitory effect on the mitochondrial respiration under non‐inhibited, uncoupled, and inhibited conditions. Acute treatment with 10 µmol/L PQS resulted in significant reduction in respiration, including basal, spare respiratory capacity, as well as complex V linked respiration in both cell lines (Figure 2E‐F). In A549 cells, proton leakage was more affected by the inhibitors than in HeLa cells. In HeLa cells, in addition, non‐ETC processes that consumed oxygen were reduced indicating secondary effects of inhibitors. For Rotenone, it is known that it also affects microtubules assembly, resulting in mitotic arrest, and eventually cell death, independently of energy‐requiring processes.30 It is not clear, though, how this is possibly related to oxygen‐dependent processes. In sum, the effects of PQS on the respiratory parameters were similar to the effects of Rotenone, which mainly is a complex I inhibitor and HQNO, which is a complex III inhibitor. However, the assay used here to record the inhibitory effect of PQS on overall respiration does not allow the identification of the specific inhibitory site at one of the complexes.
Figure 2.

PQS affects overall respiration of mitochondria in A549 and HeLa cells. A, Cells were analyzed in supplemented DMEM assay media at 37°C via Agilent/Seahorse XFe 96 Flux Analyzer. Successive addition of specific inhibitors expose oxygen consumption rates (OCR) for basal respiration, spare respiratory capacity, complex V (CV) activity, proton leak, and non‐mitochondrial OCR. B, The simultaneously measured extracellular acidification rate (ECAR). C, Correlation of the ECAR and OCR for A549. For calculation of the OCR/ECAR ratio, the values from time point 15 min were taken. Effects of PQS and additionally HQNO and Rotenone were tested. D, Correlation of the ECAR and OCR for HeLa. E, Respiratory parameters for A549 cells acutely treated with PQS, HQNO, and Rotenone. F, Respiratory parameters for HeLa cells acutely treated with PQS, HQNO, and Rotenone. N = 3 biological replicates; n = 12 technical replicates. Standard error of the mean (SEM) is shown. Data from (E) and (F) were analyzed by One‐Way ANOVA with post hoc Scheffè test
3.2. PQS specifically inhibits complex I activity in A549 and HeLa cells
To determine the specific inhibitory target(s) of PQS in the ETC, we tested the effect of PQS (and HQNO as control) on the activity of specific complexes of the respiratory chain. The OCR was monitored after stimulation of specific complexes in the absence and presence of PQS. Cells were sown and treated with digitonin to allow for substrates and inhibitors to access mitochondria. In this test, lung epithelial cells showed generally higher complex activities than HeLa cells (Figure 3A). First, we validated the inhibitory effect of HQNO on mitochondria in A549 and HeLa cells (Figure 3B). HQNO inhibited the electron flow between complexes I→III→IV and complexes II→III→IV, but did not affect complex IV activity. These data are in accordance with an inhibitory effect of HQNO on complex III.31 Next, the activities of the respiratory complexes were monitored in presence of PQS. PQS was added directly before the recording (acute treatment) or 24 hours before (long‐term treatment). The acute treatment with 2 and 10 µmol/L PQS led to a strong reduction in OCR of the ETC I→III→IV in A549 and Hela cells. As no effect was observed for the OCR of the ETC II→III→IV or on complex IV alone, the target of PQS inhibition clearly is complex I in A549 and HeLa cells. The relative inhibitory effect of PQS on complex I was stronger in HeLa cells (Figure 3D). To check whether the effect of PQS on respiration might be correlated with its iron‐chelating activity, we tested in addition the iron‐chelator deferoxamine (DFX). However, acute treatment with 75 µmol/L DFX did not significantly decrease complex I activity (Figure 3C,D). Exposure of cells to low concentrations of PQS (2 µmol/L) for 24 hours resulted in significant inhibition of complex I activity in both cell lines (Figure 3E,F), supporting the model that complex I is the primary target. Higher PQS concentrations (10 µmol/L) had a strong inhibitory effect on the ETC of complexes I/III/IV as well as on II/III/IV. Since complex IV activity was not significantly affected under those conditions, we interpret that exposure to 10 µmol/L PQS for 24 hours in addition affected complex III activity. The same effects were obtained by 24 hours incubation with DFX, the iron‐chelator compound (Figure 3E,F). In sum, we found short‐term effects of PQS mainly on complex I and long‐term (plus high concentration) effects also on complex III.
Figure 3.

PQS inhibits respiratory complex I and HQNO complex III. Effects of HQNO and PQS on mitochondrial electron transport chains and complexes. A, Oxygen consumption rates (OCR) of the CI→CIII→CIV ETC and the CII→CIII→CIV ETC. Medium composition: glutamate and malate (complex I substrates), FCCP (uncoupler), and digitonin (for mitochondrial permeabilization). Glycerin‐3‐phosphate (G‐3‐P) and succinate were added as substrates for CII, Antimycin A as inhibitor of CIII, and Ascorbate (Asc) and trimethyl pentanediol (TMPD) to stimulate CIV. B, Acute HQNO (10 µmol/L) effects on the OCR of CI→CIII→CIV, CII→CIII→CIV, and CIV, respectively. C, PQS and DFX effects on CI→CIII→CIV and CII→CIII→CIV ETC activity in A549 cells (acute treatment). D, Quantification of CI→CIII→CIV and CII→CIII→CIV ETC activity in HeLa cells upon acute PQS and DFX addition at indicated concentrations. E, Effect of long‐term treatment with PQS and DFX, respectively, on CI→CIII→CIV and CII→CIII→CIV ETC activity in A549 cells (F) and in HeLa cells. N = 3 biological replicates; n ≥ 12 technical replicates. Error: standard error of the mean. Data in (B) were analyzed by Student t test. Data in (C‐F) were analyzed by One‐Way ANOVA with post hoc Tukey test
3.3. PQS acts in a partially competitive manner against decylubiquinone in vitro
To specify the mechanism of complex I inhibition by PQS, we prepared fractions enriched in mitochondria from bovine liver tissue for in vitro analyses. Kinetics with the substrate analog decylubiquinone at different PQS concentrations were measured by following the reduction in 2,6‐dichlorophenol indophenol (DCPIP) (Figure 4A), which accepts electrons from complex I. NADH was used as electron donor. Analyzing the Michaelis‐Menten plots of the relative reaction velocities revealed that a mixed‐type inhibition according to Equation 1 (see Methods section) fitted the data best, indicating that PQS partially competes with decylubiquinone, but has at least two binding modes or binding sites within complex I. An analogous partially competitive inhibition with regard to ubiquinone was reported for the IQ site inhibitor Piericidin A.32, 33 The mixed‐inhibition type is consistent with the notion that several Q‐binding sites and different binding positions of quinone‐site inhibitors may exist within the quinone channel.34, 35, 36, 37, 38 The two inhibition constants representing the competitive and uncompetitive components of the inhibition (Ki,c and Ki,u) were 0.56 and 0.12 µmol/L, respectively. Complex I retained a low residual activity of 15.8% even at saturating concentrations of PQS, possibly due to leakage of electrons from prosthetic groups such as FMN to DCPIP.39
Figure 4.
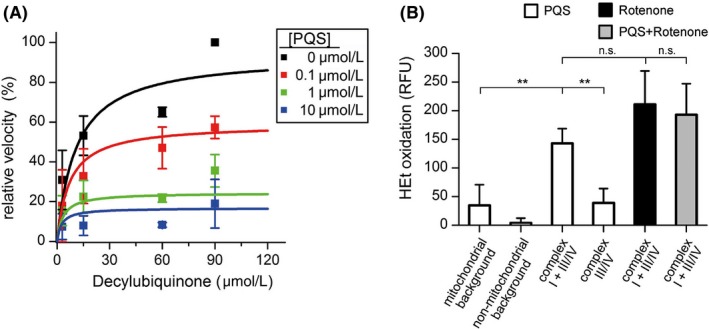
Complex I kinetics in the presence of different PQS concentrations and ROS production in response to inhibitors. Enriched mitochondria from bovine liver were used in this in vitro assay. A, Activity of complex I at different concentrations of the substrate decylubiquinone was measured in the presence of 0 µmol/L (black), 0.1 µmol/L (red), 1 µmol/L (green), and 10 µmol/L (blue) PQS. Symbols and error bars represent the means and standard deviations of three independent tissue and mitochondria preparations (n = 3), which were used in two individual experiments each measured in triplicate. B, Complex I inhibition increases mitochondrial ROS levels. Treatment of mitochondria with complex I inhibitors results in an increase in red HEt fluorescence (RFU, relative fluorescence units) indicating ROS production under conditions of FET. The bars depict the differences between inhibitor‐treated samples and DMSO controls after 30 min of incubation. Concentration of compounds: NADH (400 µmol/L), PQS (10 µmol/L, white bars), Rotenone (10 µmol/L black bar), and PQS plus Rotenone (10 µmol/L each, gray bar). Non‐mitochondrial background was measured without mitochondria and the mitochondrial background was measured in the absence of respirable substrate. Adding 400 µmol/L NADH enabled measurement of complex I + III/IV, whereas the additional presence of Rotenone (10 µmol/L) and diaphorase (25 µg/mL) bypassed complex I and revealed only complex III/IV–mediated ROS production. Bars and errors represent means and standard deviations of four independent mitochondria preparations (n = 4), which were measured in 8‐11 replicates. Significances were evaluated by One‐way ANOVA (**, P < .01; n.s., P > .05)
3.4. PQS promotes ROS generation at mitochondrial complex I in vitro
To investigate whether in vitro inhibition of complex I activity by PQS can account for the PQS‐induced increase in cellular ROS production, described by Abdalla et al (2017), a modified biochemical assay in the presence of the radical‐sensitive probe hydroethidine (HEt) was performed. Mitochondria were isolated from liver and permeabilized by repeated freezing‐thawing cycles. When the activity of mitochondrial complex I (and subsequent complexes III/IV) was induced with NADH, the red fluorescence resulting from HEt oxidation products in PQS‐treated samples increased compared with control samples without PQS, indicating higher ROS values (Figure 4B). Background measurements, in the absence of respirable substrates, revealed only a slight increase in HEt oxidation induced by PQS. To discriminate between complex I and complex III/IV derived ROS, control measurements, where complex III/IV were directly addressed by inhibiting and bypassing complex I, were performed. The PQS‐induced increase in HEt oxidation by complex III/IV was comparable with the mitochondrial background, therefore complex I inhibited by PQS is the main source for the increased ROS production in the in vitro setup. Under the conditions of the assay (forward electron transfer [FET]), the ROS production induced by PQS was similar to the Rotenone‐induced response (Figure 4B). When both inhibitors, PQS and Rotenone, were present, the level of HEt oxidation was almost equal to the level observed with Rotenone only. If PQS would additionally induce ROS at a complex other than complex I, increased HEt oxidation would have had to be observed under these conditions. The absence of such a cumulative effect strongly suggests an exclusive and maximal inhibition of complex I.
3.5. PQS effects on superoxide formation in live cells
In the following we attempted to determine the effect of PQS as a complex I inhibitor on ROS production in mitochondria of live cells. To determine O2 − and H2O2 produced by inhibited complex I we used two sensors: MitoSOX™ Red and HyPer‐3. MitoSOX is a matrix‐targeted triphenylphosphonium cation conjugated to hydroethidine (HEt). It is reported to respond to superoxide formation by increased red fluorescence. HyPer‐3 is a hydrogen peroxide–specific fluorescence sensor composed of a cyclic permutated YFP fused to a natural hydrogen peroxide sensor from bacteria, OxyR.40 To target it to mitochondria, it was genetically fused to the mitochondrial‐targeting sequence (MT) of the mitochondrial processing peptidase (MPP). The response of the hydrogen peroxide sensor can be read out by ratiometric imaging (intensity based) or by fluorescence lifetime recording.41 The fluorescence lifetime decreases with increasing hydrogen peroxide levels as shown by treatment with t‐BHP (Figure S1). The intensity‐based ratiometric readout is also pH sensitive, though, while the fluorescence lifetime of HyPer is pH insensitive between pH 7.0 and 8.0 (Figure S1D), which is the relevant matrix pH range.42 Increased hydrogen peroxide levels result in a decreased fluorescence lifetime.
We determined the effect of PQS on mitochondrial ROS levels under conditions of FET and RET. For comparison, also Rotenone as an IQ site and DPI, an IF site inhibitor, were tested.
First, we tested the effect of PQS on hydrogen peroxide production. A549 cells expressing the matrix‐targeted hydrogen peroxide sensor mt‐HyPer‐3 displayed no changes in HyPer‐3 fluorescence lifetime and thus no changes in matrix H2O2 after treatment with PQS, Rotenone, or diphenyleneiodonium chloride (DPI) under FET conditions (Figure 5A). In HeLa cells, the HyPer sensor reported increase in H2O2 due to Rotenone inhibition, PQS had no effect, and DPI treatment resulted in significant ROS decrease (Figure 5B). Clearly, Rotenone and DPI had opposite effects which is in line with the classification of Rotenone as a class A inhibitor at the IQ site and DPI as an inhibitor at the IF site of complex I. To induce reverse electron transport from succinate to NAD+, cells were grown for several hours in lipid‐rich medium, which is supposed to induce RET.43 As expected, the IF site inhibitor DPI led to increased H2O2 in A549 under these conditions (Figure 5C), while Rotenone and PQS had no obvious effect. Again, HeLa cells showed a different response than A549 cells: Rotenone decreased H2O2 (P ≤ .001), whereas DPI increased H2O2 similar as in A549 cells. PQS slightly (P ≤ .01) decreased H2O2 under RET conditions (Figure 5D). This behavior indicates that PQS obviously is not an IF site inhibitor, as it has adverse effects than DPI, but rather is a complex I inhibitor binding to the IQ site.
Figure 5.

PQS inhibition of complex I does not alter acute mitochondrial hydrogen peroxide levels in situ. ROS levels were determined in live cells under FET and RET conditions. A, Matrix HyPer‐3 fluorescence lifetime measurements to monitor H2O2 in A549 upon inhibition of complex I by acute treatment with 10 µmol/L PQS, 1 µmol/L Rotenone, and 10 µmol/L DPI, respectively, under FET. B, Analysis of matrix HyPer‐3 in HeLa upon acute treatment with 10 µmol/L PQS, 1 µmol/L Rotenone, or 10 µmol/L DPI under FET. C, Analysis of MT‐HyPer‐3 fluorescence lifetime in A549 cells upon acute addition of 10 µmol/L PQS, 1 µmol/L Rotenone, or 10 µmol/L DPI under RET (1.5 h lipid‐rich medium) to monitor changes in hydrogen peroxide. D, Analysis of MT‐HyPer‐3 in HeLa upon acute addition of 10 µmol/L PQS, 1 µmol/L Rotenone, or 10 µmol/L DPI under RET (1.5 h lipid‐rich medium). E, Acute treatment of MT‐HyPer‐3 transfected HeLa cells with 1 µmol/L Rotenone as class A inhibitor only or in combination with 10 µmol/L PQS in a competitive assay. Control: DMSO. F, Fluorescence lifetime images of the transfected HeLa cells with acute PQS and Rotenone treatment. False color scale used to depict different lifetimes. Biological replicates N = 3. Box plot data were analyzed by One‐Way ANOVA with post hoc Scheffè test; *** = P < .001, **= P < .01, *= P < .05, n.s. = non‐significant
Next, MitoSOX was used to record superoxide in A549 and HeLa cells. Superoxide is the precursor of hydrogen peroxide in mitochondrial ROS formation. We could not detect any increase in red fluorescence after PQS treatment (10 µmol/L) in A549 or HeLa cells, suggesting that PQS did not cause measurable stationary superoxide formation under these conditions. Surprisingly, PQS treatment of A549 cells triggered a reduction in superoxide levels (Figure 6A, 6), whereas in HeLa cells PQS (10 µmol/L) had no effect on superoxide levels (Figure 6B,D). DMSO was the loading control. When we used a higher PQS concentration (100 µmol/L), the fluorescence of MitoSOX increased significantly after 2 hours, indicating oxidative stress, but only in HeLa cells. In the study by Abdalla et al (2017), increased cellular and mitochondrial ROS levels upon PQS treatment (40 µg/L = 154 µmol/L, 4 hours) were reported using HEt and MitoSOX. High levels of PQS (100 µmol/L), however, had also cytotoxic effects in A549 cells. HeLa cells were more sensitive, already 10 µmol/L PQS‐induced cell death as we could show (Figure S2). To distinguish intact from dying cells in microscopy analysis, we used DAPI as a nuclear marker. DAPI only penetrates permeabilized or death cells (Figure 6C,D). Indeed, in the presence of 100 µmol/L PQS, a number of DAPI‐positive cells were found. In these cells, the MitoSOX signal was also more diffuse with a strong signal in the nucleus indicating lysis of mitochondria and onset of apoptosis. In the experiments shown here, only intact cells were analyzed for superoxide determination, which might be different from the analysis performed in the Abdalla et al study.29
Figure 6.

High concentrations of PQS increase mitochondrial superoxide and decrease cell viability. A, Living A549 cells were stained with DAPI (blue) and the superoxide indicator MitoSOX (red) and treated with PQS (100 µmol/L) or DMSO (0.5%) for 2 h. The depicted images are the summed signals from Z stacks. B, Living HeLa cells stained with DAPI and MitoSOX, MIP are shown. PQS or DMSO treatment as indicated. Note that DAPI only stains nuclei of permeabilized cells, which were excluded for MitoSOX analysis. C, MitoSOX fluorescence under different conditions (mean grey values of single cells, analyzed by ImageJ). Acute and 2 h treatment with 10 μmol/L and 100 µmol/L PQS was analyzed and compared with the according DMSO controls. PQS was solubilized in the respective DMSO concentrations. D, MitoSOX fluorescence in control and PQS‐treated HeLa cells. Acute and 2 h treatment with 10 and 100 µmol/L PQS. Mean grey values of single cells were determined (ImageJ). DMSO controls were not significantly different from a control without DMSO. E, Acute treatment of A549 with DMSO as control (in this case 0.1% DMSO + 0.5% DMSO), 1 µmol/L Rotenone, and 10 µmol/L PQS plus 1 µmol/L Rotenone, respectively. F, Acute treatment of HeLa cells same as (E). Data were analyzed by One‐Way ANOVA with post hoc Scheffè test; *** = P < .001, **= P < .01, *= P < .05. G, Freshly isolated mitochondria from A549 cells were incubated in buffer containing 10 mmol/L glutamate and 10 mmol/L malate, stained with 2.5 µmol/L MitoSOX, and imaged at the cLSM. Acute treatment with 10 μmol/L PQS, 1 µmol/L and 10 µmol/L Rotenone, and combinations was performed. DMSO concentration as vehicle control was 0.05%. MitoSOX fluorescence signals (mean grey values) were analyzed with ImageJ. H, Freshly isolated mitochondria from HeLa cells were incubated in buffer containing 10 mmol/L glutamate and 10 mmol/L malate, stained with 2.5 μmol/L MitoSOX and imaged at the cLSM. Treatments and analysis as described in G (but not with 10 μmol/L Rotenone). Data were analyzed by One‐Way ANOVA with post hoc Scheffè test; *** = P < .001, **= P < .01, *= P < .05, n.s. = non‐significant, N = 1, more than 15 cells per condition evaluated. Scale bars: 10 µmol/L (A, B)
3.6. PQS neutralizes Rotenone effects on ROS formation like a B‐class inhibitor
As mentioned before, IQ site inhibitors are classified according to their effect on ROS production. At the IQ site, the combination of a class B inhibitor with a Class A inhibitor abolished the ROS production stimulated by the latter.26 To test, whether PQS could be considered as a class B inhibitor, Rotenone (class A inhibitor) was compared with PQS effects. PQS was applied in combination with Rotenone. When A549 cells were treated with Rotenone, the MitoSOX signal was lower than in the DMSO control as for PQS and Rotenone in combination (Figure 6E). The lower MitoSOX fluorescence signal in PQS plus Rotenone‐treated cells indicates lower superoxide levels in response to the inhibitors. In HeLa cells, the effect of Rotenone was different: Rotenone significantly increased superoxide levels. It has to be mentioned that the effect of Rotenone on ROS production in cells is not consistent, depending on the ROS defense,22 which is obviously specific in A594 cells.44, 45 To investigate whether Rotenone would in principle increase ROS in A594 cells, we additionally performed inhibitor treatment with isolated mitochondria from A549 cells based on observations that the ROS defense mechanism is often lost during mitochondrial isolation.39 We expected that we could now measure ROS production.10 In contrast to in cellulo measurements, we found increased ROS production induced by 1‐10 µmol/L Rotenone (Figure 6G), similar to that observed in mitochondria‐enriched fractions from the liver (Figure 4B). When PQS (10 µmol/L) and Rotenone (1‐10 µmol/L) were applied together to isolated mitochondria, the measured ROS value was not higher than in the control. Similar results were obtained with isolated mitochondria from HeLa cells. While 1 μmol/L Rotenone increased ROS production, 10 μmol/L PQS alone even decreased ROS production and additional treatment of 1 μmol/L Rotenone plus 10 μmol/L PQS resulted in a lower ROS value than Rotenone alone (Figure 6H). These results support a ROS‐suppressive function of PQS and are consistent with the mode of action of a class B inhibitor type of the complex.26
3.7. PQS treatment does not stimulate mitophagy
Elevated ROS values can induce mitophagy.46 To investigate whether PQS treatment would modulate the degree of mitophagy in HeLa cells, the distribution of the fusion protein LC3::mCherry after PQS treatment was compared with the control. During the activation of autophagy pathways, 22 amino acids are cleaved from the C‐terminus of LC3 to form LC3‐II which selectively localizes in newly formed autophagosomes. To measure autophagy, the LC3::mCherry distribution was determined as the SD/mean ratio. Deviations of the signal (SD) across the cell in relation to the mean signal intensity are a measure for the localization of the signal.47 Quantification of the LC3::mCherry translocation showed that the average SD/mean ratio in PQS‐treated samples was not statistically significantly different with respect to controls (Figure S3). Thus, acute treatment of PQS (10 µmol/L) did not stimulate mitophagy.
4. SUMMARY AND CONCLUSION
In this study we showed for the first time the specific inhibitory effect of PQS, the Pseudomonas quinolone signal, on the respiratory complex I in the mitochondria. In vitro analyses suggest that PQS binds to the IQ site of complex I, and is partially competitive with ubiquinone. When PQS was added in combination with Rotenone, it suppressed Rotenone‐induced ROS production, which is a feature of class B inhibitors.26 It is noteworthy that class B inhibitors also appear to act on complex III, an effect that we have also observed when higher PQS concentrations were given over prolonged periods of time (1 day). Future experiments must show whether the PQS effect on complex III is actually due only to the effect of a class B inhibitor or is also related to the iron‐chelating effect attributed to PQS.13 The observation that inhibition of complex I by Rotenone did not lead to an increase in mitochondrial ROS in intact A549 cells (unlike HeLa cells) confirms earlier observations that A549 cells are less sensitive to ROS‐inducing drug treatment.44 In contrast, isolated mitochondria from A549 cells also showed a ROS increase due to Rotenone (but not PQS) treatment, confirming the frequent observation that the cellular ROS defense mechanism may be lost during mitochondrial isolation.44 As described earlier,29 the effect of PQS on cells is concentration dependent, very high PQS values (100 µmol/L) led to cell death as indicated by the penetration of DAPI into cells, and significantly increased cellular and nuclear ROS values. In summary, we conclude that PQS at concentrations as in the sputum range of CF patients is sufficient to inhibit complex I at the IQ site without stimulating ROS formation.
CONFLICT OF INTERESTS
The authors do not declare any competing financial interests.
AUTHOR CONTRIBUTIONS
Conception and design: KBB, S. F., BR, ST Acquisition of data: ST, BR, MO, FD Analysis and interpretation of data: KBB, SF, BR, ST Wrote the article: KBB Reviewing: SF, BR, ST
Supporting information
Rieger B, Thierbach S, Ommer M, Dienhart FSV, Fetzner S, Busch KB. Pseudomonas Quinolone Signal molecule PQS behaves like a B Class inhibitor at the IQ site of mitochondrial complex I. FASEB BioAdvances. 2020;2:188–202. 10.1096/fba.2019-00084
Funding information
Financial support by the Deutsche Forschungsgemeinschaft (grant FE 383/25‐1 to SF) is gratefully acknowledged. KB and BR are associated with the Cells in Motion Interfaculty Centre (CiM).
REFERENCES
- 1. Cross A, Allen JR, Burke J, et al. Nosocomial infections due to Pseudomonas aeruginosa: review of recent trends. Rev Infect Dis. 1983;5(Suppl 5):S837‐S845. [DOI] [PubMed] [Google Scholar]
- 2. Obritsch MD, et al. Nosocomial infections due to multidrug‐resistant Pseudomonas aeruginosa: epidemiology and treatment options. Pharmacotherapy. 2005;25(10):1353‐1364. [DOI] [PubMed] [Google Scholar]
- 3. Barr HL, et al. Pseudomonas aeruginosa quorum sensing molecules correlate with clinical status in cystic fibrosis. Eur Respir J. 2015;46(4):1046‐1054. [DOI] [PMC free article] [PubMed] [Google Scholar]
- 4. Wade DS, Calfee MW, Rocha ER, et al. Regulation of Pseudomonas quinolone signal synthesis in Pseudomonas aeruginosa. J Bacteriol. 2005;187(13):4372‐4380. [DOI] [PMC free article] [PubMed] [Google Scholar]
- 5. Pesci EC, Milbank JBJ, Pearson JP, et al. Quinolone signaling in the cell‐to‐cell communication system of Pseudomonas aeruginosa. Proc Natl Acad Sci USA. 1999;96(20):11229‐11234. [DOI] [PMC free article] [PubMed] [Google Scholar]
- 6. Fuqua WC, Winans SC, Greenberg EP. Quorum sensing in bacteria: the LuxR‐LuxI family of cell density‐responsive transcriptional regulators. J Bacteriol. 1994;176(2):269‐275. [DOI] [PMC free article] [PubMed] [Google Scholar]
- 7. Williams P, Winzer K, Chan WC, Cámara M. Look who's talking: communication and quorum sensing in the bacterial world. Philos Trans R Soc Lond B Biol Sci. 2007;362(1483):1119‐1134. [DOI] [PMC free article] [PubMed] [Google Scholar]
- 8. Schertzer JW, Whiteley M. A bilayer‐couple model of bacterial outer membrane vesicle biogenesis. MBio. 2012;3(2): e00297-11 10.1128/mBio.00297-11. [DOI] [PMC free article] [PubMed] [Google Scholar]
- 9. Maura D, et al. Evidence for direct control of virulence and defense gene circuits by the pseudomonas aeruginosa quorum sensing regulator. MvfR. Sci Rep. 2016;6:34083. [DOI] [PMC free article] [PubMed] [Google Scholar]
- 10. Rampioni G, Falcone M, Heeb S, et al. Unravelling the genome‐wide contributions of specific 2‐alkyl‐4‐quinolones and PqsE to quorum sensing in pseudomonas aeruginosa. PLoS Pathog. 2016;12(11):e1006029. [DOI] [PMC free article] [PubMed] [Google Scholar]
- 11. Lin J, et al. The Pseudomonas Quinolone Signal (PQS): not just for quorum sensing anymore. Front Cell Infect Microbiol. 2018;8:230. [DOI] [PMC free article] [PubMed] [Google Scholar]
- 12. Mashburn LM, Jett AM, Akins DR, Whiteley M. Staphylococcus aureus serves as an iron source for Pseudomonas aeruginosa during in vivo coculture. J Bacteriol. 2005;187(2):554‐566. [DOI] [PMC free article] [PubMed] [Google Scholar]
- 13. Bredenbruch F, Geffers R, Nimtz M, Buer J, Haussler S. The Pseudomonas aeruginosa quinolone signal (PQS) has an iron‐chelating activity. Environ Microbiol. 2006;8(8):1318‐1329. [DOI] [PubMed] [Google Scholar]
- 14. Diggle SP, Matthijs S, Wright VJ, et al. The Pseudomonas aeruginosa 4‐quinolone signal molecules HHQ and PQS play multifunctional roles in quorum sensing and iron entrapment. Chem Biol. 2007;14(1):87‐96. [DOI] [PubMed] [Google Scholar]
- 15. Janssen JJE, et al. Mito‐nuclear communication by mitochondrial metabolites and its regulation by B‐vitamins. Front Physiol. 2019;10:78. [DOI] [PMC free article] [PubMed] [Google Scholar]
- 16. Hooi DSW, Bycroft BW, Chhabra SR, Williams P, Pritchard DI. Differential immune modulatory activity of Pseudomonas aeruginosa quorum‐sensing signal molecules. Infect Immun. 2004;72(11):6463‐6470. [DOI] [PMC free article] [PubMed] [Google Scholar]
- 17. Kim K, et al. HHQ and PQS, two Pseudomonas aeruginosa quorum‐sensing molecules, down‐regulate the innate immune responses through the nuclear factor‐kappaB pathway. Immunology. 2010;129(4):578‐588. [DOI] [PMC free article] [PubMed] [Google Scholar]
- 18. Collier DN, Anderson L, McKnight SL, et al. A bacterial cell to cell signal in the lungs of cystic fibrosis patients. FEMS Microbiol Lett. 2002;215(1):41‐46. [DOI] [PubMed] [Google Scholar]
- 19. Fugère A, Lalonde Séguin D, Mitchell G, et al. Interspecific small molecule interactions between clinical isolates of pseudomonas aeruginosa and staphylococcus aureus from adult cystic fibrosis patients. PLoS ONE. 2014;9(1):e86705. [DOI] [PMC free article] [PubMed] [Google Scholar]
- 20. Cooley JW, Ohnishi T, Daldal F. Binding dynamics at the quinone reduction (Q(i)) site influence the equilibrium interactions of the iron sulfur protein and hydroquinone oxidation (Q(o)) site of the cytochrome bc(1) complex. Biochemistry. 2005;44(31):10520‐10532. [DOI] [PMC free article] [PubMed] [Google Scholar]
- 21. Halestrap AP. The pathway of electron flow through ubiquinol:cytochrome c oxidoreductase in the respiratory chain. Evidence from inhibition studies for a modified 'Q cycle'. Biochem J. 1982;204(1):49‐59. [DOI] [PMC free article] [PubMed] [Google Scholar]
- 22. Drose S, Brandt U. Molecular mechanisms of superoxide production by the mitochondrial respiratory chain. Adv Exp Med Biol. 2012;748:145‐169. [DOI] [PubMed] [Google Scholar]
- 23. King MS, Sharpley MS, Hirst J. Reduction of hydrophilic ubiquinones by the flavin in mitochondrial NADH:ubiquinone oxidoreductase (Complex I) and production of reactive oxygen species. Biochemistry. 2009;48(9):2053‐2062. [DOI] [PMC free article] [PubMed] [Google Scholar]
- 24. Brand MD. The sites and topology of mitochondrial superoxide production. Exp Gerontol. 2010;45(7–8):466‐472. [DOI] [PMC free article] [PubMed] [Google Scholar]
- 25. Grivennikova VG, Vinogradov AD. Partitioning of superoxide and hydrogen peroxide production by mitochondrial respiratory complex I. Biochim Biophys Acta. 2013;1827(3):446‐454. [DOI] [PubMed] [Google Scholar]
- 26. Fato R, Bergamini C, Bortolus M, et al. Differential effects of mitochondrial Complex I inhibitors on production of reactive oxygen species. Biochim Biophys Acta. 2009;1787(5):384‐392. [DOI] [PMC free article] [PubMed] [Google Scholar]
- 27. Scialo F, Fernandez‐Ayala DJ, Sanz A. Role of mitochondrial reverse electron transport in ROS signaling: potential roles in health and disease. Front Physiol. 2017;8:428. [DOI] [PMC free article] [PubMed] [Google Scholar]
- 28. Liu Y, Fiskum G, Schubert D. Generation of reactive oxygen species by the mitochondrial electron transport chain. J Neurochem. 2002;80(5):780‐787. [DOI] [PubMed] [Google Scholar]
- 29. Abdalla MY, Hoke T, Seravalli J, et al. Pseudomonas quinolone signal induces oxidative stress and inhibits heme oxygenase‐1 expression in lung epithelial cells. Infect Immun. 2017;85(9):e00176-17 10.1128/IAI.00176-17. [DOI] [PMC free article] [PubMed] [Google Scholar]
- 30. Marshall LE, Himes RH. Rotenone inhibition of tubulin self‐assembly. Biochim Biophys Acta. 1978;543(4):590‐594. [DOI] [PubMed] [Google Scholar]
- 31. Burger G. Binding and inhibitory effect of 2‐heptyl‐4‐hydroxyquinoline‐N‐oxide in the presence of ubiquinone‐3 in Saccharomyces cerevisiae. Eur J Biochem. 1980;106(2):661‐665. [DOI] [PubMed] [Google Scholar]
- 32. Friedrich T, et al. Two binding sites of inhibitors in NADH: ubiquinone oxidoreductase (complex I). Relationship of one site with the ubiquinone‐binding site of bacterial glucose:ubiquinone oxidoreductase. Eur J Biochem. 1994;219(1–2):691‐698. [DOI] [PubMed] [Google Scholar]
- 33. Ueno H, Miyoshi H, Ebisui K, Iwamura H. Comparison of the inhibitory action of natural rotenone and its stereoisomers with various NADH‐ubiquinone reductases. Eur J Biochem. 1994;225(1):411‐417. [DOI] [PubMed] [Google Scholar]
- 34. Fedor JG, Jones AJY, Di Luca A, Kaila VRI, Hirst J. Correlating kinetic and structural data on ubiquinone binding and reduction by respiratory complex I. Proc Natl Acad Sci USA. 2017;114(48):12737‐12742. [DOI] [PMC free article] [PubMed] [Google Scholar]
- 35. Fendel U, Tocilescu MA, Kerscher S, Brandt U. Exploring the inhibitor binding pocket of respiratory complex I. Biochim Biophys Acta. 2008;1777(7–8):660‐665. [DOI] [PubMed] [Google Scholar]
- 36. Haapanen O, Djurabekova A, Sharma V. Role of second quinone binding site in proton pumping by respiratory complex I. Front Chem. 2019;7:221. [DOI] [PMC free article] [PubMed] [Google Scholar]
- 37. Uno S, Kimura H, Murai M, Miyoshi H. Exploring the quinone/inhibitor‐binding pocket in mitochondrial respiratory complex I by chemical biology approaches. J Biol Chem. 2019;294(2):679‐696. [DOI] [PMC free article] [PubMed] [Google Scholar]
- 38. Warnau J, Sharma V, Gamiz‐Hernandez AP, et al. Redox‐coupled quinone dynamics in the respiratory complex I. Proc Natl Acad Sci USA. 2018;115(36):E8413‐E8420. [DOI] [PMC free article] [PubMed] [Google Scholar]
- 39. Lenaz G, Fato R, Genova ML, Bergamini C, Bianchi C, Biondi A. Mitochondrial complex I: structural and functional aspects. Biochim Biophys Acta. 2006;1757(9–10):1406‐1420. [DOI] [PubMed] [Google Scholar]
- 40. Belousov VV, Fradkov AF, Lukyanov KA, et al. Genetically encoded fluorescent indicator for intracellular hydrogen peroxide. Nat Methods. 2006;3(4):281‐286. [DOI] [PubMed] [Google Scholar]
- 41. Bilan DS, et al. HyPer‐3: a genetically encoded H(2)O(2) probe with improved performance for ratiometric and fluorescence lifetime imaging. ACS Chem Biol. 2013;8(3):535‐542. [DOI] [PubMed] [Google Scholar]
- 42. Santo‐Domingo J, Demaurex N. Perspectives on: SGP symposium on mitochondrial physiology and medicine: the renaissance of mitochondrial pH. J Gen Physiol. 2012;139(6):415‐423. [DOI] [PMC free article] [PubMed] [Google Scholar]
- 43. Guarás A, Perales‐Clemente E, Calvo E, et al. The CoQH2/CoQ ratio serves as a sensor of respiratory chain efficiency. Cell Rep. 2016;15(1):197‐209. [DOI] [PubMed] [Google Scholar]
- 44. Huang BK, Langford TF, Sikes HD. Using sensors and generators of H2O2 to elucidate the toxicity mechanism of piperlongumine and phenethyl isothiocyanate. Antioxid Redox Signal. 2016;24(16):924‐938. [DOI] [PMC free article] [PubMed] [Google Scholar]
- 45. Huang H, Dong F, Tian Y. Mitochondria‐targeted ratiometric fluorescent nanosensor for simultaneous biosensing and imaging of O2(*‐) and pH in live cells. Anal Chem. 2016;88(24):12294‐12302. [DOI] [PubMed] [Google Scholar]
- 46. Basit F, van Oppen LMPE, Schöckel L, et al. Mitochondrial complex I inhibition triggers a mitophagy‐dependent ROS increase leading to necroptosis and ferroptosis in melanoma cells. Cell Death Dis. 2017;8(3):e2716. [DOI] [PMC free article] [PubMed] [Google Scholar]
- 47. Campanella M, Seraphim A, Abeti R, Casswell E, Echave P, Duchen MR. IF1, the endogenous regulator of the F(1)F(o)‐ATPsynthase, defines mitochondrial volume fraction in HeLa cells by regulating autophagy. Biochim Biophys Acta. 2009;1787(5):393‐401. [DOI] [PubMed] [Google Scholar]
- 48. Rieger B, et al. Lifetime imaging of GFP at CoxVIIIa reports respiratory supercomplex assembly in live cells. Sci Rep. 2017;7:46055. [DOI] [PMC free article] [PubMed] [Google Scholar]
- 49. Robinson KM, Janes MS, Pehar M, et al. Selective fluorescent imaging of superoxide in vivo using ethidium‐based probes. Proc Natl Acad Sci USA. 2006;103(41):15038‐15043. [DOI] [PMC free article] [PubMed] [Google Scholar]
- 50. Rieger B, Junge W, Busch KB. Lateral pH gradient between OXPHOS complex IV and F(0)F(1) ATP‐synthase in folded mitochondrial membranes. Nat Commun. 2014;5:3103. [DOI] [PubMed] [Google Scholar]
- 51. Spinazzi M, Casarin A, Pertegato V, Salviati L, Angelini C. Assessment of mitochondrial respiratory chain enzymatic activities on tissues and cultured cells. Nat Protoc. 2012;7(6):1235‐1246. [DOI] [PubMed] [Google Scholar]
Associated Data
This section collects any data citations, data availability statements, or supplementary materials included in this article.
Supplementary Materials