

Abstract
Dynamic fission and fusion events regulate mitochondrial shape, distribution, and rejuvenation, and proper control of these processes is essential for neuronal homeostasis. Here, we report that Gas7, a known cytoskeleton regulator, controls mitochondrial dynamics within neurons of the central nervous system. In this study, we generated an improved Gas7‐knockout mouse and evaluated its mitochondrial phenotype. We first identified Gas7 in mitochondrial fractions from wild‐type brain tissue, and observed Gas7 colocalization with mitochondria in primary cortical neurons. In Gas7‐deficient brain tissue and neuronal cultures mitochondria were elongated with perinuclear clustering. These morphological abnormalities were associated with increased levels mitochondrial fusion proteins and increased PKA‐dependent phosphorylation of Drp‐1 in brain tissues, suggesting an imbalance of mitochondrial fusion and fission. Moreover, expression of mitochondrial quality control kinase, PINK1, and PINK1‐specific phosphorylation of Mfn‐2 (S442), Parkin (S65), and ubiquitin (S65) were all reduced in the knockout cells. Ectopic expression of Gas7 restored mitochondrial morphology and distribution, as well as PINK1 expression in Gas7‐null cortical neurons. Collectively, our results introduce a novel role of mouse Gas7 in determining the dynamics, morphology, and intracellular distribution of neuronal mitochondria, which are expected to be required for normal neuronal function.
Keywords: Drp‐1, mitochondria, Mitofusin‐2, Parkin, PINK1
Abbreviations
- CDK5
cyclin‐dependent kinase 5
- CREB
cyclic AMP response element‐binding protein
- Drp‐1
dynamin‐related protein 1
- F‐BAR
Fes/CIP4 homology Bin‐Amphiphysin‐Rvs
- Gas7
growth arrest–specific gene 7
- Mfn‐1
Mitofusin‐1
- Mfn‐2
Mitofusin‐2
- Opa‐1
optic atrophy type 1
- Pdh
pyruvate dehydrogenase
- PINK1
PTEN‐induced putative kinase
- PKA
cyclic AMP‐dependent protein kinase A
1. INTRODUCTION
The gene for growth arrest‐specific 7 (Gas7) was discovered using a retrovirus‐based gene trapping strategy in growth‐arrested NIH3T3 fibroblasts.1, 2 Gas7 protein belongs to the F‐BAR (FCH‐Bin‐Amphiphysin‐Rvs) domain protein family,3 which comprises a variety of regulatory proteins that induce membrane deformation.4, 5 Mouse Gas7 has been shown to play a role in actin polymerization6 and functions in neurite outgrowth in various cultured cells, including embryonic primary cultured neurons.7 The Gas7 protein binds directly with F‐actin6 and its specific interaction with N‐WASP induces actin polymerization during neurite outgrowth of hippocampal neurons.8 Human Gas7 (hGAS7b) is 97% homologous to the murine protein9 and was identified as a regulator of tubulin polymerization.10 The binding between hGas7b and microtubule‐associated protein Tau stabilizes polymerized microtubules.10 Because Tau protein level is inversely correlated with hGAS7b level, it has been suggested that hGAS7b may play a role in the Tau‐associated pathology of Alzheimer's disease.10, 11 Notably, excess hGAS7b protein was found to directly bind to microtubules, where it interferes with kinesin movement.12 Thus, the importance of Gas7 in neuronal cytoskeletal structure has been firmly established.
A Gas7‐deficient/mutant mouse strain was previously generated by homozygous deletion of the chromosomal region encoding exon 6b,13 however, this genetic modification still allows for the production of an unstable Gas7 derivative that retains functions similar to the wild‐type protein. In aging Gas7‐mutant mice, neuromuscular junctions exhibit reduced terminal sprouting of neurons, muscle fiber composition abnormalities, and motor activity defects.13 When a multistep approach was used to dissect the genetics of complex traits for disease phenotypes, hGAS7b was identified as a candidate causal gene for abdominal obesity.14 Interestingly, when transgenic male mice that overexpress human GAS7 are placed on a high‐fat diet, the animals exhibit enhanced shared metabolic pathways and transcriptional networks in liver tissue with coincident reductions in fat mass and body weight compared with control mice.14, 15 Notably, native Gas7 is not expressed in mouse liver tissue,5 but expression of the hGAS7b transgene was detected in liver tissues in transgenic mice.14 Overall, these studies suggest that in addition to regulating actin and microtubule function, Gas7 may have other as‐yet unidentified functions.
Here, we generated a new line of mice lacking Gas7. These Gas7‐knockout mice are born and appear to develop normally, similar to the previous Gas7‐mutant mice.13 However, unlike the Gas7‐mutant mice, Gas7 knockouts exhibit altered mitochondrial dynamics and elongated mitochondria in neurons. Ectopic expression of Gas7 in primary cortical neurons rescued this mitochondrial phenotype. Further analysis of brain tissue revealed changes in the protein levels of key homeostatic regulators of mitochondrial dynamics, mitophagy, and mitochondrial physiology in Gas7‐knockout mice compared with wild‐type mice. Our data introduce a novel role for Gas7 in maintaining normal fission, fusion, and transport of healthy mitochondria.
2. MATERIALS AND METHODS
2.1. Ethics statement
Mice were handled and housed in accordance with the guidelines for animal care of the National Laboratory Animal Center (NLAC) of Taiwan. All procedures were authorized by the Academia Sinica Institutional Animal Care and Utilization Committee (IACUC), protocol #RMiIMBCS2009040.
2.2. Generation of gas7‐knockout mice and breeding
The gas7‐knockout mice were generated from embryonic stem (ES) cells of the 129 mouse strain by targeting exons 5 to 11 of Gas7 with pGK‐neo (neomycin gene)16 using two vectors with loxp sites by subcloning. Electroporation, selection, and screening of ES cells were conducted as reported previously.17, 18 Selected ES clones were expanded for blastocyst injection into C57BL/6 mice to produce chimeric mice. Male chimeras with a high proportion of agouti coat color were bred with C57BL/6 females for germline transmission of the targeted allele. The agouti heterozygous offspring were crossed to generate homozygous knockout mice that were then backcrossed for at least six generations with C57BL/6 mice to obtain a 95% C57BL/6 background in gas7‐knockout mice. Genotypes were confirmed by single nucleotide polymorphism (SNP) genotyping by the National Center for Genome Medicine (located at the Institute of Biomedical Sciences, Academia Sinica). Genotype analysis by PCR was performed on mouse tail genomic DNA using primers P1 5′‐GTT CAG CCT TCC TCC ACT TGC‐3′ and P2 5′‐AGT GAA TGG GAA ACT GAC AGA GG‐3′ to amplify ~492 base pairs in wild‐type, and P3 5′‐ATA GCG GCC GCA GCC ATC ATG ACA GAG AA‐3′ and P4 5′‐ATA GTC GAC GTT AAG GAC ACA CTG GTT CT‐3′ to amplify ~625 base pairs in heterozygote mice and in Gas7‐knockout mice.
2.3. Western blot analysis
After lysis of cerebrum tissue and centrifugation, the supernatant was transferred to a fresh tube and loaded onto an SDS‐polyacrylamide gel, and then transferred to a nitrocellulose membrane (Millipore, IPVH00010, and Billerica MA). The membrane was blocked in TBS buffer containing 20 mM Tris pH 7.6, 137 mM NaCl, and 5% nonfat dry milk or BSA for 1 hour and then incubated overnight at 4°C in TBS containing respective antibodies. The membrane was washed three times for 10 minutes each in TBST (TBS + 0.05% Tween 20) and then incubated with secondary antibody (IgG conjugated with horseradish peroxidase; GE Healthcare, Buckinghamshire, NA931V, NA934V, UK). After 60 minutes, blots were washed three times for 30 minutes each with TBST and visualized by ECL (GE Healthcare, RPN2106, and Buckinghamshire, UK).
2.4. Antibodies used in this study
The following antibodies were purchased from commercial sources: α‐Parkin polyclonal antibody (Cell Signaling, 2132S), α‐phospho‐Parkin (S65) (Abcam, ab154995), α‐ubiquitin monoclonal antibody (Santa Cruz Biotechnology, SC‐8017), α‐phospho‐ubiquitin (S65) (Boston Biochem, 13568315A), α‐actin (Santa Cruz Biotechnology, SC‐47778), α‐GAPDH antibody (Chemicon, AB2302), α‐SDHA antibody (Abcam, ab14715), and polyclonal antibodies for α‐GM‐130 (Abcam, ab40881‐100), α‐PINK1 (Novus Biologicals, BC 100‐494), α‐mitofusin‐2 (Sigma‐Aldrich, HPA030554), α‐phospho‐mitofusin‐2(S442) (Millipore, ABC963), α‐mitofusin‐1 (Abcam, ab57602), α‐FIS1 (Sigma‐Aldrich, HPA017430), α‐Drp‐1 (Abcam, ab56788), α‐phospho‐Drp‐1(S637) (Cell Signaling, 6319S), α‐phospho‐Drp‐1(S616) (Cell Signaling, 4494T), and α‐phospho‐CREB (Cell Signaling, 919L). α‐Pdh (Abcam, ab11034), α‐phospho‐Pdh (S293) (Sigma‐Aldrich, ABS204), α‐CDK‐5 (Abcam, ab151233), and α‐Gas7 antibody were prepared from rabbits immunized with His tag‐fused mouse full‐length Gas7, as described previously.7 The anti‐Gas7 antibody detects Gas7 and the hGAS7b form.10
2.5. Cortical neuron culture and preparation of cell lysates
For preparation of primary cortical neurons, we maintained isolated cortical tissue from C57BL/6 mice at embryonic day 16 in Hanks' balanced salt buffer with 1% glucose, 100 ng/ml streptomycin, and 100 U/ml penicillin. The tissues were digested with 0.05% trypsin plus 1 mM EDTA for 3 minutes and triturated through a flame‐polished Pasteur pipette to disrupt cell‐cell adhesions. Dispersed cells were centrifuged and cultured in Neurobasal Medium (Invitrogen) with B27 complex and 1 mM L‐glutamine. The primary neurons were seeded on 12‐well (1 × 10⁵ cells per well) plates or a 3.5 cm dish (3 × 10⁵ cells per dish) coated with poly‐L‐lysine. The cells were cultured in vitro for 7 days. Before tissue lysate preparation, the cerebrum tissue was rinsed twice with ice‐cold phosphate‐buffered saline and solubilized in RIPA buffer (150 mM NaCl, 50 mM Tris pH 7.9, and 0.5% DOC [sodium deoxycholate] containing 1.0% NP 40 and 0.1% SDS). Lysates from mouse cerebrums were prepared from 60‐day‐old wild‐type, heterozygous, and knockout genotypes of Gas7 mice after homogenization using a Tissue Lyser (Qiagen, 85210) with RIPA buffer. Supernatants were collected after centrifugation at 14 000 × g for 15 minutes at 4°C. Protein concentrations were determined using a detergent‐compatible protein assay kit (Bio‐Rad, 500‐0006).
2.6. Immunofluorescence staining of primary cortical neurons
Cortical neurons were isolated from embryonic day 16.5 C57BL/6 mice as previously described.13 Following isolation of neurons from mouse cortex, neurons were fixed with 4% PFA (Electron Microscopy Sciences, 15710), and then blocked in PBS containing 10% normal goat serum, 2% BSA, and 0.2% Triton X‐100 (PBST). Primary antibodies were prepared in 10% normal goat serum and 1% BSA in PBST. Samples were incubated with primary antibody at 4°C overnight, washed in PBS three times for 10 minutes each, and stained with secondary antibody conjugated to FITC and Cy3 (Invitrogen). Images of cross‐sections were captured with a confocal LSM 510 system (Carl Zeiss Microimage). Mitochondria and Gas7 colocalization was detected by using FITC conjugation for mitochondria and Cy3 conjugation for Gas7, respectively. Images of cortical neurons were captured with a confocal LSM780 system (Carl Zeiss Microimage).
2.7. Fractionation and mitochondrial and cytosolic isolations
After dissection of the cerebrum from wild‐type mice, cerebrums were washed with washing buffer, homogenized with a motorized Kontes Microtube Pellet Pestle Rod in isolation buffer, and centrifuged at 1000 × g for 10 minutes. Pellets containing the nuclear‐enriched fractions were saved and the supernatants were used for isolation of different organelles. The homogenized solution was subjected to 15%‐35% sucrose gradient ultracentrifugation. Centrifugation was performed at 4°C for 4 hours at 37 200 rpm using a SW40Ti (Beckman) rotor following gradient formation. After centrifugation, 17 fractions were collected and subjected to Western blot and probed with different antibodies for detection of specific proteins. We used antibodies against the subcellular marker proteins SDHA, GM130, and actin to tag mitochondria, Golgi complex, and cytosol, respectively, in the sucrose density gradient fractions. For isolation of mitochondria and cytosol from mouse cerebrum tissue, cerebrums were dissected from wild‐type mice. After dissection, mitochondrial and cytosolic fractions were isolated from cerebrums using a Mitochondria Isolation Kit for Tissue (Abcam, ab110168) according to the manufacturer's instructions. Briefly, cerebrums were washed with washing buffer, homogenized with a motorized Kontes Microtube Pellet Pestle Rod in isolation buffer, and centrifuged at 1000 × g for 10 minutes. Pellets containing the nuclear‐enriched fractions were saved, and supernatants were centrifuged again at 12 000 × g for 15 minutes. The supernatants containing the cytosolic fractions were saved and the pellets containing the mitochondrial fractions were washed twice with isolation buffer and resuspended in isolation buffer combined with complete protein inhibitor cocktail (Roche Applied Bioscience). Following centrifugation, the pellets were enriched with mitochondria, whereas the supernatant maintained the cytosolic fraction. Protein concentrations were determined using a detergent‐compatible protein assay kit (Bio‐Rad, 500‐0006). Equal protein was loaded from each fraction and Western blotting was performed with antibodies against SDHA for the mitochondrial fraction and GAPDH for the cytosolic fraction.
2.8. Electron microscopy analysis of mitochondria from mouse cortex
We performed ultrastructural examination of osmium tetroxide/uranyl acetate‐stained mouse cortex sections using a Tecnai G2 Spirit TWIN system (FEI Company). Mouse cortex was isolated from wild‐type and gas7‐knockout mice and, after isolation, cortical tissues were washed thoroughly with filtered phosphate buffered saline (PBS) pH 7.4, postfixed for 1 hour with 1% osmium tetroxide in PBS, rinsed with PBS, and dehydrated in 50% and 70% ethanol baths. A 2% uranyl acetate in 70% ethanol solution was applied for contrast (1 houe at 25°C in the dark), followed by two rinses in 70% ethanol (5 minutes each). Dehydration in ethanol was completed with two steps of 5 minutes in 95% and 100% ethanol baths. Then, 100% propylene oxide (Electron Microscope Sciences) was applied to the samples (two baths of 10 minutes each). Samples were then placed gradually in a 1:1 mixture of propylene oxide and Epon resin (25.9% Embed 812, 15.5% Araldite 502, 55.9% DDSA, and 2.7% BDMA; all resin components from Electron Microscopy Sciences) for 1 hour at 25°C, then in a 1:2 mixture of propylene oxide‐Epon resin (1 hour at 25°C), and finally transferred into pure Epon resin and kept overnight at 25°C. The following day, the samples were placed in freshly prepared resin for an additional hour at 25°C and finally allowed to polymerize in an oven at 70°C for a minimum of 4 days. Ultrathin sections were obtained using a Leica EM UC6 ultra microtome (Leica Microsystems) before being mounted on formvar‐coated copper grids and observed and photographed using an Hitachi transmission electron microscope, model H7650 (Hitachi, Japan), equipped with a Hamamatsu ORCA‐HR digital camera. Mitochondria were visually marked and analyzed. Mitochondria aspect ratio (the ratio of length/width) was measured and quantified using Metamorph software. Elongated mitochondria were quantified from a mitochondrial population of N = 823 wild‐type and N = 1235 gas7‐knockout mouse cortical sections. Statistical significance was assessed by Student's t test; *P < .001.
2.9. Metabolic phenotyping
Metabolic rates (food and water intake, locomotor activity, VO2 consumption, and VCO2 production)19 were measured using a four‐cage Promethion‐C continuous, parallel metabolic phenotyping system (Sable Systems International [SSI]) for six wild‐type and six gas7‐knockout male mice (36 weeks old). This system imposes minimal stress due to handling or other disruptive influences because it uses live‐in cages of ~4L STP internal volume that are transferred from the housing colony to the testing room for studies. Air was pulled from the cages at a controlled mass flow rate of 2L/min STP. This yielded a time constant of ~4 minutes. The flow from each cage was sampled by a gas analysis chain consisting of a water vapor analyzer, a CO2 analyzer, an O2 analyzer, a barometric pressure sensor, and a subsampling flow control system, all integrated into one gas analysis system (GA3m4: SSI) per bank of four cages. Gas flow for each bank was generated by a FR‐4b mass flow‐controlled pull flow generator (SSI). The calorimetric room had a fluorescent light source controlled by a timer set to a 12:12 hours light:dark cycle. Monitoring was performed for 5 days after mice had acclimatized to cages for 2 days. The respiration quotient (RQ) was calculated as the ratio of VCO2/VO2.20 The system acquired data on fractional O2 and CO2 concentrations, running wheel speed, water vapor pressure (WVP), barometric pressure (BP), ambient temperature and light levels, flow rates, food and water dispenser masses (to 1 mg), body masses (to 1 mg via a weighed enrichment habitat), running wheel revolutions, and X, Y and Z locations together with beam breaks. Measurements were acquired at a sample rate of 1 sample/sec for all sensors and cages simultaneously via an error‐correcting control area network (CAN). The provision for exercise increased variability in Energy Expenditure (EE)21 and RQ for a total of N = 108 measurements of six wild‐type and six gas7‐knockout male mice for all parameters measured in this study.
2.10. Analysis of mitochondrial morphology in cortical neurons (Micro‐P)
Neuronal cells were isolated from wild‐type and gas7‐knockout mice cortex of embryonic day 16.5 embryos and cultured for 7 days as described above. The neuronal cells were then stained with anti‐SDHA as a mitochondrial marker and cell images were taken by confocal LSM780 system (Carl Zeiss Microimage). Wild‐type, gas7 KO, and GFP‐Gas7 cortical neurons (N = 5) were then analyzed using the Micro‐P software.22 That software measures individual mitochondria (by detecting SDHA antibody signal) according to morphological, skeletal, and textural features, and sorts them into six types.22 Small fragmented mitochondria with a pixel area <20 were categorized as type 1. Large fragmented mitochondria with a length/width ratio <3 were type 2. Of the remaining mitochondria, curved, branched, or circular tubular mitochondria with a length/width ratio 2 were grouped as type 3, curved tubular mitochondria with a length/width ratio >2 were designated as type 4, horseshoe/donut/network tubular mitochondria with a length/width ratio <3 were type 5, and network tubular mitochondria with a length/width ratio >3 were designated as type 6. We employed the Micro‐P software for mitochondrial distribution and heterogeneity analysis of wild‐type, gas7‐knockout, and GFP‐Gas7 cortical neurons (N = 5).
3. RESULTS
3.1. Generation and validation of Gas7‐knockout mice
Gas7‐knockout mice were generated from embryonic stem cells of 129 mice by targeting exons 5 to 11 of Gas7 with pGK‐neo.16 As shown in Figure 1A, upon deletion of exon 5 to 11, a frameshift and premature stop codon were generated in exon 12. Genotyping was performed using genomic DNA from wild‐type and Gas7‐knockout mouse tails. The wild‐type allele was PCR amplified using primers P1 and P2, producing a 492 bp product; meanwhile, the mutant allele was amplified by P3 and P4, producing a 625 bp product (Figure 1A). As shown in Figure 1B, wild‐type mice were identified by a single band at 492 bp, heterozygous mice had bands at 492 and 625 bp, and the homozygous Gas7‐knockout mice were identified by only a 625 bp band (Figure 1B; lane 1/WT, lane 2/HT, and lane 3/KO). Western blot analysis was then performed using an antibody against Gas7 protein and brain lysates from WT, HT, and KO mice (Figure 1C). We detected about twice as much Gas7 protein in the wild type as the heterozygous mice (Figure 1C, comparing lane 1 with lane 2). As expected, Gas7 protein was not detected in the Gas7‐knockout brain lysate (Figure 1C, lane 3). No obvious differences were observed in the expression of antitubulin from the same brain lysates (Figure 1C lower panel). Thus, deletion of exons 4 to 11 of the Gas7 gene resulted in a complete lack of detectable Gas7 protein in the homozygous knockout, suggesting that we successfully produced true Gas7‐knockout mice.
Figure 1.
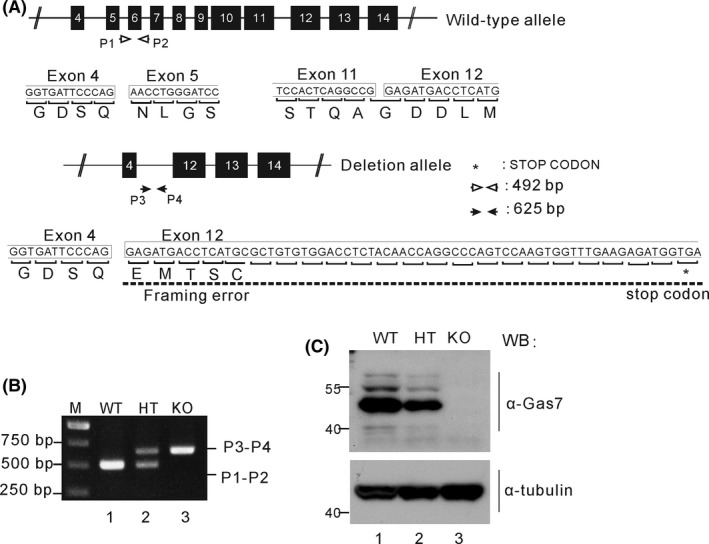
Generation, genotyping, and characterization of gas7‐knockout mice. A, The structure of the Gas7 wild‐type and deletion (knockout) allele. For Gas7 gene targeting, we excised the region from exons 5 to 11 of Gas7 genomic DNA and generated a framework error and stop codon in exon 12 that prevented the alternative splicing responsible for forming truncated Gas7. The Gas7 wild‐type and deletion allele were verified by two primer pairs, P1‐P2 and P3‐P4. The predicted PCR product length of the P1‐P2 primers is 492 base pairs (bp) and for the P3‐P4 pair it is 625 bp. White arrows indicate the P1 and P2 primers; black arrowheads indicate the P3 and P4 primers. B, Genotype analysis by PCR was performed on mouse tail genomic DNA. PCR products amplified a ~492 bp fragment in wild‐type and a ~625 bp fragment in knockout mice, and both fragments were found in the heterozygotes. M indicates a 1 kb DNA ladder (Fermentas). C, Western blot analysis. Total brain lysates from wild‐type (WT), gas7 heterozygous (HT), and gas7‐knockout (KO) mice were electrophoresed by 10% SDS‐PAGE. After blotting, the membranes were probed with Gas7 antibody to show that Gas7 protein exists in WT and gas7 HT but not in gas7 KO mice
3.2. Gas7 associates with mitochondria in mouse cortical neurons
To determine the subcellular distribution of Gas7, we performed ultracentrifugation of mouse brain lysate on a sucrose density gradient, followed by Western blotting with anti‐Gas7, anti‐SDHA (mitochondria marker), anti‐GM130 (Golgi marker), and anti‐Actin or anti‐GAPDH (cytoplasmic markers) antibodies. As shown in Figure 2A, Gas7 was predominantly detected in fractions 2, 3, and 4, with fractions 3 and 4 being highly enriched in mitochondrial marker and fractions 2 and 3 enriched in Golgi marker. Fractions 13 to 17 contained a cytosol and a mitochondrial mixed fraction, with Gas7 and SDHA both detected. For all samples, the SDHA‐specific mitochondrial marker and cytoplasmic GAPDH marker were used both as loading controls and also to monitor the quality of the fraction preparation. The quantitative data normalized to the total brain lysate protein (Figure 2B,C) show a similar distribution of Gas7 in the cytosol and mitochondrial fractions. As shown in Figure 2D, we also validated the association of Gas7 with mitochondria in primary cortical neurons by immunostaining. The bottom panel of Figure 2D shows the colocalized signal (yellow) of mitochondria (SDHA, green, top panel) and the Gas7 (Gas7, red, bottom panel). Together, the immunoblotting and immunostaining results suggest that Gas7 associates with mitochondria in mouse cortical neurons.
Figure 2.
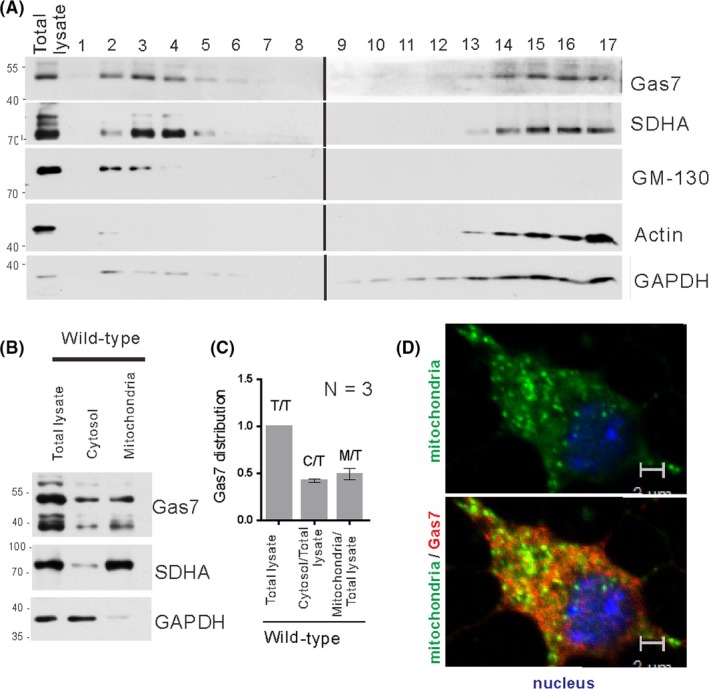
Gas7 detection and localization with mitochondria. A, Sucrose gradient fractionation of mouse cerebrum homogenate. Homogenized solutions were subjected to ultracentrifugation in 15%‐35% sucrose gradients. Fractions were then resolved by SDS‐PAGE and immunoblotted with an antibody against Gas7. Gas7 was detected in fractions 2‐4 and 14‐17, SDHA in fractions 3 and 4 and 14‐17, GM‐130 in fractions 2 and 3, and actin and Gapdh in fractions 14‐17. B, Immunoblots of Gas7, SDHA, and GAPDH of isolated mitochondrial, cytosolic, and total lysate fractions from WT cerebrum showing that Gas7 is distributed in cytosol and mitochondrial fractions of WT mice. SDHA and GAPDH were used as markers for mitochondrial and cytosolic fractions, respectively. C, Quantification analysis of Gas7 showing that Gas7 is detected in both cytosol and mitochondria fractions. Gas7 detected in the abovementioned fractions was normalized with markers for mitochondrial (SDHA) and cytosolic (GAPDH) fractions, respectively. D, Immunofluorescence analysis of Gas7 and mitochondria colocalization in primary cortical neurons. Top panel shows Gas7 (red) labeled with Gas7 polyclonal antibodies and mitochondria (green) are labeled with SDHA antibody. Bottom panel shows the colocalization (yellow) of Gas7 and mitochondria in a merged image
3.3. Brain tissue mitochondria are elongated in Gas7‐knockout mice
Based on the colocalization of mitochondria and Gas7 in mouse cortical neurons, we examined the possible function of the protein by comparing the mitochondrial morphology in brain tissue from wild‐type and Gas7‐knockout mice. In sections of cortical brain tissue, more elongated mitochondria were observed in Gas7‐knockout samples than wild type (Figure 3A). We quantified the mitochondrial aspect ratio (length/width) of wild‐type (N = 827) and Gas7‐knockout (N = 1235) mitochondria in cortical sections (Figure 3B). The average aspect ratio of Gas7‐knockout mitochondria was 1.75 compared with the aspect ratio in wild types of 1.59. This difference also supported the notion that mitochondria in Gas7‐knockout cortex are longer than those in wild‐type tissue. Gas7‐knockout tissue also exhibited a wider range of aspect ratios and more outliers. These results suggest that the absence of Gas7 may somehow lead to mitochondrial elongation in mouse cortical neurons.
Figure 3.
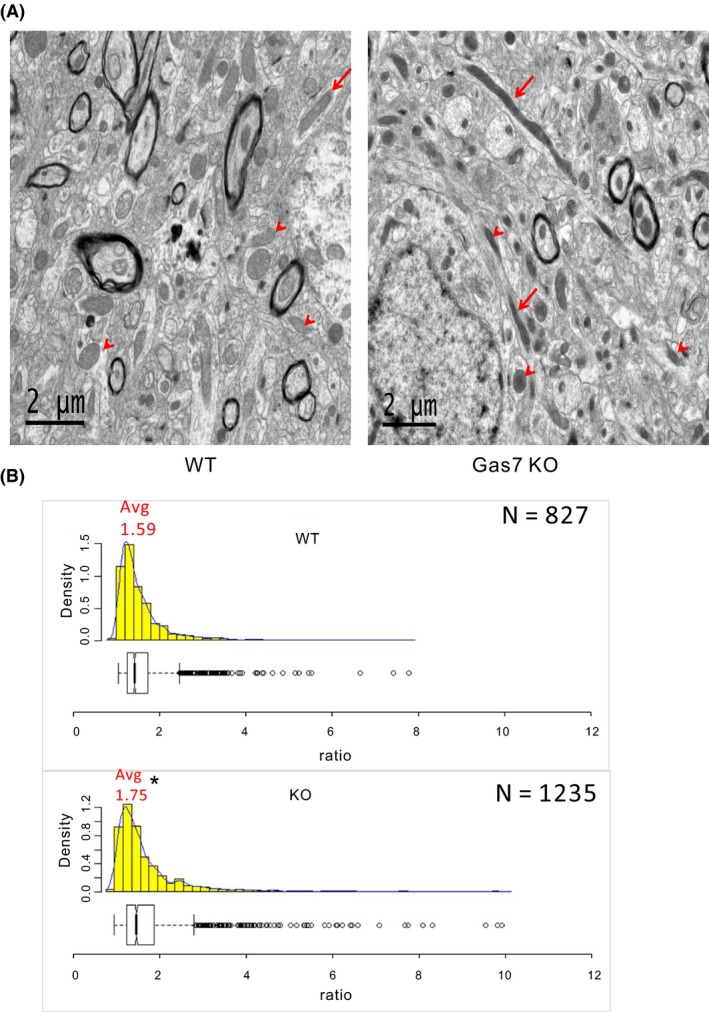
Mitochondrial length increases in gas7‐knockout mouse brain cortex compared with wild‐type mice. A, Wild‐type (left panel) and gas7‐knockout (right panel) mouse cortex showing mitochondria with different aspect ratios (length‐to‐width ratio). As defined by the box plot in B, outliers are marked with red arrows and nonoutliers are marked with red arrowheads. B, Histogram and box plot of mitochondria aspect ratios from wild‐type (left) (N = 823) and gas7‐knockout (right) cortical sections (N = 1235). *P < .001. Avg, average. The minimum value of the aspect ratio (length‐to‐width ratio) of a mitochondrion is 1 when its length equals its width. Bin widths of histograms are equivalent to aspect ratio increments of 0.2. Count represents the number of mitochondria per bin width
3.4. Mitochondrial morphology is altered in Gas7‐knockout cortical primary neurons and rescued by ectopic Gas7 expression
Mitochondria undergo dynamic fission and fusion to regulate mitochondrial shape, distribution, quality, and function.23, 24 Based on our observation of elongated mitochondria in the cortex of Gas7‐knockout mice, we further analyzed mitochondrial morphology in primary cortical neurons of wild‐type and Gas7‐knockout mice by well‐established methods for cell imaging and a Matlab‐based automatic classification (Micro‐P).22 As shown in Figure 4A, the mitochondrial distribution in primary neurons differed between wild‐type and Gas7‐knockout cultures. Mitochondria were heavily concentrated in the cell bodies of Gas7‐knockout neurons, but were more evenly distributed in wild‐type neurons, including substantial distribution into neurites. The Micro‐P analysis also showed that the mitochondrial subtypes of the primary cultured neurons of the Gas7 knockouts differed from wild types (Figure 4Ba). Using 3D Micro‐P software to quantify the average distance between all mitochondria and nuclear boundaries in neurons, the results show that the average distance between wild‐type mitochondria and nuclear boundaries is more than twice that of Gas7 knockouts (Figure 4Bb, comparing WT with Gas7‐KO). By overexpressing a Gas7‐GFP fusion in the knockout primary neurons, the mitochondrial distribution phenotype was largely rescued (Figure 4A,B, comparing Gas7‐KO vs Gas7‐KO + Gas7‐GFP fusion). In addition, Micro‐P analysis showed that the mitochondrial subtype populations also changed in Gas7‐null neurons. As shown in Figure 4C, mitochondrial subtype 1 (small fragmented mitochondria) was predominant in wild‐type cultures, followed by subtypes 3 (curved, branched, or circular tubular mitochondria) and 6 (branched mitochondria). In contrast, there was no significant difference in the population distribution of these three subtypes in Gas7‐knockout neurons. However, in the Gas7‐knockout neurons, subtype 1 was decreased and subtype 6 was increased significantly compared with wild‐type neurons (Figure 4C). Similar to the mitochondrial–nuclear boundary mean distance, overexpression of the Gas7‐GFP fusion in Gas7‐knockout neurons also rescued the distributions of the two mutant subtypes, producing ratios that are similar to the corresponding subtype in wild‐type cultures (Figure 4C). Our results indicate that Gas7‐knockout neurons have differences from wild‐type neurons in proportion of mitochondrial subtypes and mitochondrial distribution that can be rescued by ectopic expression of Gas7. Therefore, our data suggest that Gas7 is required for proper mitochondrial morphology and distribution in neurons.
Figure 4.
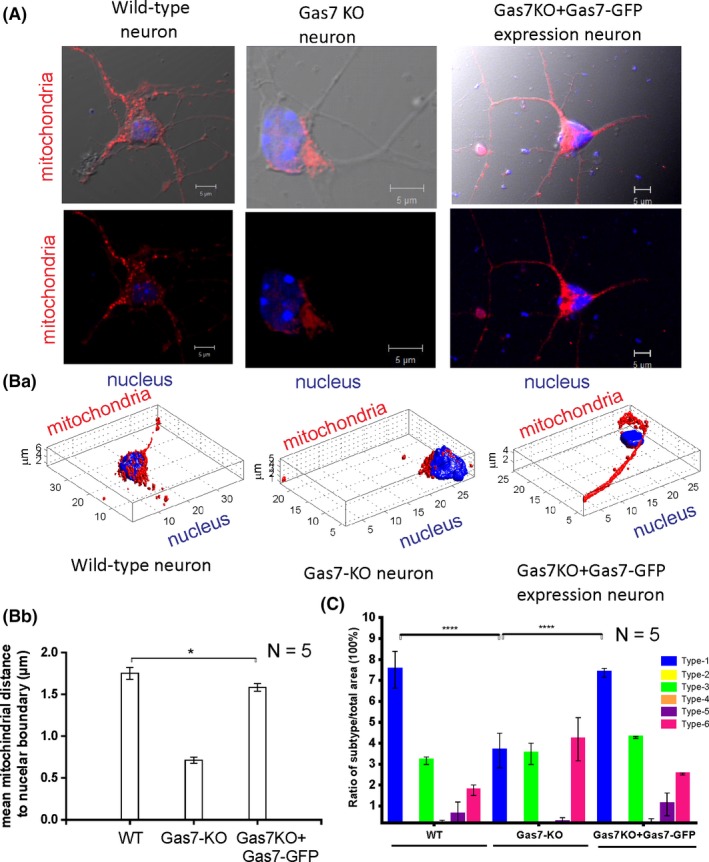
Mitochondrial morphology and heterogeneity is affected in gas7‐knockout neurons compared with wild‐type neurons and can be rescued by ectopic expression of Gas7. A, Immunofluorescence analysis of nuclei and mitochondrial staining (labeled red using SDHA antibodies) in wild‐type neurons, gas7‐knockout neurons, and gas7 KO + Gas7‐GFP neurons. Top panel shows wild‐type neurons, gas7‐knockout neurons, or gas7‐knockout neurons rescued with Gas7 ectopic expression, with mitochondria in red and nucleus in blue shows with merged images of these neurons with DIC images of the respective neurons to show neuronal morphology. Bottom panel shows merged images mitochondria and nucleus of these neurons without DIC images of the respective neurons. Ba, Changes in mitochondrial distribution in wild‐type neurons, gas7‐knockout neurons, or gas7 KO + Gas7‐GFP neurons (ie, rescued by Gas7 ectopic expression) using Micro‐P 3D analysis. Immunofluorescence staining of nuclei (blue) and mitochondria (red) indicates the dispersed distribution of mitochondria in wild‐type or the perinuclear clustering of mitochondria in gas7‐knockout neurons. Ectopic expression of Gas7 can restore the dispersed distribution of mitochondria in gas7‐knockout neurons. Bb, A presentation of mean distance from mitochondria to the nuclear boundary (µm) calculated using Micro‐P 3D software. Bar graphs for wild‐type, gas7‐knockout, and gas7 KO + Gas7‐GFP neurons are expressed as means ± SD n = 5, columns = means; error bars = SEs. C, Micro‐P classified mitochondria into six types: small fragmented (type 1, blue), large fragmented (type 2, yellow), straight tubular (type 3, green), curved tubular (type 4, orange), horseshoe/donut/network tubular (type 5, purple), or branching tubular (type 6, pink). Bar graph showing the percentages of each type of mitochondria, expressed as means ± SD. n = 5, *P < .001
3.5. Gas7‐knockout mice exhibit imbalanced mitochondrial fusion and fission
Mitochondrial dynamics (fission and fusion) control the shape and distribution of mitochondria in neurons.25 When fusion predominates, the mitochondria appear as branched filaments, and the organelles become separated particles when fission occurs preferentially.26 In neurons, filamentous mitochondria are often found in the soma, whereas mitochondria in neurites usually appear as short filaments or spots.24 Abnormalities in intracellular mitochondrial distribution and morphology in Gas7‐knockout cortical primary neurons were rescued by the ectopic expression of Gas7. Therefore, we hypothesized that mitochondrial fusion and fission might be out of balance in the absence of Gas7.
Several widely known ubiquitously expressed proteins are required for mitochondrial fusion and fission. We first determined the expression levels of outer and inner mitochondrial membrane fusion proteins, Mfn‐1, Mfn‐2, and Opa‐1 in the brain lysate of wild‐type, heterozygous, and Gas7‐knockout mice at 60 days of age. In all experiments, GAPDH was used as a protein loading control. Our results show that levels of the outer membrane fusion proteins Mfn‐2 and Mfn‐1 are increased in heterozygous and KO mice and the increase is significant in Gas7‐knockout mice (Figure 5A; three samples for each genotype; Mfn‐2 and Mfn‐1 are, respectively, labeled as Mitofusin‐2 and Mitofusin‐1). For Mfn‐2 and Mfn‐1, quantitative data are shown in Figure 5A1,A2, respectively. No significant difference in the protein level of the inner membrane fusion protein Opa‐1 was observed (Figure 5A). The increased level of mitochondrial fusion proteins in Gas7‐knockout brain lysates suggests that mitochondrial fusion may be upregulated in Gas7‐knockout mice.
Figure 5.
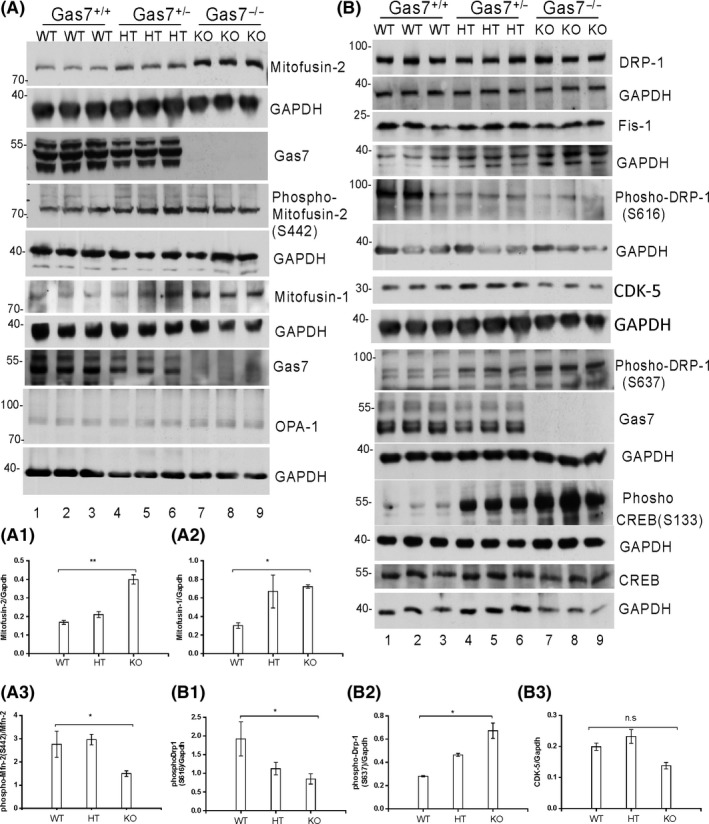
Profusion and profission inhibitor protein levels are increased in gas7‐knockout mouse cerebrum. A, Western blot analysis. Total brain lysates from wild‐type (WT), gas7 heterozygous (HT), and gas7‐knockout (KO) mice were electrophoresed by 10% SDS‐PAGE. After blotting, the membranes were probed with Gas7 antibody and show that Gas7 protein exists in wild‐type and gas7 heterozygotes but not in gas7‐knockout mice. Blots detecting Mitofusin‐2, phospho‐mitofusin‐2 (S442), Mitofusin‐1, and Opa‐1 from cerebrum lysates of Gas7 WT, HT, and KO mice show increased mitofusin proteins in HT and KO mice compared with WT mice. GAPDH was used as a loading control. A1, Quantification analysis of expression of Mfn‐2 protein levels when normalized with GAPDH, showing that Mfn‐2 levels increased significantly among WT, gas7 HT, and gas7 KO mice. A2, Quantification analysis of expression of Mfn‐1 protein levels when normalized with GAPDH showing Mfn‐1 levels increased significantly among WT, gas7 HT, and gas7 KO mice. A3, Quantification analysis of the phosphorylation status of Mfn‐2 protein levels (S442) when normalized with nonphosphorylated Mfn‐2 showing that Mfn‐2 phosphorylation decreased significantly among WT, gas7 HT, and gas7 KO mice. B, Western blot analysis. Total brain lysates from WT, gas7 HT, and gas7 KO mice were electrophoresed by 10% SDS‐PAGE. After blotting, the membranes were probed with Gas7 antibody to show that Gas7 protein exists in wild‐type and gas7 heterozygotes, but not in gas7‐knockout mice. Blots to detect expression of Drp‐1, GAPDH, Gas7, Fis‐1, phosho‐Drp‐1(S616), phosho‐Drp‐1(S637), phospho‐CREB(S133), CREB, CDK‐5, and GAPDH from cerebrum lysates of Gas7 WT, HT, and KO mice show decreased phospho‐Drp‐1(S616) (quantified in B2) and increases in both phospho‐Drp‐1 (S637) (quantified in B1) and phospho‐CREB in HT and KO mice compared with WT mice. There were no significant changes in Drp‐1, Fis‐1, CDK‐5 (quantified in B3), or CREB protein levels. GAPDH was used as a loading control
The division of mitochondria is controlled in part by the phosphorylation status of Drp‐1 at Serine 616 (targeted by CDK1/cyclin B or CDK5),27 and at Serine 637 (targeted by protein kinase A, PKA).28 Mitochondrial fission is inhibited when Drp‐1 is phosphorylated at Serine 637, with inactivated Drp‐1 distributed to the cytoplasm.29 Once activated by dephosphorylation at Serine 637, phosphorylation at serine 616 or both, cytosolic Drp‐1 translocates to the mitochondrial outer membrane, where it interacts with one or more of its binding partners, such as fission protein 1 (Fis‐1), to initiate mitochondrial fission.30
We determined the expression and phosphorylation status of mitochondrial fission protein Drp‐1 in mouse brain lysate. As shown in Figure 5B, wild‐type, heterozygous and Gas7‐knockout mice had similar Drp‐1 protein levels and Fis‐1. However, Drp‐1 phosphorylation at Serine 637 was increased and at Serine 616 decreased in both heterozygous and Gas7‐knockout mice compared with wild types (Figure 5B1,B2). Based on the increase in Drp‐1 phosphorylation at Serine 637 in Gas7‐knockout mice, we anticipated that the activity of the putatively responsible kinase, PKA, is also higher in Gas7‐knockout mice. Therefore, we investigated PKA activity by determining the status of PKA‐dependent phosphorylation of CREB Serine 133 31 in these mice. Our data show that although total CREB protein levels remain similar in these mice (Figure 5B, 14Th panel), phosphorylation of CREB at serine 133 is significantly increased in the heterozygous and Gas7‐knockout mice (Figure 5B, 12Th panel). Therefore, the data agree with the observed increase in Drp‐1 Serine 637 phosphorylation. However, the Drp‐1 Serine 166 kinase, CDK5, was not significantly different between these mouse strains (Figure 5B, quantitative data Figure 5B3). As phosphorylation of Serine 166 was decreased, the CDK5 activators, P35 and P25, may have been affected by the absence of Gas7.
In summary, our results show that Gas7‐deficient (heterozygous or knockout) mice had higher levels of mitochondrial fusion proteins Mfn‐1 and Mfn‐2, decreased phosphorylation of Drp‐1 at Serine 616, and increased phosphorylation of Drp‐1 at Serine 637. Together the changes in these protein levels would be expected to result in an imbalance in mitochondrial dynamics that would produce an ‘over‐fused’ mitochondrial phenotype in Gas7‐knockout mice.
3.6. Gas7‐KO mice have decreased levels of PINK1 and decreased phosphorylation of Parkin (S65), Ubiquitin (S65), and Mitofusion‐2 (S442)
Recent studies have suggested that the combination of mitochondrial network dynamics and mitochondrial autophagy (mitophagy) comprise a system of mitochondrial quality control.32 Mitophagy removes dysfunctional mitochondria, predominantly via a PINK1‐Parkin–mediated pathway.33 Based on our observation of elongated mitochondria and imbalanced mitochondrial dynamics in the absence of Gas7, we further measured the levels of key players in mitophagy, such as PINK1, Parkin, phosphorylated Parkin, and ubiquitin,34, 35 in Gas7‐deficient brain tissue. We found that a significant decrease in protein levels for PINK1 in Gas7‐deficient brain tissues (Figure 6A, quantitative data Figure 6A1), with corresponding decreases in PINK1‐phosphorylated Parkin (serine 65) and Ubiquitin at serine 65 in Gas7‐knockout brain tissues (Figure 6A, quantitative data Figure 6A1‐6). After ectopic expression of Gas7, mitochondrial fission was increased, with a coincident increase in neurite length and rescue of mitochondrial distribution along the neurite. Thus, Gas7 expression alleviated the perinuclear distribution of elongated mitochondria and promoted the proper distribution of smaller mitochondria (Figure 4). Ectopic expression of Gas7 also increased PINK1 expression and activation, which likely was responsible for increasing the levels of phosphorylated Parkin protein (Figure S1). This activation of Parkin is expected to facilitate the removal of damaged mitochondria by mitophagy, increasing the proportion of healthy mitochondria to promote neurite outgrowth. Overexpression of wild‐type PINK1 is known to promote neurite outgrowth in SH‐SY5Y cells and increase dendritic lengths in primary cortical and midbrain dopaminergic neurons.36 Gas7 ectopic expression also upregulated miro‐1 protein (Figure S1), which is involved in the transport of mitochondria along neurites. Mitochondrial transport is expected to further aid in neurite elongation. Notably, the activity of the Miro proteins is regulated by PINK1 via PKA.37 Overall, the abnormalities rescued by ectopic expression of Gas7 should help to increase mitochondrial fission and mitochondrial distribution by promoting mitophagy via PINK1‐Parkin, which will subsequently promote neurite outgrowth and influences neuronal function. This finding supports our previous known role of Gas7 in regulating neurite outgrowth in Purkinje neurons7 and hippocampal neurons.8 We also showed that the absence of Gas7 leads to a decrease in cortical neurite length in Gas7‐mutant mice.13
Figure 6.
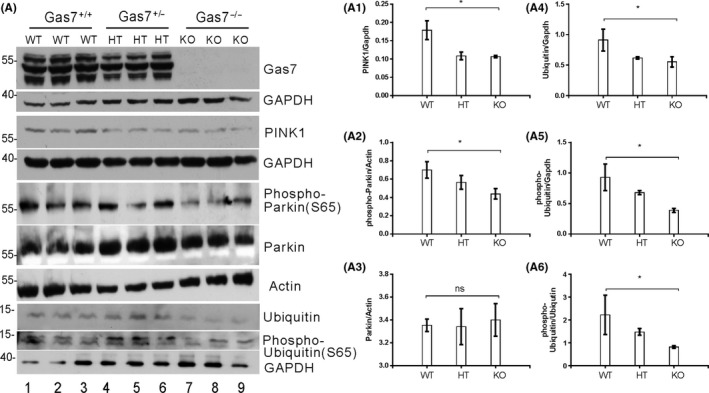
Activation of mitophagy‐upstream kinase PINK1, mitophagy proteins, and Parkin is decreased in gas7‐knockout mouse cerebrum. A, Western blot analysis. Total brain lysates from wild‐type (WT), gas7 heterozygous (HT), and gas7‐knockout (KO) mice were electrophoresed by 10% SDS‐PAGE. After blotting, the membranes were probed with Gas7 antibody to show that Gas7 protein exists in wild‐type and gas7 heterozygotes, but not in gas7‐knockout mice. Blots show decreased PINK1, phospho‐Parkin (S65), Ubiquitin, and phospho‐Ubiquitin (S65) proteins in HT/KO mice. There were no significant differences for Parkin protein levels among WT, HT, or KO mice. GAPDH was used as a loading control. Quantification analysis of PINK1 (A1), phospho‐Parkin (A2), Ubiquitin (A4), phospho‐Ubiquitin (A5), and normalized phospho‐Ubiquitin (S65) over normalized Ubiquitin (A6) shows decreases in PINK1, phospho‐Parkin, Ubiquitin, and phospho‐Ubiquitin in KO mice. Actin and GAPDH were used as loading controls, for which there were no significant differences among WT, HT, or KO mice
PINK1 phosphorylation of Mfn‐2 at serine 442 mediates Parkin recruitment to damaged mitochondria and serves as a Parkin receptor to stimulate the elimination of damaged mitochondria.38 Based on the decreased levels of PINK1 and PINK1‐phosphorylated Parkin (serine 65), we next measured phosphorylation of Mfn‐2 at serine 442. As shown in Figure 5A, the absence of Gas7 increased Mfn‐2 protein levels, but PINK1‐phosphorylated Mfn‐2 (serine 442) was not drastically increased. Quantitative analysis showed that the relative level of PINK1 phosphorylation of mitofusin‐2 (serine 442) was decreased (Figure 5A3). Our results show that a decrease in PINK1 in Gas7‐knockout mice corresponds to decreases in putative PINK1 phosphorylation of Parkin and Mfn‐2.
3.7. Gas7‐null mice exhibit lower mitochondrial respiration and energy expenditure as well as mitochondrial physiology abnormalities
As we observed an imbalance in mitochondrial dynamics and reduced mitochondrial quality control in cortical tissue of animals without Gas7, we next sought to evaluate whether mitochondrial physiology or function might be affected in Gas7‐knockout mice. We compared wild types and Gas7 knockouts at 36 weeks of age, using metabolic chambers to analyze respiration, energy consumption, body mass, and muscle strength during light and dark cycles. Gas7‐knockout animals (blue) exhibited lower average and reduced maximum energy expenditure levels irrespective of dark and light when compared with wild‐type mice (Figure 7A,B). The average O2 inhalation and CO2 exhalation of Gas7‐knockout mice was also lower in both light and dark periods (Figure 7C,D). The lower respiration rates in Gas7 knockouts suggest that mitochondrial respiration and oxidative phosphorylation might be decreased. We also compared the fitness of mice with the light‐dark cycle periods, Gas7 knockouts had increased body mass compared with wild‐type mice (Figure 7E) and decreased running‐wheel rotation speed (Figure 7F). These quantitative data are consistent with the idea that mitochondrial function and physiology might be disrupted in Gas7‐knockout mice compared with wild type. The irreversible decarboxylation of pyruvate occurs via pyruvate dehydrogenase (PDH) and comprises the entry step into the TCA cycle. Thus, PDH is one of the most important enzymes in the regulation of mitochondrial metabolism. We found that PDH levels were significantly reduced in Gas7‐knockout brain tissue (Figure 7G,I). Site‐specific phosphorylation of serine residues in PDH by different kinases (especially at Serine 293) inhibits protein catalytic activity.39 We found an increase in this phosphorylation of PDH in both heterozygous and homozygous Gas7‐knockout mice compared with wild types (Figure 7J). Based on these findings, we conclude that mitochondrial metabolism in the brain is likely to be underutilized in the absence of Gas7.
Figure 7.
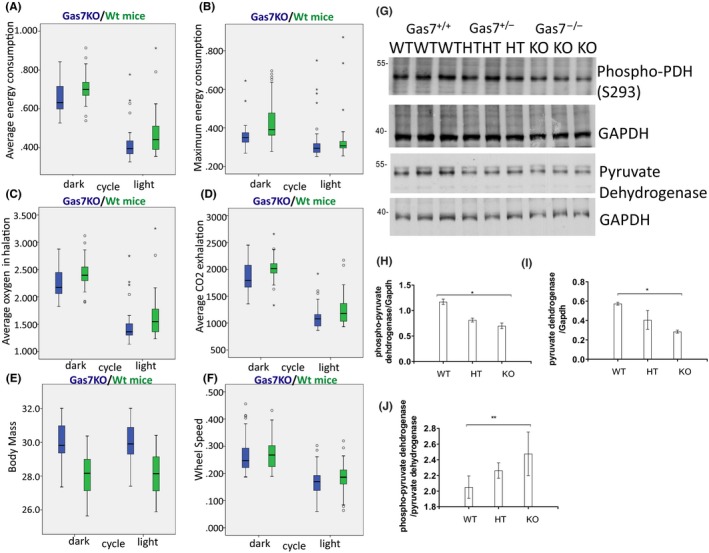
gas7‐knockout mice exhibit decreased energy consumption, respiration, and wheel speed, as well as increased body mass. A, Box plot analysis of average energy consumption by Gas7 wild‐type (WT, green) and ‐knockout (KO, blue) male mice, showing decreased average energy consumption of gas7 KO mice during both the dark (left side) and light (right side) cycles. B, Box plot analysis of maximum energy consumption for Gas7 WT (green) and KO (blue) male mice, revealing decreased maximum energy consumption of gas7 KO mice during both dark (left side) and light (right side) cycles. C, Box plot analysis of average oxygen inhalation by Gas7 WT (green) and KO (blue) male mice, showing decreased average oxygen inhalation of gas7 KO mice during both the dark (left side) and light (right side) cycles. D, Box plot analysis of differences in average CO2 exhalation for Gas7 WT (green) and KO (blue) male mice, demonstrating a decrease in average CO2 exhalation of gas7 KO mice during both the dark (left side) and light (right side) cycles. E, Box plot analysis of body mass differences for Gas7 WT (green) and KO (blue) male mice, showing increased body mass of gas7 KO mice during both the dark (left side) and light (right side) cycles. F, Box plot analysis of differences in wheel speed for Gas7 WT (green) and KO (blue) male mice, revealing a decrease in wheel speed of gas7 KO mice during both the dark (left side) and light (right side) cycles. G, Western blot analysis. Total brain lysates from wild‐type (WT), gas7 heterozygous (HT), and gas7‐knockout (KO) mice were electrophoresed by 10% SDS‐PAGE. After blotting, membranes were probed with phospho‐PDH (S293) and pyruvate dehydrogenase (PDH) antibodies. Blots show decreased levels of phospho‐PDH and PDH in HT and KO mice. GAPDH was used as a loading control. H, Quantification analysis of phospho‐PDH normalized to GAPDH levels, showing the decrease in PDH phosphorylation. I, Quantification analysis of PDH normalized to GAPDH levels, showing the decrease in levels of PDH. J, Quantification analysis of normalized phospho‐PDH over normalized PDH levels, showing phosphorylation levels of PDH increase significantly among WT, gas7 HT, and gas7 KO mice
4. DISCUSSION
Mitochondrial function is highly dependent on the morphology and localization of the organelle.40 Improper organelle size, distribution, and degradation may lead to major deficiencies in mitochondrial functions, such as calcium buffering and energy production.41 Therefore, mitochondrial morphology and mitophagy are tightly regulated throughout the lifespan of a cell according to its physiological state.42 Mitochondrial morphology is regulated by mitochondrial fission and fusion dynamics, which are generally mediated by large GTPases, such as Mfn‐1, Mfn‐2, Opa‐1, and Drp‐1.43 Meanwhile, mitophagy is regulated by PINK1 and Parkin signaling.44 These processes are then coordinated via cell signaling events, such as those mediated by PKA, and crosstalk between signaling pathways.45 By generating an improved Gas7‐knockout mouse line, we found that Gas7 deficiency perturbs these homeostatic processes in neurons at multiple levels, resulting in the accumulation of elongated mitochondria within perinuclear clusters (Figure 8A). This new knockout mouse line is better than previous models in terms of Gas7 deletion in that it precludes the expression of alternative splicing forms (Figure 1). We inserted a framing error in the Gas7 gene to create a stop codon in exon 12 to prevent alternative splicing. Thus, these knockout mice are an ideal model system for investigating the in vivo functions of Gas7.
Figure 8.
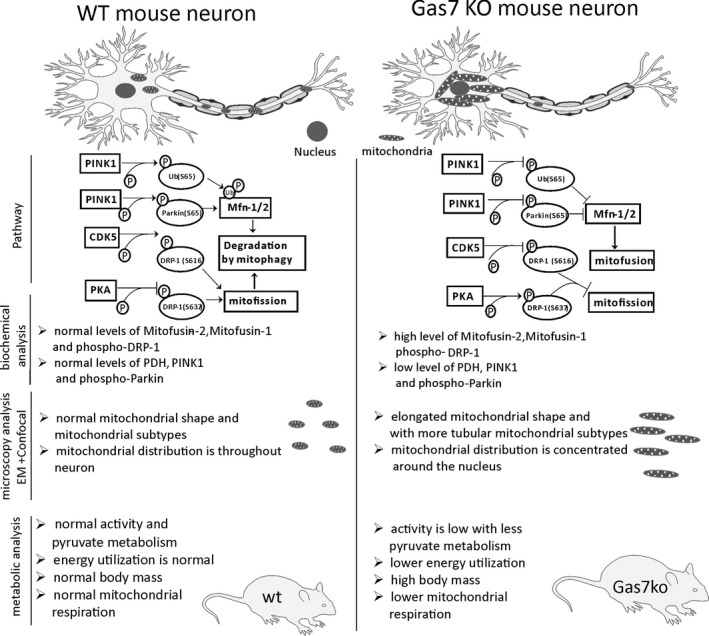
Comparison between wild‐type and gas7‐knockout neurons of mitofusin regulation by the PINK1 and parkin‐mediated mitophagy pathway. Comparison of the mitochondrial distribution between wild‐type and gas7‐knockout neurons and differences in the regulatory pathway, as well as summarized results of biochemical analyses, differences in mitochondrial morphology as observed by microscopy, and metabolic differences for wild‐type and gas7‐knockout mice
Human GAS7 is a causal gene for obesity based on studies of human GAS7 transgenic mice.14 Here, we report that Gas7‐null mice exhibit lower average energy and reduced maximum energy expenditure levels, increased body weight, and decreased mitochondrial respiration and oxidative phosphorylation, perhaps reflecting a decreased metabolic rate. Together, these findings suggest that mouse Gas7 acts like a lean gene, consistent with human GAS7. Our study focuses on brain tissues and the results suggest that Gas7 plays a positive role in sustaining healthy mitochondrial dynamics in neurons. Interestingly, in this study, we have shown that Gas7 can restore mitochondrial distribution and mitochondrial subtypes in cortical neurons, indicating that Gas7 can regulate mitochondrial dynamics and contributes to metabolism by acting like a lean gene. Although Gas7 expression is abundant in brain and testis, the mechanism underlying Gas7‐mediated regulation of pyruvate dehydrogenase and that enhances the metabolic rates of mice requires further study.
Apart from this metabolic regulation, Gas7 also regulates CDK5 and PKA kinase activities. As a decrease in the activity of CDK5 and an increase in PKA activity promote mitofusion in the absence of Gas7 through posttranslational regulation of Drp‐1, further decreases in Drp‐1 GTPase activity result in mitochondrial elongation and inhibition of fission.46 Here, we have shown that PKA activity is higher in terms of increased phosphorylation of its well‐known target substrate CREB. The mechanism of how Gas7 regulates PKA and CDK5 activity to promote mitofission remains unknown.
In wild‐type neurons, enhanced phosphorylation of Ubiquitin (serine 65) and Parkin (serine 65) is required for degradation of Mitofusin‐1/2 by PINK1 and the Parkin‐mediated pathway to promote mitofission.35 In contrast, because of the decrease in PINK1 kinase expression in gas7‐knockout mice, there is an increase in expression of Mitofusin‐1/2 that enhances mitofusion and results in defects of mitochondrial distribution and perinuclear clustering. The ubiquitination of mitofusins may be reduced in the absence of Gas7, ultimately promoting mitofusion (Figure 8A). Gas7 can rescue levels of PINK1 protein expression in cortical neurons and restore its activity by increasing phosphorylation of its substrate Parkin (S65) (Figure S1), suggesting that Gas7 regulates mitochondrial dynamics specifically in neurons and brain tissue. Collectively, our data indicate that Gas7 is required for the regulation of PINK1, Parkin, and phospho‐Parkin proteins which control mitophagy, so mitophagy initiation may be inhibited in the brains of gas7‐knockout mice due to enhanced mitofusion and perinuclear clustering.
Pyruvate dehydrogenase complex (PDC) plays a major role in regulating mammalian metabolism by utilizing carbohydrate, thereby helping to maintain glucose homeostasis and contributing to the metabolic pathways required for energy production and movement.47, 48, 49 Recent studies provided a link between diet‐dependent modulation of mitochondrial fusion in specific neurons and whole‐body energy metabolism of the animal.50 From this study, they suggest that overfeeding leads to mitochondria elongation by Mfn1/2‐dependent manner in hypothalamic neurons.51 These studies open new avenues of research to understand how mitochondrial dynamics changes in the hypothalamus affect distal metabolic organs. Similarly we observed elongated mitochondria in cortical tissue and we have shown that energy consumption and muscle strength are diminished in Gas7‐knockout mice, indicating that maybe mitochondrial dynamics and function in muscles are not optimal. We also detected decreased expression and activity of pyruvate dehydrogenase (PDH) in Gas7‐knockout mice, it will be interesting to know how mitochondrial dynamic changes in cortex affect metabolic enzyme PDH expression. We did not observe any significant differences in PDH mRNA levels or for the kinases responsible for PDH inactivation in wild‐type and Gas7‐knockout mice (data not shown), and reprovision of Gas7 alone could not rescue the reduced expression of PDH in gas7‐knockout neurons (Figure S1). This decreased expression of PDH indicates that ATP generation may be inhibited because the conversion of acetyl‐co‐A by pyruvate is reduced. This decrease in pyruvate metabolism results in reduced muscle strength and muscle contraction, mirroring the symptoms of PD patients. We have shown that gas7‐knockout mice have lower energy consumption and decreased wheel rotation speed compared with wild‐type (Figure 7A‐F), suggesting that reduced Parkin activity is responsible for the muscle strength weakness they display. Accordingly, it would be interesting to establish the relationship between Gas7 and parkin proteins. Metabolic disorders arising from deficiencies of the PDH/PDK system manifest as defects in the synthesis, metabolism, transportation, and storage of biochemical compounds. Further study is required to investigate the regulation of pyruvate metabolites in the absence of Gas7. We also observed decreased protein expression of Tyrosine Hydroxylase (TH) in gas7‐knockout mouse cerebrum lysates (data not shown), indicating that Gas7 may affect the functioning of dopaminergic neurons and the synthesis of dopamine. Therefore, Gas7 may regulate motor function through its effect on mitochondria in dopaminergic neurons, which warrants further study. Moreover, our previous study showed that aged gas7‐deficient mice exhibit abnormal muscle fiber composition, reduced nerve terminal sprouting of neuromuscular junctions, and reduced motor function.13 Thus, Gas7 may be involved in motor function through various types of neurons and we will address some of the potential mechanisms in future studies.
In summary, our results suggest a mechanism by which Gas7 acts as a positive molecular mediator of mitochondrial dynamics and mitophagy, thereby sustaining a healthy mitochondrial population in neurons.
CONFLICT OF INTEREST
The authors state that there are no actual or potential conflicts of interest.
AUTHOR CONTRIBUTIONS
JNB and SLC conceived and designed the experiments, analyzed the data, and wrote the paper; JNB performed experiments for Figures 2, 4, 5, 6, 7, 8 and Figure S1, BTH performed experiments for Figure 1, and GGL performed the experiment for Figure 3. MJC contributed intellectually to the final version of the manuscript.
Supporting information
ACKNOWLEDGEMENTS
The gas7‐knockout mice were created by the Transgenic Mouse Model Core Facility of the National Core Facility Program for Biotechnology, Ministry of Science and Technology, Taiwan, and the Gene Knockout Mouse Core Laboratory of National Taiwan University Center for Genomic Medicine. SNP genotyping was performed by the National Center for Genome Medicine, located at the Institute of Biomedical Sciences, Academia Sinica. We also thank Dr J. O'Brien for manuscript editing services. This work was supported by an intramural fund from the Institute of Molecular Biology, Academia Sinica, and a theme project of Academia Sinica (2323). This work fulfilled in part the requirements for the PhD thesis of JNB, Molecular Cell Biology, Taiwan International Graduate Program, Institute of Molecular Biology, Academia Sinica and Graduate Institute of Life Sciences, National Defense Medical Center, Taipei, Taiwan. We would like to thank National RNAi Core Facility, Academia Sinica, Taiwan.
Bhupana JN, Huang B‐T, Liou G‐G, Calkins MJ, Lin‐Chao S. Gas7 knockout affects PINK1 expression and mitochondrial dynamics in mouse cortical neurons. FASEB BioAdvances. 2020;2:166–181. 10.1096/fba.2019-00091
REFERENCES
- 1. Brenner DG, Lin‐Chao S, Cohen SN. Analysis of mammalian cell genetic regulation in situ by using retrovirus‐derived "portable exons" carrying the Escherichia coli lacZ gene. Proc Natl Acad Sci USA. 1989;86:5517‐5521. [DOI] [PMC free article] [PubMed] [Google Scholar]
- 2. Lazakovitch EM, She BR, Lien CL, Woo WM, Ju YT, Lin‐Chao S. The Gas7 gene encodes two protein isoforms differentially expressed within the brain. Genomics. 1999;61:298‐306. [DOI] [PubMed] [Google Scholar]
- 3. Aspenstrom P, Fransson A, Richnau N. Pombe Cdc15 homology proteins: regulators of membrane dynamics and the actin cytoskeleton. Trends Biochem Sci. 2006;31:670‐679. [DOI] [PubMed] [Google Scholar]
- 4. Ahmed S, Bu W, Lee RT, Maurer‐Stroh S, Goh WI. F‐BAR domain proteins: Families and function. Commun Integr Biol. 2010;3:116‐121. [DOI] [PMC free article] [PubMed] [Google Scholar]
- 5. Su WB, You J‐J, Huang B‐T, Sivakumar V, Yeh S‐D, Lin‐Chao S. The Pombe Cdc15 Homology Proteins, Madame Curie Biosience Database. Austin, TX: Landes Bioscience; 2009. [Google Scholar]
- 6. She BR, Liou GG, Lin‐Chao S. Association of the growth‐arrest‐specific protein Gas7 with F‐actin induces reorganization of microfilaments and promotes membrane outgrowth. Exp Cell Res. 2002;273:34‐44. [DOI] [PubMed] [Google Scholar]
- 7. Ju YT, Chang AC, She BR, et al. gas7: A gene expressed preferentially in growth‐arrested fibroblasts and terminally differentiated Purkinje neurons affects neurite formation. Proc Natl Acad Sci USA. 1998;95:11423‐11428. [DOI] [PMC free article] [PubMed] [Google Scholar]
- 8. You JJ, Lin‐Chao S. Gas7 functions with N‐WASP to regulate the neurite outgrowth of hippocampal neurons. J Biol Chem. 2010;285:11652‐11666. [DOI] [PMC free article] [PubMed] [Google Scholar]
- 9. Chao CC, Chang PY, Lu HH. Human Gas7 isoforms homologous to mouse transcripts differentially induce neurite outgrowth. J Neurosci Res. 2005;81:153‐162. [DOI] [PubMed] [Google Scholar]
- 10. Akiyama H, Gotoh A, Shin RW, et al. A novel role for hGas7b in microtubular maintenance: possible implication in tau‐associated pathology in Alzheimer disease. J Biol Chem. 2009;284:32695‐32699. [DOI] [PMC free article] [PubMed] [Google Scholar]
- 11. Uchida T, Akiyama H, Sakamoto W, et al. Direct optical microscopic observation of the microtubule polymerization intermediate sheet structure in the presence of gas7. J Mol Biol. 2009;391:849‐857. [DOI] [PubMed] [Google Scholar]
- 12. Hidaka M, Koga T, Gotoh A, Sanada M, Hirose K, Uchida T. Alzheimer's disease‐related protein hGas7b interferes with kinesin motility. J Biochem. 2012;151:593‐598. [DOI] [PubMed] [Google Scholar]
- 13. Huang BT, Chang PY, Su CH, Chao CC, Lin‐Chao S. Gas7‐deficient mouse reveals roles in motor function and muscle fiber composition during aging. PLoS ONE. 2012;7:e37702. [DOI] [PMC free article] [PubMed] [Google Scholar]
- 14. Yang X, Deignan JL, Qi H, et al. Validation of candidate causal genes for obesity that affect shared metabolic pathways and networks. Nat Genet. 2009;41:415‐423. [DOI] [PMC free article] [PubMed] [Google Scholar]
- 15. Schadt EE, Lamb J, Yang X, et al. An integrative genomics approach to infer causal associations between gene expression and disease. Nat Genet. 2005;37:710‐717. [DOI] [PMC free article] [PubMed] [Google Scholar]
- 16. Scacheri PC, Crabtree JS, Novotny EA, et al. Bidirectional transcriptional activity of PGK‐neomycin and unexpected embryonic lethality in heterozygote chimeric knockout mice. Genesis. 2001;30:259‐263. [DOI] [PubMed] [Google Scholar]
- 17. Masu Y, Wolf E, Holtmann B, Sendtner M, Brem G, Thoenen H. Disruption of the CNTF gene results in motor neuron degeneration. Nature. 1993;365:27‐32. [DOI] [PubMed] [Google Scholar]
- 18. Soriano P, Montgomery C, Geske R, Bradley A. Targeted disruption of the c‐src proto‐oncogene leads to osteopetrosis in mice. Cell. 1991;64:693‐702. [DOI] [PubMed] [Google Scholar]
- 19. Melanson EL, Ingebrigtsen JP, Bergouignan A, Ohkawara K, Kohrt WM, Lighton JR. A new approach for flow‐through respirometry measurements in humans. Am J Physiol Regul Integr Comp Physiol. 2010;298:R1571‐R1579. [DOI] [PMC free article] [PubMed] [Google Scholar]
- 20. Kaiyala KJ, Wisse BE, Lighton JRB. Validation of an equation for energy expenditure that does not require the respiratory quotient. PLoS ONE. 2019;14:e0211585. [DOI] [PMC free article] [PubMed] [Google Scholar]
- 21. Abreu‐Vieira G, Xiao C, Gavrilova O, Reitman ML. Integration of body temperature into the analysis of energy expenditure in the mouse. Mol Metab. 2015;4:461‐470. [DOI] [PMC free article] [PubMed] [Google Scholar]
- 22. Peng JY, Lin CC, Chen YJ, et al. Automatic morphological subtyping reveals new roles of caspases in mitochondrial dynamics. PLoS Comput Biol. 2011;7:e1002212. [DOI] [PMC free article] [PubMed] [Google Scholar]
- 23. Westermann B. Mitochondrial fusion and fission in cell life and death. Nat Rev Mol Cell Biol. 2010;11:872‐884. [DOI] [PubMed] [Google Scholar]
- 24. Misgeld T, Schwarz TL. Mitostasis in neurons: maintaining mitochondria in an extended cellular architecture. Neuron. 2017;96:651‐666. [DOI] [PMC free article] [PubMed] [Google Scholar]
- 25. Chen H, Chan DC. Mitochondrial dynamics in mammals. Curr Top Dev Biol. 2004;59:119‐144. [DOI] [PubMed] [Google Scholar]
- 26. Youle RJ, van der Bliek AM. Mitochondrial fission, fusion, and stress. Science. 2012;337:1062‐1065. [DOI] [PMC free article] [PubMed] [Google Scholar]
- 27. Strack S, Wilson TJ, Cribbs JT. Cyclin‐dependent kinases regulate splice‐specific targeting of dynamin‐related protein 1 to microtubules. J Cell Biol. 2013;201:1037‐1051. [DOI] [PMC free article] [PubMed] [Google Scholar]
- 28. Knott AB, Perkins G, Schwarzenbacher R, Bossy‐Wetzel E. Mitochondrial fragmentation in neurodegeneration. Nat Rev Neurosci. 2008;9:505‐518. [DOI] [PMC free article] [PubMed] [Google Scholar]
- 29. Otera H, Wang C, Cleland MM, et al. Mff is an essential factor for mitochondrial recruitment of Drp1 during mitochondrial fission in mammalian cells. J Cell Biol. 2010;191:1141‐1158. [DOI] [PMC free article] [PubMed] [Google Scholar]
- 30. Palmer CS, Elgass KD, Parton RG, Osellame LD, Stojanovski D, Ryan MT. Adaptor proteins MiD49 and MiD51 can act independently of Mff and Fis1 in Drp1 recruitment and are specific for mitochondrial fission. J Biol Chem. 2013;288:27584‐27593. [DOI] [PMC free article] [PubMed] [Google Scholar]
- 31. Montminy MR, Bilezikjian LM. Binding of a nuclear protein to the cyclic‐AMP response element of the somatostatin gene. Nature. 1987;328:175‐178. [DOI] [PubMed] [Google Scholar]
- 32. Youle RJ, Narendra DP. Mechanisms of mitophagy. Nat Rev Mol Cell Biol. 2011;12:9‐14. [DOI] [PMC free article] [PubMed] [Google Scholar]
- 33. Shirihai OS, Song M, Dorn GW, 2nd . How mitochondrial dynamism orchestrates mitophagy. Circ Res. 2015;116:1835‐1849. [DOI] [PMC free article] [PubMed] [Google Scholar]
- 34. Lutz AK, Exner N, Fett ME, et al. Loss of parkin or PINK1 function increases Drp1‐dependent mitochondrial fragmentation. J Biol Chem. 2009;284:22938‐22951. [DOI] [PMC free article] [PubMed] [Google Scholar]
- 35. Durcan TM, Fon EA. The three 'P's of mitophagy: PARKIN, PINK1, and post‐translational modifications. Genes Dev. 2015;29:989‐999. [DOI] [PMC free article] [PubMed] [Google Scholar]
- 36. Dagda RK, Pien I, Wang R, et al. Beyond the mitochondrion: cytosolic PINK1 remodels dendrites through protein kinase A. J Neurochem. 2014;128:864‐877. [DOI] [PMC free article] [PubMed] [Google Scholar]
- 37. Das Banerjee T, Dagda RY, Dagda M, et al. PINK1 regulates mitochondrial trafficking in dendrites of cortical neurons through mitochondrial PKA. J Neurochem. 2017;142:545‐559. [DOI] [PMC free article] [PubMed] [Google Scholar]
- 38. Chen Y, Dorn GW, 2nd . PINK1‐phosphorylated Mitofusin 2 is a Parkin receptor for culling damaged mitochondria. Science. 2013;340:471‐475. [DOI] [PMC free article] [PubMed] [Google Scholar]
- 39. Holness MJ, Sugden MC. Regulation of pyruvate dehydrogenase complex activity by reversible phosphorylation. Biochem Soc Trans. 2003;31:1143‐1151. [DOI] [PubMed] [Google Scholar]
- 40. Chen H, Chan DC. Mitochondrial dynamics–fusion, fission, movement, and mitophagy–in neurodegenerative diseases. Hum Mol Genet. 2009;18:R169‐R176. [DOI] [PMC free article] [PubMed] [Google Scholar]
- 41. Melser S, Lavie J, Benard G. Mitochondrial degradation and energy metabolism. Biochem Biophys Acta. 2015;1853:2812‐2821. [DOI] [PubMed] [Google Scholar]
- 42. Rambold AS, Lippincott‐Schwartz J. Mechanisms of mitochondria and autophagy crosstalk. Cell Cycle. 2011;10:4032‐4038. [DOI] [PMC free article] [PubMed] [Google Scholar]
- 43. Wai T, Langer T. Mitochondrial dynamics and metabolic regulation. Trends Endocrinol Metab. 2016;27:105‐117. [DOI] [PubMed] [Google Scholar]
- 44. Jin SM, Youle RJ. PINK1‐ and Parkin‐mediated mitophagy at a glance. J Cell Sci. 2012;125:795‐799. [DOI] [PMC free article] [PubMed] [Google Scholar]
- 45. Ould Amer Y, Hebert‐Chatelain E. Mitochondrial cAMP‐PKA signaling: What do we really know? Biochim Biophys Acta Bioenerg. 2018;1859:868‐877. [DOI] [PubMed] [Google Scholar]
- 46. Taguchi N, Ishihara N, Jofuku A, Oka T, Mihara K. Mitotic phosphorylation of dynamin‐related GTPase Drp1 participates in mitochondrial fission. J Biol Chem. 2007;282:11521‐11529. [DOI] [PubMed] [Google Scholar]
- 47. Dunford EC, Herbst EA, Jeoung NH, et al. PDH activation during in vitro muscle contractions in PDH kinase 2 knockout mice: effect of PDH kinase 1 compensation. Am J Physiol Regul Integr Comp Physiol. 2011;300:R1487‐R1493. [DOI] [PubMed] [Google Scholar]
- 48. Denton RM, Halestrap AP. Regulation of pyruvate metabolism in mammalian tissues. Essays Biochem. 1979;15:37‐77. [PubMed] [Google Scholar]
- 49. Peters SJ, St Amand TA, Howlett RA, Heigenhauser GJ, Spriet LL. Human skeletal muscle pyruvate dehydrogenase kinase activity increases after a low‐carbohydrate diet. Am J Physiol. 1998;275:E980‐E986. [DOI] [PubMed] [Google Scholar]
- 50. Dietrich MO, Liu ZW, Horvath TL. Mitochondrial dynamics controlled by mitofusins regulate Agrp neuronal activity and diet‐induced obesity. Cell. 2013;155:188‐199. [DOI] [PMC free article] [PubMed] [Google Scholar]
- 51. Schneeberger M, Dietrich MO, Sebastian D, et al. Mitofusin 2 in POMC neurons connects ER stress with leptin resistance and energy imbalance. Cell. 2013;155:172‐187. [DOI] [PMC free article] [PubMed] [Google Scholar]
Associated Data
This section collects any data citations, data availability statements, or supplementary materials included in this article.
Supplementary Materials