. 2020 Jan 20;9:e47654. doi: 10.7554/eLife.47654

Figure 1. HMM and MSD analysis results of KRAS4b and isoforms in HeLa and MEF cells.

(a) Illustration of combinations of fusion proteins between hypervariable region (HVR) and G-domain of RAS isoforms with HaloTag that were expressed in HeLa and RAS-less MEF cells. (b) Hidden Markov modeling (HMM) using vbSPT of single molecule tracking (SMT) measurements showed different mobile patterns and was described with three and two diffusive states for KRAS4b and HRAS, respectively. Each diffusion (state) coefficient is pseudo-color coded, as marked by the rainbow scale bar and probability of transitions between states per frame rate (Δt = 10 ms). (c) The Mean Squared Displacement (MSD) vs. time plot showed highest confinement of KRAS4b whereas the least for HRAS (* indicates three displacement values under shaded area are significantly different, p<0.05). (d) Diffusion coefficients and occupancy (HMM analysis) from various isoforms of RAS molecules on HeLa cell membrane are summarized in pie charts. (e) MSD analysis on SMT measurements on RAS-less MEF cells for various RAS isoforms (* indicates three displacement values under shaded area are significantly different, p<0.05). (f) The summary of diffusive states from HMM analysis on MEF cells are presented in pie charts for KRAS4b, HRAS, KRAS4a and NRAS. (g) MSD plot showing a significant difference (p<0.05) in confinement (bending of curve) of diffusion between KRAS4b full-length and its truncated HVR, whereas no significant difference was found in case of HRAS. (h) Pie charts show both KRAS4b and HRAS HVRs diffusion were best described by a two-state model using HMM analysis.

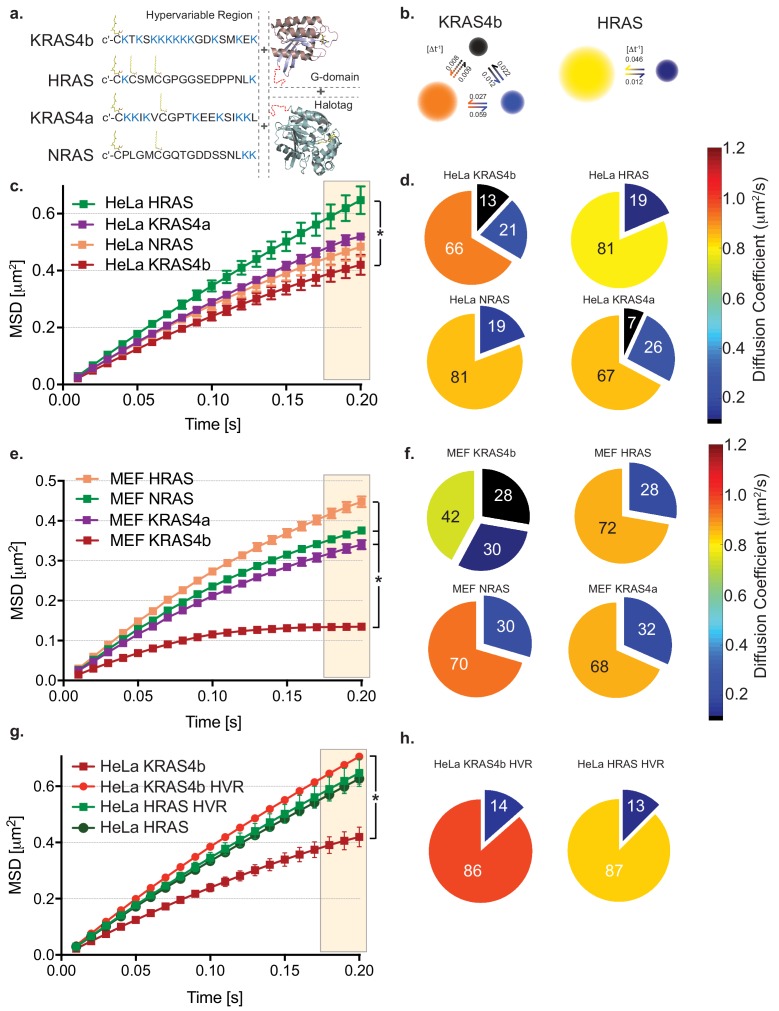
Figure 1—source data 1. MSD values over time (plotted in Figure 1c) for Halotag-KRAS4b, -KRAS4a, -HRAS, and -NRAS transiently expressed in HeLa cells and recorded with TIRF microscopy.
Figure 1—source data 2. Diffusion coefficients and occupancy fractions obtained by HMM analysis (plotted in Figure 1d) of Halotag-KRAS4b, -KRAS4a, -HRAS, and -NRAS transiently expressed in HeLa cells.
Figure 1—source data 3. MSD values over time (plotted in Figure 1e) for Halotag-KRAS4b, -KRAS4a, -HRAS, and -NRAS expressed in isogenic Mouse Embryonic Fibroblast cell pools.
Figure 1—source data 4. Diffusion coefficients and occupancy fractions obtained by HMM analysis (plotted in Figure 1f) of Halotag-KRAS4b, -KRAS4a, -HRAS, and -NRAS expressed in isogenic Mouse Embryonic Fibroblasts.
Figure 1—source data 5. MSD values over time (plotted in Figure 1g) for Halotag-KRAS4b, Halotag-KRAS4b HVR (lacking the G domain), Halotag-HRAS, and Halotag-HRAS HVR transiently expressed in HeLa cells.
Figure 1—source data 6. Diffusion coefficients and occupancy fractions obtained by HMM analysis (plotted in Figure 1h) of Halotag-KRAS4b HVR and Halotag-HRAS HVR transiently expressed in HeLa cells.

Figure 1.

Figure 1—figure supplement 1. Detection of HaloTagged RAS protein constructs in live cells by single molecule tracking and confocal imaging.

Figure 1—figure supplement 1.

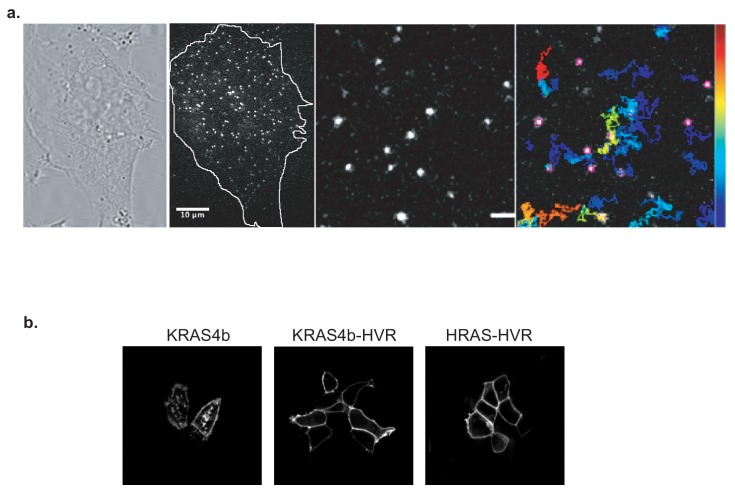
(a) Bright-field and total internal reflection fluorescence (TIRF) microscope image of a HeLa cell expressing HaloTag-KRAS4b after labeling cells with 25pM fluorescent (JF646) HaloTag ligand (Figure 1—video 1). Very sparsely labeled single molecules of membrane-tethered RAS were observed under 100X magnification (scale bar 10 µm). A typical example of 16 µm x16µm region of interest of the plasma membrane in the lamella is shown here that was selected for ultra-fast video imaging. Tracks were obtained from TrackMate software and displayed in pseudo-color according to the residence time of each particle at the membrane (scale bar 2 µm) (Figure 1—video 2). (b) HaloTag-RAS, HVR and its mutant fusion proteins were transiently expressed in HeLa cells to examine and confirm membrane localization using a confocal microscope.

Figure 1—figure supplement 2. HMM and MSD analysis results of KRAS4b G12D diffusion in cancer cell lines.

Figure 1—figure supplement 2.

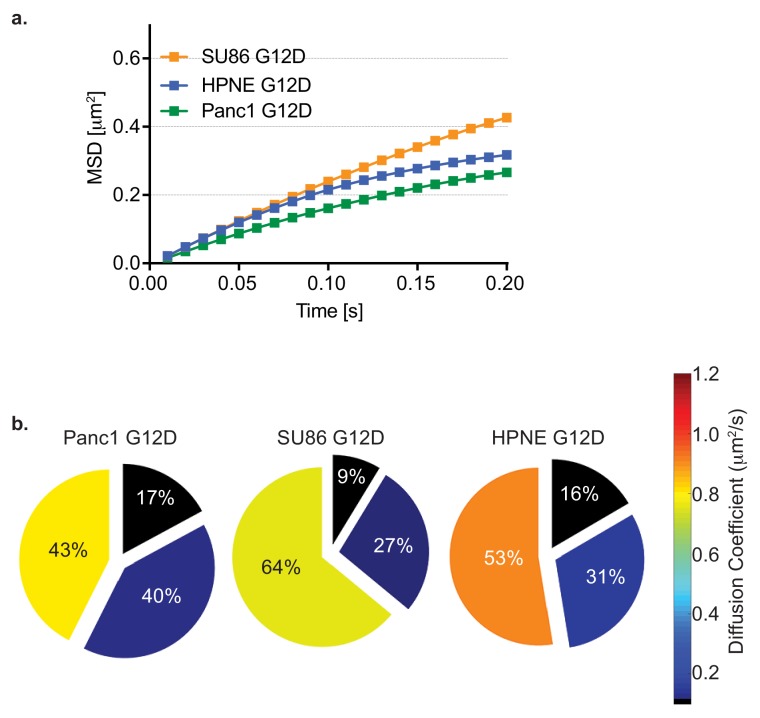
HaloTag-KRAS4b G12D diffusion was measured in different pancreatic cancer cell lines (SU.86.86, hTERT-HPNE and PANC-1 harboring mutant KRAS G12D). (a) MSD profile of diffusion of PANC-1 , hTERT-HPNE and SU.86.86 cells. (b) Pie charts indicating diffusion coefficients and occupancy (HMM analysis) of Halo-KRAS4b in background of mutant KRAS4b in pancreatic cancer cell lines.
Figure 1—figure supplement 2—source data 1. MSD values over time (plotted in Figure 1—figure supplement 2a) for overexpressed, exogenous Halotag-KRAS4b G12D in a panel of pancreatic cancer cell lines with existing KRAS4b G12D mutations (SU.86.86, hTERT-HPNE , and PANC-1).
Figure 1—figure supplement 2—source data 2. Diffusion coefficients and occupancy fractions obtained by HMM analysis (plotted in Figure 1—figure supplement 2b) for overexpressed, exogenous Halotag-KRAS4b G12D in a panel of pancreatic cancer cell lines with existing KRAS4b G12D mutations (SU.86.86, hTERT-HPNE , and Panc-1).

Figure 1—figure supplement 3. Single detection, trajectories of KRAS4b diffusion and Dox-induced KRAS4b diffusion.

Figure 1—figure supplement 3.

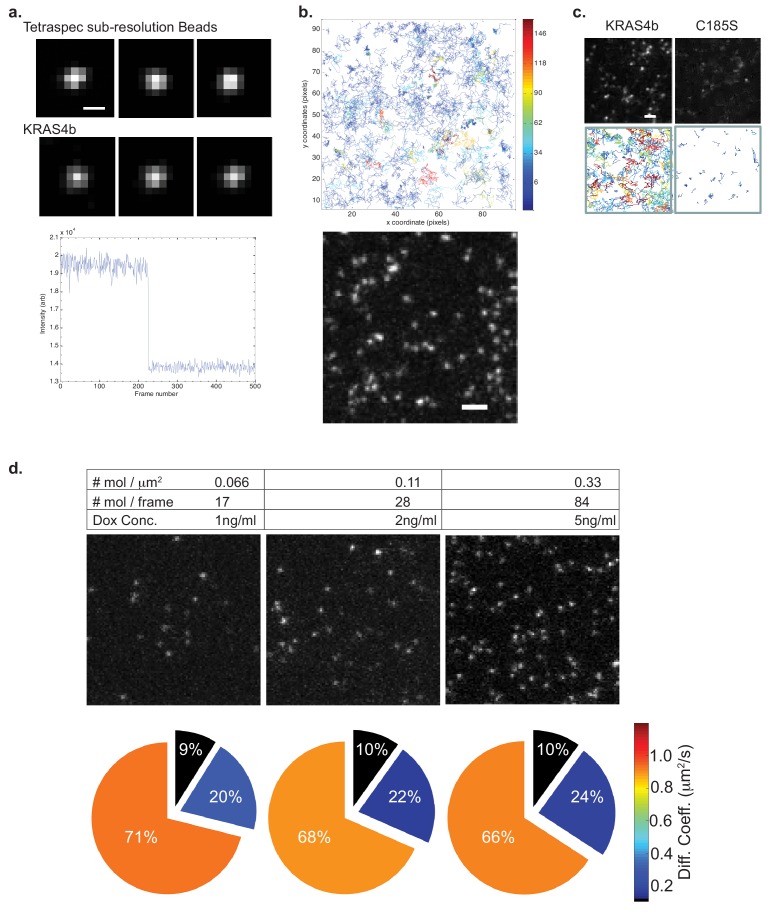
(a) Single-molecule detection was confirmed by comparing the point spread function (PSF) of a single sub-resolution bead vs. RAS molecule under our TIRF microscope (top panel), and by single-step photobleaching of fluorescent RAS particles, as depicted in the profile. (b) Example of a typical membrane area (16 µm x 16 µm) showing HaloTag-KRAS4b tracks obtained during ultrafast video imaging for 10 s. (c) C185S mutant, which is devoid of farnesylation modification at the C-terminus of KRAS4b, could not associate to the plasma membrane as very few particles were observed during TIRF video microscopy (Figure 1—video 3). Note: scale bars in a) represent 500 nm, in b) and c) represent 2 µm. (d) KRAS4b surface density of Dox induced KRAS4b expressed at different levels in HeLa cells; HMM analysis showed no significant difference in its diffusion rates and occupancy at different express levels for KRAS4b.
Figure 1—figure supplement 3—source data 1. Diffusion coefficients and occupancy fractions obtained by HMM analysis (plotted in Figure 1—figure supplement 3d) of Halotag-KRAS4b for increasing concentrations of doxycycline in a dox-inducible Halotag-KRAS4b HeLa cell pool.

Figure 1—figure supplement 4. Basal signaling profiles and Ras expression levels of isogenic MEF pools.

Figure 1—figure supplement 4.

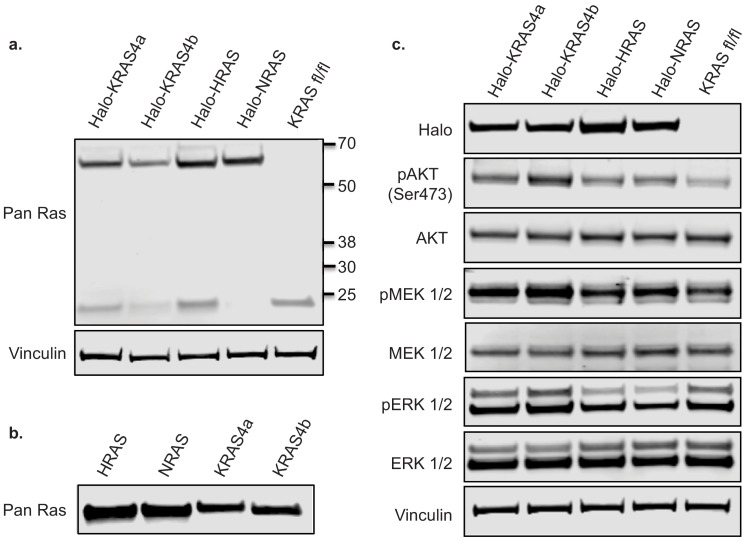
(a) Basal RAS expression levels of isogenic MEF pools were analyzed by western blot and compared to the parental MEF cell line, which expresses endogenous murine floxed Kras alone (b) 10 ng purified human RAS protein was analyzed by western blot using a mouse monoclonal pan RAS antibody (c) Basal signaling profiles of isogenic MEF pools were analyzed by western blot alongside the parental line.

Figure 1—video 1. TIRF video microscopy of HaloTag-KRAS4b in a live HeLa cell.

Download video file (13.2MB, mp4)

Figure 1—video 2. 16µm x16µm region of interest of the plasma membrane in Hela cell and tracks.

Download video file (7.3MB, mp4)

Figure 1—video 3. TIRF video microscopy of HaloTag-KRAS4b-C185S mutant in live Hela cell.

Download video file (34.3MB, mp4)