Abstract
Background
Clinical reactions to bony fish species are common in patients with allergy to fish and are caused by parvalbumins of the β-lineage. Cartilaginous fish such as rays and sharks contain mainly α-parvalbumins and their allergenicity is not well understood.
Objective
To investigate the allergenicity of cartilaginous fish and their α-parvalbumins in individuals allergic to bony fish.
Methods
Sensitization to cod, salmon, and ray among patients allergic to cod, salmon, or both (n = 18) was explored by prick-to-prick testing. Clinical reactivity to ray was assessed in 11 patients by food challenges or clinical workup. IgE-binding to β-parvalbumins (cod, carp, salmon, barramundi, tilapia) and α-parvalbumins (ray, shark) was determined by IgE-ELISA. Basophil activation tests and skin prick tests were performed with β-parvalbumins from cod, carp, and salmon and α-parvalbumins from ray and shark.
Results
Tolerance of ray was observed in 10 of 11 patients. Prick-to-prick test reactions to ray were markedly lower than to bony fish (median wheal diameter 2 mm with ray vs 11 mm with cod and salmon). IgE to α-parvalbumins was lower (median, 0.1 kU/L for ray and shark) than to β-parvalbumins (median, ≥1.65 kU/L). Furthermore, α-parvalbumins demonstrated a significantly reduced basophil activation capacity compared with β-parvalbumins (eg, ray vs cod, P < .001; n = 18). Skin prick test further demonstrated lower reactivity to α-parvalbumins compared with β-parvalbumins.
Conclusions
Most patients allergic to bony fish tolerated ray, a cartilaginous fish, because of low allergenicity of its α-parvalbumin. A careful clinical workup and in vitro IgE-testing for cartilaginous fish will improve patient management and may introduce an alternative to bony fish into patients’ diet.
Keywords: Parvalbumin, Fish allergy, Cod, Ray, Food challenge, Basophil activation, Skin prick test, IgE
Introduction
Fish allergy is typically a life-long disease with symptoms of varying severity including life-threatening anaphylaxis.1,2 During the evolution of jawed vertebrates, 2 classes of fish developed, cartilaginous (Chondrichthyes) and bony fish (Osteichthyes).3 Although most of the studies focusing on fish allergy have described bony fish as the primary allergen source, the allergenicity and cross-reactivity of cartilaginous fish is not well understood.4–7
The prevalence of fish allergy ranges from 0.2% to 3% in the general population and up to 8% in occupational settings.8–10 Increasing rates of allergic sensitization to fish may be linked to the increasing worldwide production and consumption of fish.11 As of 2015, annual per capita fish consumption in the European Union was about 25 kg, while in the Asia-Pacific region over 100 kg was reached.12,13
The most frequently consumed fish species belong to the bony fish. In the European Union, the top 5 consumed species in 2014 were tuna, cod, salmon, Alaska pollock, and herring.13 In the United States, the most commonly consumed species include anchovy, Alaska pollock, and herring.13 In Asia, the variety of eaten species is enormous and often include tilapia, carp, and barramundi.12 Cartilaginous fish, including rays and sharks, are also commonly traded and consumed worldwide.10,14 In Europe, shark meat is commonly consumed in Spain and Italy.15
The diversity of consumed fish species and the increase in their global availability pose a challenge for accurate diagnosis and management of patients with fish allergy. Diagnostic tests for fish allergy use a limited number of only bony fish species. They do not include cartilaginous fish.16 The potential risk of reacting to multiple fish species, along with the lack of comprehensive and accurate diagnostic products, often results in the recommendation of complete avoidance of all fish to patients presenting to the clinic with fish allergy.17,18 This may adversely affect the nutritional requirements and the quality of life of affected individuals.19
The major fish allergen parvalbumin is a heat-stable, intracellular EF-hand calcium-binding protein of low molecular weight (10-14 kDa).20,21 It is abundant in fast-twitch white muscle where it is involved in muscle relaxation.22 In addition, minor allergens such as aldolase A and β-enolase have been identified and were demonstrated to be heat-sensitive.23 Parvalbumins are present in all vertebrates and are divided into 2 evolutionary sublineages, α and β, which have different biochemical properties.21 Although β-parvalbumins are abundant in bony fish, α-parvalbumins are mainly found in cartilaginous fish and higher vertebrates.4 Bony fish β-parvalbumins are predominant sensitizers and often cross-reactive.4,24 Regarding the allergenicity of fish α-parvalbumins, there is only 1 report demonstrating binding of patients’ IgE to α-parvalbumin from red stingray.25
An in-depth investigation of the allergenicity of cartilaginous fish and their parvalbumins has not been performed yet. We conducted a comprehensive study characterizing the clinical reactivity of patients with bony fish allergy to ray, a cartilaginous fish. Furthermore, we analyzed patients’ IgE reactivity to parvalbumins from both bony and cartilaginous fish using ELISA, basophil activation test (BAT), and skin prick test (SPT).
Methods
Study subjects
Eighteen individuals with fish allergy were recruited from the Centre Hospitalier de Luxembourg (Table I). Criteria for study participation included a documented clinical history of fish allergy and positive ImmunoCAP (Thermo Fisher Scientific, Waltham, Mass) for cod, salmon, or both. Total IgE was measured using ImmunoCAP. The study was approved by the National Committee for Medical Research Ethics in Luxembourg (Ref. 201307/04). Seven individuals with allergies other than to fish were used as controls in ELISA and BAT (Table E1 in this article’s Online Repository at www.jaci-inpractice.org). Informed written consent was obtained from all participants or their legal representatives.
Table I. Demographic and clinical characteristics of patients allergic to fish.
| Patient | Age (y)/sex | Fish allergy symptoms | Total IgE (kU/L) | ImmunoCAP (kUA/L) |
PPT (mm) |
Clinical reactivity |
|||||
|---|---|---|---|---|---|---|---|---|---|---|---|
| Cod | Salmon | Cod | Salmon | Ray | Cod | Salmon | Ray | ||||
| 1 | 19/F | A, AE, U | 294 | 1.5 | 3.1 | 15 | 10 | 2 | + | + | ND |
| 2 | 7/M | U, OAS | 2244 | 0.2 | 7.9 | 0 | 10 | 0 | − | + | − |
| 3 | 12/F | AE, U, OAS, V | 352 | 5.9 | 5.4 | 8 | 10 | 2 | + | + | − |
| 4 | 8/M | A, U | 828 | 9.8 | 5.0 | 10 | 12 | 3 | + | + | *− |
| 5 | 13/M | AE, AP, U, V | 2005 | 1.6 | 0.9 | 22 | 21 | 0 | + | + | ND |
| 6 | 35/M | A, U | 46 | 12.0 | 8.5 | 17 | 4 | 2 | + | + | − |
| 7 | 16/F | U, V | 1184 | 1.5 | 6.5 | 11 | 15 | 0 | + | + | − |
| 8 | 35/M | OAS, U | 48 | 0.5 | 1.3 | 8 | 8 | 2 | + | + | − |
| 9 | 16/F | AD, A | 660 | 23.0 | 22.0 | 10 | 11 | 2 | + | + | ND |
| 10 | 35/M | U, A | 380 | 48.0 | 56.0 | 23 | 18 | 5 | + | + | ND |
| 11 | 9/M | U, OAS | 1455 | 0.8 | 0.3 | 11 | 0 | 0 | + | − | − |
| 12 | 9/M | AE, AP | 745 | 6.4 | 8.0 | 24 | 13 | 1 | + | + | − |
| 13 | 11/M | AP, OAS | 116 | 7.7 | 9.4 | 8 | 12 | 2 | + | + | ND |
| 14 | 14/M | C, U | 345 | 0.8 | 1.1 | 11 | 12 | 0 | + | + | *− |
| 15 | 15/M | U, OAS | 1218 | 2.0 | 1.1 | 18 | 4 | 0 | + | + | ND |
| 16 | 10/M | U, OAS | 1432 | 4.0 | 6.5 | 28 | ND | 0 | + | + | − |
| 17 | 11/M | A, U | 2297 | >100.0 | >100.0 | 9 | ND | 6 | + | + | ND |
| 18 | 12/M | A, AE, AP | 723 | >100.0 | >100.0 | 18 | ND | 15 | + | + | †+ |
| Median | NA | NA | 734 | 4.9 | 6.5 | 11 | 11 | 2 | NA | NA | NA |
A, Asthma; AD, atopic dermatitis; AE, angioedema; AP, abdominal pain; C, conjunctivitis; F, female; M, male; NA, not available; ND, not determined; OAS, oral allergy syndrome; U, urticaria; V, vomiting.
Reactivity to bony and cartilaginous fish was explored by PPT with cooked fish and the wheal size (mm) is indicated. Information about clinical reactivity is based on self-report or diagnostic food challenges.
Open food challenge.
Double-blind placebo-controlled food challenge.
Prick-to-prick testing and clinical reactivity to bony and cartilaginous fish
All patients allergic to fish were subjected to prick-to-prick tests (PPTs) with boiled (20 minutes) bony (Atlantic cod, salmon, or both) and cartilaginous fish (thornback ray) meat. Glycerin-containing saline and 0.1% histamine dihydrochloride were used as negative and positive controls, respectively. An average wheal diameter of greater than or equal to 3 mm compared with negative control was rated positive.
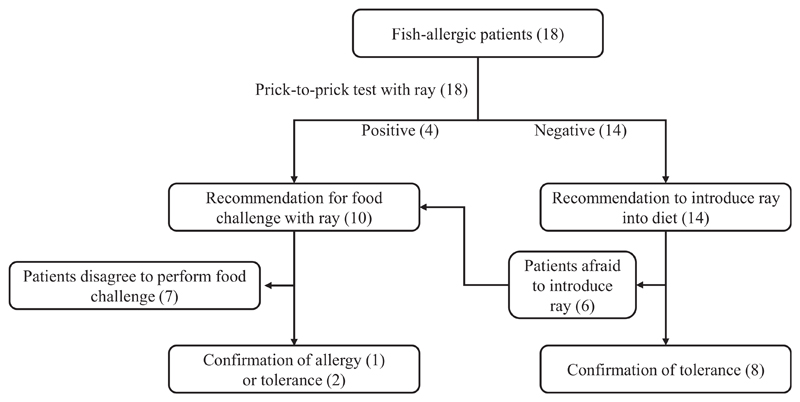
Information about clinical reactivity to cod and salmon, based on history of allergic symptoms after eating specific fish, was obtained from all patients. Clinical reactivity to ray by oral exposure was assessed according to the procedure described in Figure E1 in this article’s Online Repository at www.jaci-inpractice.org. Briefly, PPT with ray was performed in all 18 patients. Eleven patients (10 negative and 1 positive in PPT with ray) agreed to be tested for potential tolerance of ray either by food challenge or by following recommendations to introduce eating ray at home. Of these, 8 patients consumed a serving dose of ray (200 g for adults, 100 g for children) at least twice. In addition, 2 patients (P4 and P14) were subjected to open food challenges because they were apprehensive to directly introducing ray in the diet. One patient (P18), with a positive PPT result to ray, was subjected to a double-blind placebo-controlled food challenge performed according to previously published procedures.26
Purification and characterization of the parvalbumins
Purified parvalbumins used in this study are listed in Table II. Detailed purification and characterization procedures are available in this article’s Method’s section in the Online Repository at www.jaci-inpractice.org.
Table II. Parvalbumins investigated in the study.
| Species (common name) | Species (scientific name) | Allergen name | Parvalbumin lineage | Parvalbumin used in ELISA and BAT | Parvalbumin used in SPT |
|---|---|---|---|---|---|
| Atlantic cod | Gadus mohrua | Gad m 1 | β | n | n |
| Common carp | Cyprinus carpio | Cyp c 1 | β | n | n |
| Atlantic salmon | Salmo salar | Sal s 1 | β | n | n |
| Atlantic salmon | Salmo salar | NA | α | r | — |
| Barramundi | Lates calcarifer | Lat c 1 | β | n | — |
| Nile tilapia | Oreochromis niloticus | NA | β | n | — |
| Thornback ray | Raja clavata | NA | α | n | n |
| Gummy shark | Mustelus antarcticus | NA | α | n | n |
n, Natural; NA, not available; r, recombinant; —, not used.
ELISA
Quantification of parvalbumin-specific serum IgE in patients allergic to fish and controls was performed by ELISA as previously described.23 Five β-parvalbumins and 3 α-parvalbumins were used. Specific IgE values of greater than 0.1 kUA/L were rated positive. Negative values were rated as 0.1 kUA/L.
Inhibition ELISA
Cross-reactivities between β-parvalbumins and α-parvalbumins were analyzed by inhibition ELISA. Plates were coated with 1 μg/mL cod β-parvalbumin. Sera from 10 individuals allergic to fish were preincubated with β-parvalbumins from cod (self-inhibition) or salmon, or with ray α-parvalbumin at serial dilutions (0.01-100 μg/mL). Binding of serum IgE to coated cod parvalbumin was determined as described.23
Basophil activation test
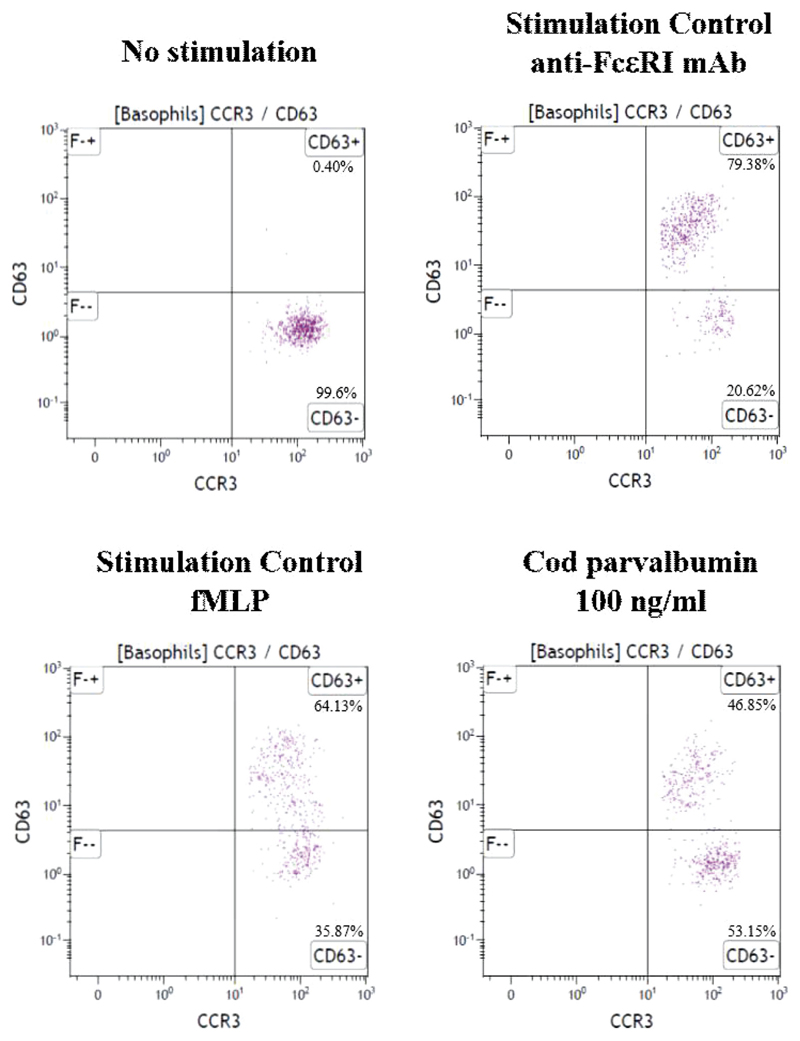
Basophil activation on stimulation with increasing concentrations of parvalbumins was assessed using the Flow-CAST kit (Bühlmann Laboratories AG, Schönenbuch, Switzerland) according to the manufacturer’s protocol. The gating strategy is shown in Figure E2 in this article's Online Repository at www.jaci-inpractice.org. Detailed methods of the BAT are specified in this article’s Methods section in the Online Repository.
Skin prick testing with purified parvalbumins
SPT was performed in patients allergic to fish using purified natural parvalbumins (0.1, 1, 10, and 50 μg parvalbumin/mL) diluted in saline containing 0.03% human serum albumin (ALK, Inc., Hørsholm, Denmark). β-parvalbumins from cod, carp, and salmon and α-parvalbumins from ray and shark were used. In the children with a clinical history of severe allergic reactions to fish, the number of parvalbumins was reduced by excluding β-parvalbumins from carp, salmon, or both. Skin test results were rated positive when the average wheal diameter was greater than or equal to 3 mm compared with that achieved with saline.
Results
Demographic and clinical characteristics of study subjects
Eighteen individuals with fish allergy (mean age, 16 years) and 7 controls (mean age, 29 years) were included in this study. Total serum IgE level ranged from 46 to 2297 kU/L for individuals with fish allergy and from 59 to 1121 kU/L for controls (Table I and Table E1). Severity of the clinical symptoms of fish allergy varied, including asthma, urticaria, and gastrointestinal symptoms (Table I). Sensitization to cod and salmon was confirmed by ImmunoCAP with the respective fish extracts. Specific IgE titers for cod ranged from 0.2 kUA/L to more than 100 kUA/L (median, 4.9 kUA/L). IgE specific to salmon ranged from 0.3 to more than 100 kUA/L (median, 6.5 kUA/L) (Table I). All patients were positive for both cod and salmon in ImmunoCAP according to cutoff of 0.1 kUA/L.
Low in vivo reactivity to ray
To explore the reactivity of patients allergic to fish to ray, a cartilaginous fish, PPTs with cooked cod, salmon, and ray were performed (Table I). All patients reacted to at least 1 bony fish (17 of 18 for cod, median wheal diameter, 11 mm; 14 of 15 for salmon, median wheal diameter, 11 mm). In contrast, PPTs with ray demonstrated positive reactions in only 4 of 18 patients, with a median wheal diameter of 2 mm for all patients (Table I). For the group of positive patients in PPT with ray (P4, P10, P17, and P18), the mean wheal diameter was 7 mm. In case of the other 14 patients, negative in PPT with ray, the mean wheal diameter was 1 mm.
Clinical reactivity to bony fish correlated with PPT results, with 16 of 18 patients being positive to both cod and salmon, whereas P2 and P11 reacted only to salmon or cod, respectively. Clinical reactivity on ingestion of ray was assessed in 11 patients, of which 10 were negative and tolerated this fish. The only patient showing allergic symptoms after ingestion of ray (doubleblind placebo-controlled food challenge) was P18, who had a positive result in PPT with ray (average wheal diameter, 15 mm) (Table I).
Characterization of the parvalbumins
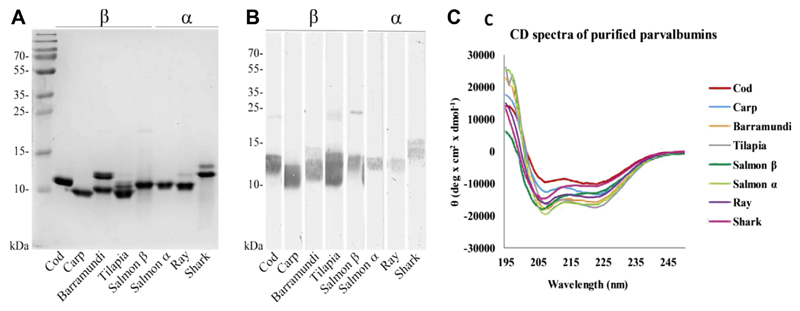
Eight fish parvalbumins (5 β and 3 α) were purified and used in the study (Table II). Their purity was demonstrated by Coomassie brilliant blue staining of SDS gels (see Figure E3, A, in this article’s Online Repository at www.jaci-inpractice.org). Protein identity was confirmed by Western blotting with antiparvalbumin antibodies (Figure E3, B). All parvalbumins demonstrated the expected α-helical secondary structure, as determined by circular dichroism spectroscopy (Figure E3, C). Membership to the α or β lineage of parvalbumins was confirmed by Matrix-Assisted Laser Desorption/Ionization Time-of-Flight (MALDI-TOF) mass spectrometry (data not shown).
Low IgE titers to α-parvalbumins from cartilaginous fish
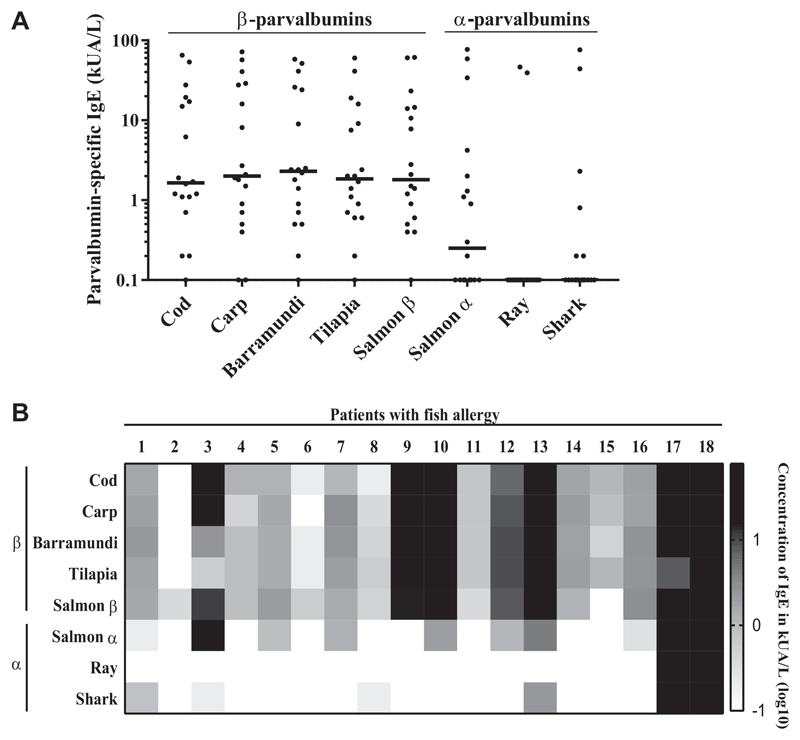
IgE titers for α-parvalbumins from cartilaginous fish (ray, shark) were significantly lower compared with IgE titers for any of the tested β-parvalbumins (eg, cod vs shark, P < .05; tilapia vs ray, P < .0001; Figure 1, A; see Table E2 in this article’s Online Repository at www.jaci-inpractice.org). No significant difference between IgE titers for different β-parvalbumins was observed (Table E2). IgE levels to salmon α-parvalbumin were lower than to β-parvalbumins, but higher than to cartilaginous fish α-parvalbumins (median IgE to β-parvalbumins, ≥1.6 kUA/L; salmon α-parvalbumin, 0.2 kUA/L; ray and shark α-parvalbumins, 0.1 kUA/L; Figure 1, A; see Table E3 in this article’s Online Repository at www.jaci-inpractice.org).
Figure 1.
IgE levels to α-parvalbumins are significantly lower than IgE levels to β-parvalbumins. A, IgE titers (kUA/L) to α-parvalbumins and β-parvalbumins among 18 patients allergic to fish were determined by ELISA. B, Patient-specific IgE recognition patterns to α-parvalbumins and β-parvalbumins. The signal intensity of parvalbumin-specific IgE is represented in a grading log10 scale for concentrations of measured parvalbumin-specific IgE (kUA/L).
All 18 patients exhibited positive IgE titers (0.2-72 kUA/L) to at least 1 of the β-parvalbumins (Figure 1, B; Table E3). Seventeen of 18 patients had IgE for multiple β-parvalbumins, while P2 was monosensitized to salmon β-parvalbumin, which was in accordance with the clinical reactivity of this patient (Figure 1, B, and Table I). Positive IgE titers to ray and shark parvalbumin were found in 2 and 6 patients, respectively, and were generally lower compared with IgE titers to β-parvalbumins in corresponding patients (Figure 1, B, and Table E3).
Specific IgE levels to all tested parvalbumins were below the detection limit in control subjects (data not shown).
Weak IgE cross-reactivity between cod β-parvalbumin and ray α-parvalbumin
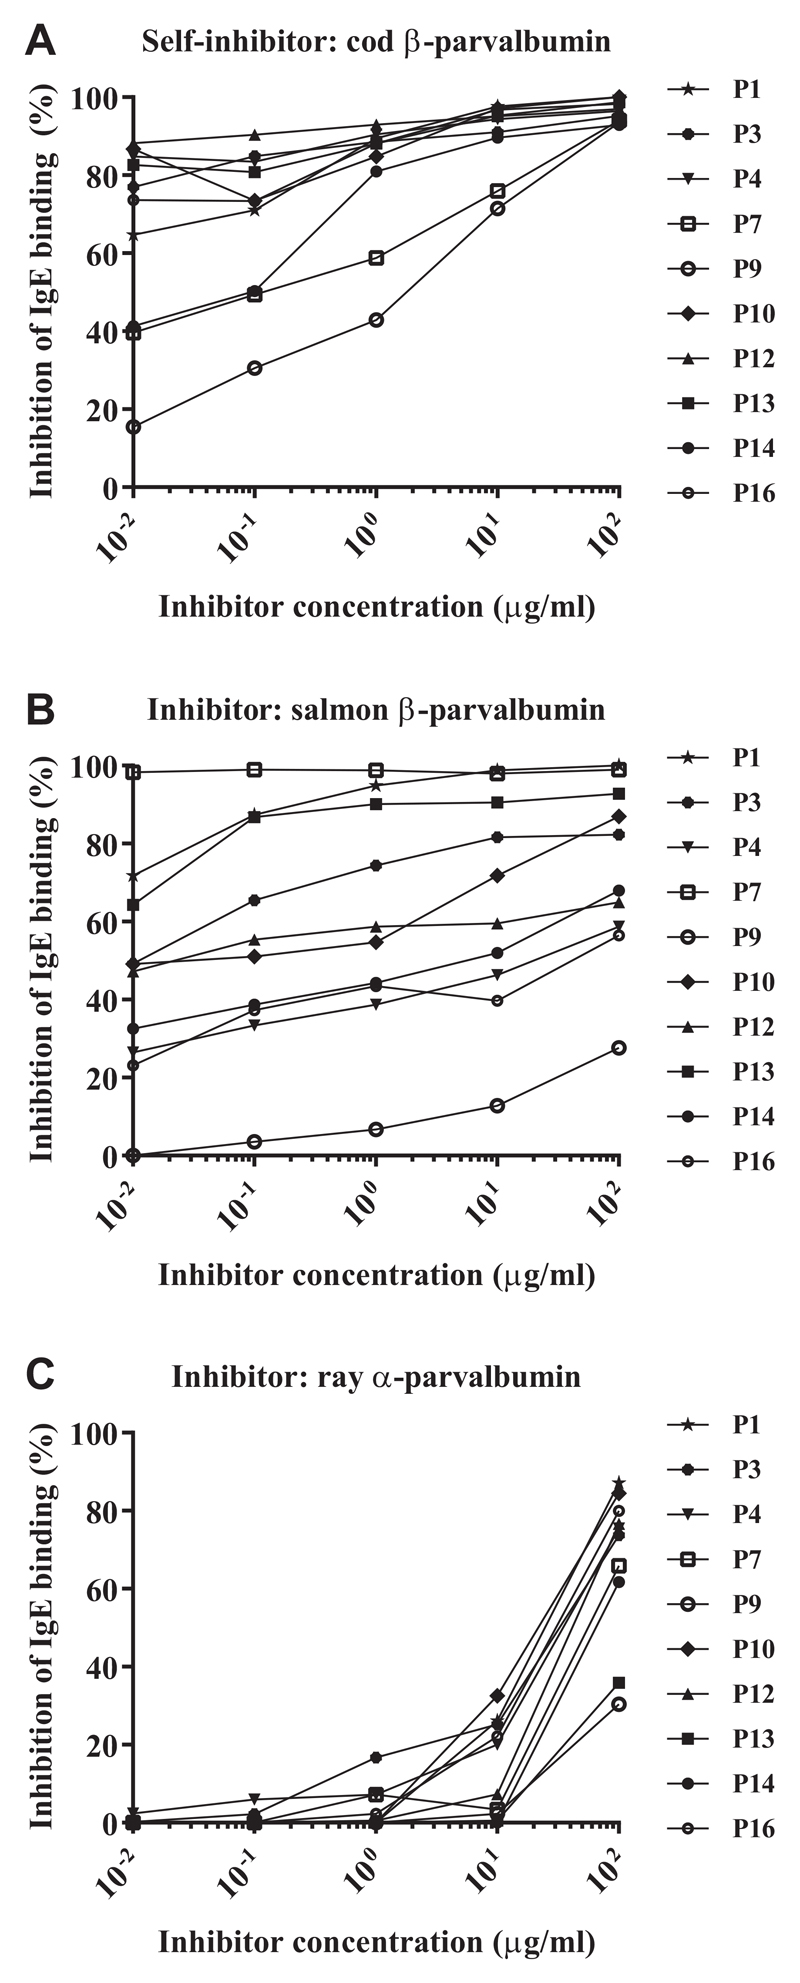
IgE cross-reactivity between cod β-parvalbumin and salmon β-parvalbumin or ray α-parvalbumin was analyzed. The concentration of cod parvalbumin required to reach 50% inhibition of IgE-binding to cod parvalbumin was as low as 0.01 μg/mL for 7 of 10 subjects. The highest tested concentration of the inhibitor (100 μg/mL) resulted in an inhibition of more than 90% of IgE-binding in all tested individuals (Figure 2, A).
Figure 2.
IgE antibody cross-reactivity of cod α-parvalbumin to salmon (β) and ray (α) parvalbumin determined by inhibition ELISA in patients allergic to bony fish (n = 10). Microtiter plates were coated with cod β-parvalbumin and sera preincubated with cod β-parvalbumin (A), salmon β-parvalbumin (B), or ray α-parvalbumin (C) at increasing concentrations.
The cross-reactivity between cod and salmon β-parvalbumins was patient-dependent. To inhibit IgE-binding to cod parvalbumin by 50%, 0.01 μg/mL salmon β-parvalbumin was required for P1, P7, and P13. An inhibitor concentration of 0.1 μg/mL inhibited binding to cod parvalbumin in 3 additional patients (P3, P10, and P12). The highest tested inhibitor concentration resulted in more than 50% inhibition in 9 of 10 patients. For P9, inhibition did not reach 50% in the tested range of inhibitor concentrations (Figure 2, B).
IgE cross-reactivity between cod and ray parvalbumins was very low. Ray parvalbumin induced more than 50% inhibition only when used in the highest concentration (100 μg/mL) in 8 of 10 subjects. For P9 and P13, the inhibition did not reach 50% in the tested range of inhibitor concentrations (Figure 2, C).
Low basophil activation in response to fish α-parvalbumins
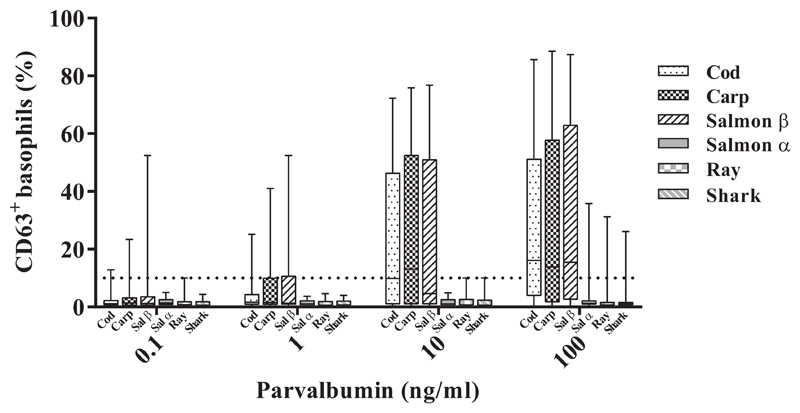
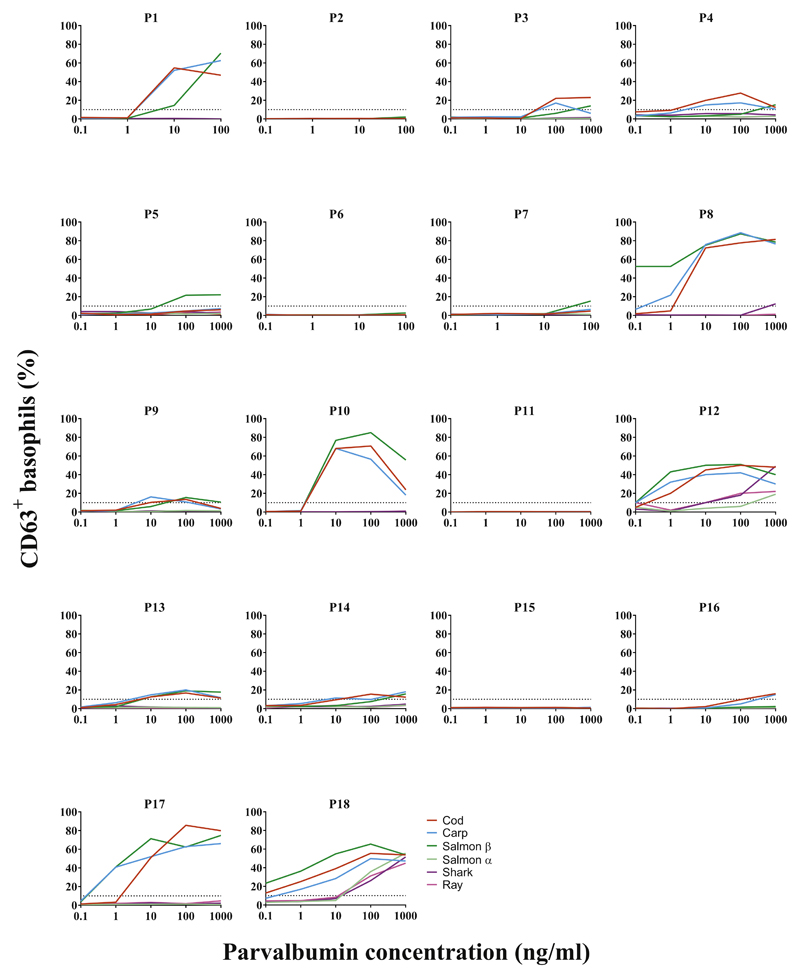
α-parvalbumins from ray, shark, and salmon demonstrated lower capacity to activate basophils than did β-parvalbumins from cod, carp, and salmon (Figure 3). On stimulation with 100 ng/mL parvalbumins, the median amount of CD63+ basophils was 13.9% to 16.2% with various β-parvalbumins compared with less than 1.2% with α-parvalbumins (Figure 3; see Table E4 in this article’s Online Repository at www.jaci-inpractice.org). The difference in basophil activation capacity between α-parvalbumins from cartilaginous fish and any of the tested β-parvalbumins was statistically significant (eg, ray vs cod, P < .001; shark vs cod, P < .01; n = 18) (see Table E5 in this article’s Online Repository at www.jaci-inpractice.org). Response to salmon α-parvalbumin was significantly lower than to cod and salmon β-parvalbumins but not when compared with carp parvalbumin (Table E5). Fourteen of 18 patients demonstrated positive reactions to at least 1 of the parvalbumins. All 14 patients were positive to β-parvalbumins, whereas only 2 (P12 and P18) reacted to α-parvalbumins as well when proteins were used at concentrations up to 100 ng/mL (Table E4; see Figure E4 in this article’s Online Repository at www.jaci-inpractice.org). Furthermore, the concentration of α-parvalbumins required to elicit a positive response was higher than that of β-parvalbumins.
Figure 3.
Basophil response to α-parvalbumins was lower than to β-parvalbumins. Data indicate basophil activation (measured as percentage of CD63+ basophils) in response to stimulation with different doses of fish parvalbumins in patients allergic to fish (n = 18).
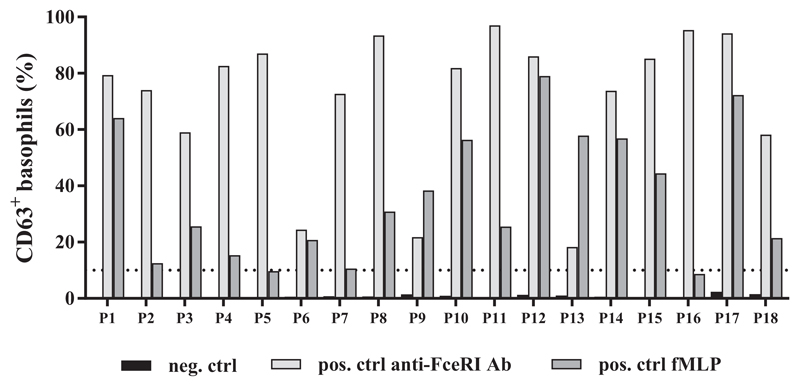
All patients responded positively to the stimulation with an anti-FcεRI mAb, whereas 16 of 18 patients responded to formylmethionyl-leucyl-phenylalanine stimulation (Figure E5, available in this article's Online Repository at www.jaci-inpractice.org). None of the controls demonstrated a positive basophil activation in response to stimulation with parvalbumins in a concentration of up to 10 μg/mL (data not shown).
Weak skin prick reactivity to α-parvalbumins in patients allergic to bony fish
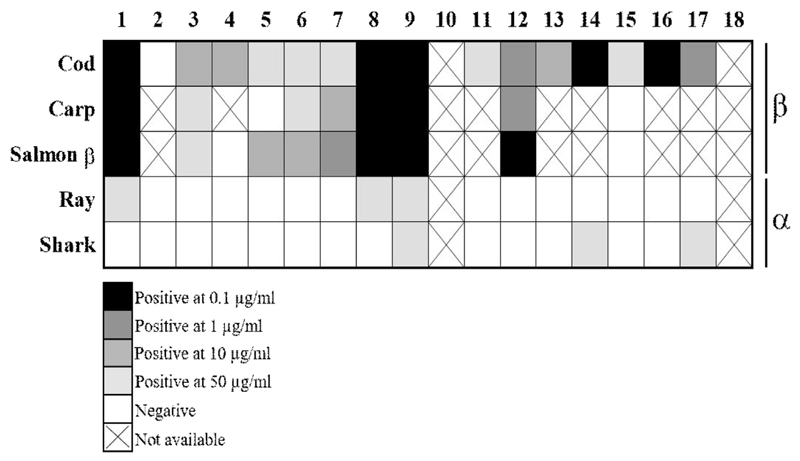
β-parvalbumins from cod, carp, and salmon induced positive skin reactions in 94%, 78%, and 80% of the tested patients, respectively (Figure 4). In contrast, each of the α-parvalbumins induced positive skin reactions in only 3 of 16 patients. Furthermore, the parvalbumin concentration needed to induce positive skin reactions was 100- to 500-fold higher for α-parvalbumins than for β-parvalbumins (Figure 4; see Table E6 in this article’s Online Repository at www.jaci-inpractice.org). Detailed results of the SPT for patients allergic to fish are presented in Table E6. Negative control (saline) did not induce any skin reaction.
Figure 4.
α-Parvalbumins show lower capacity than β-parvalbumins to induce skin reactions in patients allergic to fish. SPTs were performed with different doses of natural purified fish parvalbumins. Parvalbumins were used in concentrations ranging from 0.1 μg/mL to 50 μg/mL. Average wheal diameter of greater than or equal to 3 mm compared with negative control was rated as a positive response. (X) indicates that SPT was not performed.
Discussion
Fish-allergic individuals are generally advised to avoid all fish due to the potential risk of reacting to a wide variety of species in addition to the primary sensitizing source.18,27 Although many studies have described different species of bony fish as highly allergenic and cross-reactive, reports of allergy to cartilaginous fish are rare and contradictory.5–7 Because of the lack of knowledge about the allergenicity of alternative fish sources such as cartilaginous fish, patients may be subjected to unnecessary food restrictions, possibly influencing their dietary requirements and quality of life.19,28
Most patients with fish allergy are sensitized to β-parvalbumins present in the muscle of bony fish.24,29 Parvalbumins of the α-lineage are abundant in muscle tissue of cartilaginous fish and higher vertebrates.24 Chicken and frog α-parvalbumins were shown to be responsible for IgE cross-reactivity to bony fish β-parvalbumins in some of the patients allergic to fish.30,31 However, only 1 study explored the sensitization to an α-parvalbumin from cartilaginous fish.25 In this study, Cai et al25 demonstrated IgE-binding to parvalbumin from red stingray in patients allergic to bony fish by IgE immunoblotting but no functional assays or in vivo studies were performed.
Here, we analyzed the allergenicity of cartilaginous fish and their parvalbumins in patients with allergy to bony fish. We were able to demonstrate low reactivity to ray, a cartilaginous fish, by PPT (median wheal diameter, 2 mm; n = 18). Furthermore, 11 patients were tested for tolerance of ray, 10 of which were able to consume a serving dose of ray without developing allergic symptoms (Table I). Only P18 had a positive reaction to ray on double-blind placebo-controlled food challenge, which was in accordance with his skin reaction in PPT with cooked ray. In addition, P10 and P17 demonstrated positive skin reactions to cooked ray. However, these 2 patients did not agree to undergo a food challenge and their clinical reactivity to ray could not be confirmed.
To our knowledge, besides the study from Cai et al,25 only 2 other studies explored the IgE reactivity to cartilaginous fish. Calderon-Rodriguez et al5 demonstrated low allergenicity of cooked dogfish sharks in 34 patients with fish allergy. However, PPT result with raw dogfish was positive in 6 patients, possibly demonstrating sensitization to fish allergens that are not heat-stable. A study from Koyama et al7 that examined patients’ IgE-binding to raw extracts from 43 fish species demonstrated a low IgE recognition of cartilaginous compared with bony fish.7
To dissect the molecular basis of the observed tolerance to cartilaginous fish in patients with confirmed allergy to bony fish, we explored IgE reactivity to fish α-parvalbumins and β-parvalbumins in our patient cohort. Levels of IgE specific to α-parvalbumins from cartilaginous fish were significantly lower than to bony fish β-parvalbumins (Figure 1 and Tables E2 and E3). Previous studies demonstrated high cross-reactivity of β-parvalbumins from different fish species; however, the cross-reactivity between fish β-parvalbumins and α-parvalbumins has not been explored.27,32,33 We demonstrated patient-dependent IgE cross-reactivity between cod and salmon β-parvalbumins by inhibition ELISA. Interestingly, the cross-reactivity between parvalbumins from cod (β) and ray (α) was strikingly low (Figure 2).
BATs further confirmed the low IgE reactivity of α-parvalbumins in our patient cohort (Figure 3). Overall, 14 of 18 patients demonstrated positive reactions with any of the tested parvalbumins. All 14 patients were positive to β-parvalbumins and only 3 reacted to α-parvalbumins when tested up to 1000 ng/mL. Four patients did not respond to purified parvalbumins in BAT possibly due to the low parvalbumin-specific IgE levels compared with the total IgE levels in these patients (P2, P6, P11, and P15). Furthermore, these patients may have been sensitized to other fish allergens such as aldolase A, β-enolase, or collagen.23,34 Previous studies have tested the capacity of BAT to diagnose food allergy and have shown that it has superior specificity and comparable sensitivity compared with measuring specific IgE titers and SPT.35 However, BAT has never been investigated as an additional diagnostic tool for fish allergy. In our study, parvalbumin reactivity in BAT was comparable to reactivity in ELISA and SPT in case of β-parvalbumins for all 14 patients who reacted positively in BAT. However, quantitatively, the Spearman correlation test did not demonstrate a significant correlation between the titer of parvalbumin-specific IgE (ELISA) and reactivity in BAT (see Table E7 in this article’s Online Repository at www.jaci-inpractice.org).
Lower reactivity to α-parvalbumins compared with β-parvalbumins was further confirmed by SPT with purified natural parvalbumins (Figure 4). Only 5 of 16 patients were positive to ray or shark parvalbumin, and the concentration of α-parvalbumins needed to elicit positive reactions was in all cases higher than the concentrations of β-parvalbumins in the corresponding patients.
The observed difference in allergenicity between fish β-parvalbumins and α-parvalbumins may be explained by low sequence identity between these 2 parvalbumin lineages (<50% sequence identity between α-parvalbumin from leopard shark or thornback ray and β-parvalbumins from cod, carp, or salmon).4,16 Interestingly, sequence identity between fish β-parvalbumins and α-parvalbumin from frog and chicken is higher than 50%, possibly contributing to occasional cross-reactivities between these species.4,36
Most commonly used in vitro diagnostic platforms for fish allergy such as the ImmunoCAP Rapid, ImmunoCAP ISAC (Thermo Scientific), and MADx (Macro Array Diagnostics, Vienna, Austria) are based on quantification of IgE against extracts from a total of 28 different fish species and 2 recombinant β-parvalbumins (cod and carp).16 Cartilaginous fish, such as different species of rays and sharks, are not included in these tests. Cartilaginous fish have been described as equal in nutritional value to bony fish and have multiple health benefits.37,38 The inclusion of specific cartilaginous fish species and their parvalbumins in the current diagnostic assays would be essential to confirm the tolerance among patients allergic to fish, eventually resulting in less stringent curtailment of the diet of individuals allergic to fish.
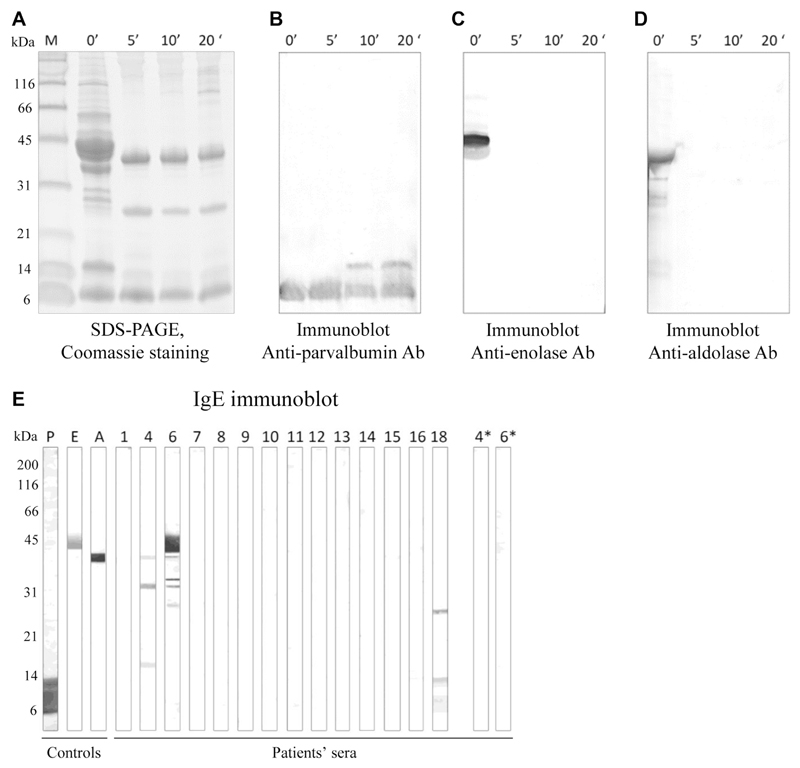
Our study demonstrated that IgE reactivity to parvalbumin may predict the clinical reactivity to specific fish species. However, it is important to note that some patients may be sensitized to other, minor fish allergens such as aldolase A, β-enolase, or collagen.23,34 Because cartilaginous fish is most commonly consumed cooked, we performed IgE immunoblots with extracts of raw and cooked ray (see the Methods section and Figure E6 in this article's Online Repository at www.jaciinpractice.org). Only 1 of 14 patients tested was found to be positive to ray enolase and 2 patients to ray aldolase when tested on an extract of raw ray. However, these 2 patients were negative to these 2 allergens when tested on extract of cooked ray (Figure E6, E). None of the patients showed IgE-binding to ray collagen (expected molecular weight of collagen α-chain, ~110 kDa) (Figure E6, E).
Currently, diagnostic testing (PPT, food challenges, or both) for several cartilaginous fish species can be recommended to explore the possibility of tolerance of cartilaginous fish in individuals sensitized to bony fish. A limitation of this study is the low number of patients tested for tolerance to ray using food challenges, as well as the number of explored cartilaginous fish species. Future studies investigating the potential tolerance of several cartilaginous fish species in a larger patient cohort will help to develop a diagnostic workup of patients with fish allergies and improve patient management.
In summary, our study demonstrated the low allergenicity of ray and fish α-parvalbumins in patients sensitized and allergic to bony fish. Inclusion of cartilaginous fish in routine diagnosis of fish allergy may prevent unnecessary food restrictions. This approach represents a first step toward precision medicine in patients allergic to fish leading to improved quality of life of affected individuals.
Methods
Purification and characterization of the study parvalbumins
Natural β-parvalbumins were purified from Atlantic cod (Gadus morhua), common carp (Cyprinus carpio), Atlantic salmon (Salmo salar), barramundi (Asian sea bass, Lates calcarifer), and Nile tilapia (Oreochromis niloticus). Natural α-parvalbumins were purified from thornback ray (Raja clavata) and gummy shark (Mustelus antarcticus). To explore the allergenicity of an α-parvalbumin from bony fish and to compare it with the β-counterpart from the same species, a recombinant α-parvalbumin from Atlantic salmon (Uniprot ID: C0HAT9) was expressed in Escherichia coli and purified.
Natural cod and ray parvalbumins were purified from extracts of muscle tissue of the respective fish species using sequential ion-exchange and size exclusion chromatography following the methods described in previous studies.E1,E2
For purification of carp parvalbumin, a protein extract was prepared by stirring homogenized carp muscle tissue in 3 volumes of PBS overnight at 4°C. The extract was centrifuged to remove cell debris and heated to 95°C for 30 minutes. Precipitated proteins were removed by centrifugation and the supernatant dialyzed against 20 mM Bis-Tris buffer (pH 6.5) and applied to a Q Sepharose ion-exchange column (GE Healthcare, Chicago, Ill). Bound proteins were eluted from the column by a linear salt gradient from 0% to 50% elution buffer (20 mM Bis-Tris, 1 mol NaCl, pH 6.5). Fractions containing carp parvalbumin were loaded onto HiPrep 26/60 Sephacryl S-200 High Resolution Column (GE Healthcare) equilibrated with PBS. Low-molecular-weight fractions containing carp parvalbumin were dialyzed against 20 mM Bis-Tris, pH 5.5, and loaded onto a Mono Q 5/50 GL Tricon column (GE Life Science). Pure carp parvalbumin was eluted as a single peak from the column by a linear salt gradient from 0% to 35% elution buffer (20 mM Bis-tris, 1 mol NaCl, pH 5.5).
Natural parvalbumins from salmon (β), barramundi, tilapia, and gummy shark were isolated using ammonium sulfate precipitation as previously described for mackerel.E3 Briefly, fish muscle tissue was heated in PBS at 95°C for 20 minutes. After homogenization, overnight stirring at 4°C, and centrifugation, the parvalbumins were purified from the supernatant by ammonium sulfate precipitation followed by dialyses against ammonium bicarbonate buffer and subsequently PBS.
Recombinant salmon α-parvalbumin was expressed and purified according to previously published procedures.E4
Purified parvalbumins were visualized by Coomassie brilliant blue staining of the 15% SDS gels. Protein identity was confirmed by Western blotting using 2 antiparvalbumin antibodies (Swant, 235, an mAb raised against β-parvalbumin, and Abcam, ab11427, a polyclonal antibody raised against α-parvalbumin). Secondary structure of the purified parvalbumins was determined by circular dichroism spectroscopy. Circular dichroism spectra were measured from 190 to 250 nm using Jasco J-810 spectropolarimeter (Jasco International Co., Hachioji, Tokyo), and 5 separate acquisitions for each protein were averaged. Presence of specific lineage (α or β) and isoforms of natural purified parvalbumins was determined using full-length proteins and Matrix-Assisted Laser Desorption/Ionization Time-of-Flight (MALDI-TOF) mass spectrometer (Microflex, Bruker Daltonics, Bremen, Germany).
Basophil activation test
BAT was performed using the Flow-CAST kit (Bühlmann Laboratories AG, Schönenbuch, Switzerland), according to the protocol recommended by the manufacturer. Fresh blood samples from 18 patients allergic to fish and 7 controls were tested with β-parvalbumins from cod, carp, and salmon, and α-parvalbumins from salmon, ray, and shark. Blood samples were incubated with 10-fold serial dilution of allergens. For patients allergic to fish, parvalbumins were initially tested in dilutions between 0.1 and 100 ng/mL. Because for some of the patients 100 ng/mL of the parvalbumins was not sufficient to reach maximum basophil activation, patients were re-tested wherever possible and parvalbumins in a concentration up to 1000 ng/mL were used. In control subjects, concentration of parvalbumins used in BAT was up to 10,000 ng/mL. The percentage of activated (CD63+) basophils on stimulation was determined by flow cytometry. CCR3 was used as a marker for basophils. Stimulation buffer without parvalbumins was used as a negative control. Formyl-methionyl-leucyl-phenylalanine and anti-FcεRI antibody were used as positive controls. Data acquisition and analysis were performed using BD FACSDiva (BD Biosciences) and Kaluza (Beckman Coulter, Brea, Calif) softwares, respectively. The gating strategy is represented in Figure E5. The response was considered positive if the parvalbumin induced an activation of more than 10% of the basophils.
Detection of minor fish allergens in ray extract
To explore the relevance of fish allergens other than parvalbumins in cartilaginous fish, Western blots with antiparvalbumin antibody as well as with antienolase and antialdolase antibodies were performed with extracts from ray filet cooked for 5, 10, or 20 minutes, according to previously published protocols.E2 Uncooked fish was used as a control. Furthermore, IgE immunoblots with extracts from raw and cooked (10 minutes) ray filet were performed using sera of 14 patients, to analyze whether IgE-binding bands were visible in the molecular weight ranges of β-enolase, aldolase A, or collagen.E5
Statistical analysis
The nonparametric paired Friedman test was used for comparisons between the responses to different parvalbumins in ELISA and BAT. Multiple comparisons were performed using Dunn posttest. Data are expressed as medians. For the correlation between parvalbumin-specific IgE and percentage of activated basophils for each parvalbumin, the Spearman correlation test was used, and P values adjusted using the Bonferroni correction for multiple comparisons. The analyses were performed using GraphPad Prism software version 7 (GraphPad Software, La Jolla, Calif).
Extended Data
Figure E1.
Diagnostic flowchart for assessing tolerance of ray. Numbers in parentheses represent the numbers of subjects for each step.
Figure E2.
Gating strategy in BAT. Basophilic cells were selected from whole blood based on CCR3high/SSClow. Activation of basophils was determined by expression of an activation marker CD63. Expression of CD63 for unstimulated control, 2 stimulation controls (anti-FCεRI mAb and fMLP), and stimulation with 100 ng/mL cod parvalbumin is demonstrated for P1 as an example. fMLP, Formyl-methionyl-leucyl-phenylalanine.
Figure E3.
Characterization of parvalbumins from bony and cartilaginous fish species. A, Coomassie-stained SDS-PAGE gel of purified parvalbumins. B, Western blot using commercial antiparvalbumin antibodies. C, Circular dichroism (CD) spectra of purified parvalbumins.
Figure E4.
BAT. Percentages of CD63+ basophils (y-axes) at different concentrations of β-parvalbumins and α-parvalbumins are represented for individual subjects allergic to fish (P1-P18).
Figure E5.
Response to positive (anti-FcεRI and fMLP) and negative (stimulation buffer) controls in BAT for subjects with fish allergy. Ctrl, Control; fMLP, formyl-methionyl-leucyl-phenylalanine; Neg, negative; pos, positive.
Figure E6.
Detection of fish allergens in ray extract. A, Coomassie-stained SDS-PAGE of extract of raw ray filet and ray filet cooked for 5, 10, or 20 minutes. B-D, Immunoblots with ray extract using antiparvalbumin antibody (Fig E6, B), antienolase antibody (Fig E6, C), and antialdolase antibody (Fig E6, D). E, IgE immunoblots using extract of raw ray filet. P, E, and A stand for controls parvalbumin, enolase and aldolase, respectively. P4 and P6 were additionally tested on extract of cooked ray (4* and 6*). Ab, Antibody.
Table E1. Demographic and clinical characteristics of control subjects.
| Control no. | Sex | Age (y) | Total IgE (kU/L) | Allergies |
|---|---|---|---|---|
| C1 | M | 17 | 1121 | Peanut |
| C2 | F | 45 | 59 | Pollen |
| C3 | M | 14 | 16 | Hazelnut |
| C4 | M | 12 | 913 | Peanut |
| C5 | M | 48 | 86 | Wasp venom |
| C6 | F | 28 | 533 | Grass pollen |
| C7 | F | 42 | 123 | House dust mite |
F, Female; M, male.
Table E2. Comparison (Friedman test with Dunn posttest) of IgE levels specific to different purified parvalbumins*.
Table E3. Quantification of parvalbumin-specific IgE antibodies (kUA/L) in sera of fish-allergic subjects using direct ELISA*.
| Patient no. | Cod | Carp | Barramundi | Tilapia | Salmon β | Salmon α | Ray | Shark |
|---|---|---|---|---|---|---|---|---|
| P1 | 1.6 | 1.9 | 2.2 | 1.7 | 1.5 | 0.2 | 0.1 | 0.8 |
| P2 | 0.1 | 0.1 | 0.1 | 0.1 | 0.4 | 0.1 | 0.1 | 0.1 |
| P3 | 17.1 | 27.7 | 2.4 | 0.6 | 10.6 | 33.9 | 0.1 | 0.2 |
| P4 | 1.2 | 0.5 | 0.9 | 0.9 | 0.9 | 0.1 | 0.1 | 0.1 |
| P5 | 1.2 | 1.5 | 1.4 | 1.4 | 2.1 | 0.9 | 0.1 | 0.1 |
| P6 | 0.2 | 0.1 | 0.2 | 0.2 | 0.6 | 0.1 | 0.1 | 0.1 |
| P7 | 1.1 | 2.7 | 2.4 | 2.0 | 1.4 | 1.3 | 0.1 | 0.1 |
| P8 | 0.2 | 0.4 | 0.5 | 0.6 | 0.5 | 0.1 | 0.1 | 0.2 |
| P9 | 19.3 | 29 | 24.0 | 16.0 | 14 | 0.1 | 0.1 | 0.1 |
| P10 | 14.9 | 16 | 26.0 | 19.0 | 14.5 | 2 | 0.1 | 0.1 |
| P11 | 0.7 | 0.7 | 0.7 | 0.7 | 0.4 | 0.1 | 0.1 | 0.1 |
| P12 | 6.2 | 8.1 | 9.0 | 9.1 | 7.8 | 1.1 | 0.1 | 0.1 |
| P13 | 27.6 | 40.6 | 41.0 | 41.0 | 23.3 | 4.2 | 0.1 | 2.3 |
| P14 | 1.7 | 2.1 | 1.8 | 2.0 | 1.2 | 0.1 | 0.1 | 0.1 |
| P15 | 1.1 | 0.9 | 0.5 | 1.1 | 0.1 | 0.1 | 0.1 | 0.1 |
| P16 | 1.9 | 1.8 | 2.5 | 2.4 | 2.8 | 0.3 | 0.1 | 0.1 |
| P17 | 65.1 | 72 | 51.5 | 7.5 | 60.5 | 77 | 46.5 | 76 |
| P18 | 53.4 | 57 | 58 | 60 | 61 | 58.8 | 39.2 | 44 |
| Average | 11.9 | 14.6 | 12.5 | 9.2 | 11.3 | 10.0 | 4.8 | 6.9 |
| Median | 1.6 | 2 | 2.3 | 1.8 | 1.8 | 0.2 | 0.1 | 0.1 |
| Positive patients (%) | 94.4 | 88.9 | 94.4 | 94.4 | 94.4 | 55.6 | 11.1 | 33.3 |
Values above 0.1 kUA/L were regarded as positive.
Table E4. Percentage of CD63+ basophils in blood of patients allergic to fish after stimulation with 100 ng/mL parvalbumins.
| Patient no. | Cod | Carp | Salmon β | Salmon α | Ray | Shark |
|---|---|---|---|---|---|---|
| P1 | 46.8 | 62.5 | 70.4 | ND | 0.1 | 0.1 |
| P2 | 0.4 | 0.1 | 2.1 | ND | 0.1 | 0.1 |
| P3 | 22.0 | 17.0 | 6.0 | 0.6 | 0.2 | 1.0 |
| P4 | 27.7 | 17.2 | 5.0 | 2.2 | 2.0 | 5.8 |
| P5 | 4.7 | 4.7 | 21.6 | 2.4 | 4.0 | 1.6 |
| P6 | 0.8 | 0.6 | 2.6 | ND | 0.6 | 0.2 |
| P7 | 4.6 | 6.4 | 15.3 | ND | 0.6 | 1.2 |
| P8 | 77.7 | 88.5 | 87.4 | ND | 0.2 | 0.2 |
| P9 | 13.6 | 10.8 | 15.5 | ND | 1.0 | 1.6 |
| P10 | 70.7 | 56.5 | 85.1 | ND | 0.4 | 0.4 |
| P11 | 0.2 | 0.2 | 0.2 | 0.1 | 0.2 | 0.4 |
| P12 | 50.0 | 42.0 | 51.0 | 6.0 | 20.0 | 18.0 |
| P13 | 16.8 | 20.0 | 19.1 | 1.2 | 0.8 | 1.2 |
| P14 | 15.5 | 9.8 | 7.6 | 1.6 | 1.4 | 2.4 |
| P15 | 1.2 | 0.4 | 1.2 | 1.0 | 1.2 | 0.4 |
| P16 | 9.6 | 5.0 | 1.6 | 0.8 | 0.6 | 0.6 |
| P17 | 85.6 | 62.8 | 62.4 | 1.2 | 1.7 | 1.1 |
| P18 | 55.4 | 49.8 | 65.4 | 35.8 | 26.1 | 31.2 |
| Average | 28.0 | 25.2 | 28.9 | 4.8 | 3.4 | 3.7 |
| Median | 16.2 | 13.9 | 15.4 | 1.2 | 0.7 | 1.1 |
| Positive patients (%) | 61.1 | 55.6 | 55.6 | 9.1 | 5.6 | 5.6 |
ND, Not determined.
Table E5. Comparison (Friedman test with Dunn posttest) of basophil response to stimulation with 100 ng/mL parvalbumins*.
Table E6. SPT with purified parvalbumins*.
| Parvalbumin | μg/mL | P1 | P2 | P3 | P4 | P5 | P6 | P7 | P8 | P9 | P10 | P11 | P12 | P13 | P14 | P15 | P16 | P17 | P18 |
|---|---|---|---|---|---|---|---|---|---|---|---|---|---|---|---|---|---|---|---|
| Cod | 0.1 | 3 | 0 | 0 | 0 | 1 | 0 | 0 | 3 | 4 | ND | 0 | 2 | 0 | 4 | 0 | 6 | 1 | ND |
| 1 | 3 | 0 | 0 | 1 | 2 | 0 | 2 | ND | ND | ND | 0 | 5 | 2 | ND | 2 | ND | 7 | ND | |
| 10 | ND | 0 | 7 | 4 | 2 | 2 | 2 | ND | ND | ND | 2 | ND | 3 | ND | 2 | ND | ND | ND | |
| 50 | ND | 0 | ND | ND | 4 | 3 | 7 | ND | ND | ND | 4 | ND | ND | ND | 7 | ND | ND | ND | |
| Carp | 0.1 | 3 | ND | 0 | ND | 1 | 0 | 0 | 4 | 3 | ND | ND | 2 | ND | ND | 0 | ND | ND | ND |
| 1 | 7 | ND | 0 | ND | 2 | 0 | 1 | ND | ND | ND | ND | 3 | ND | ND | 0 | ND | ND | ND | |
| 10 | ND | ND | 2 | ND | ND | 0 | 5 | ND | ND | ND | ND | ND | ND | ND | 0 | ND | ND | ND | |
| 50 | ND | ND | 11 | ND | ND | 3 | ND | ND | ND | ND | ND | ND | ND | ND | 0 | ND | ND | ND | |
| Salmon β | 0.1 | 3 | ND | 0 | ND | 1 | 0 | 2 | 3 | 5 | ND | ND | 3 | ND | ND | 0 | ND | ND | ND |
| 1 | 10 | ND | 0 | 1 | 1 | 2 | 3 | ND | ND | ND | ND | ND | ND | ND | 0 | ND | ND | ND | |
| 10 | ND | ND | 2 | 2 | 4 | 6 | ND | ND | ND | ND | ND | ND | ND | ND | 0 | ND | ND | ND | |
| 50 | ND | ND | 7 | 2 | ND | ND | ND | ND | ND | ND | ND | ND | ND | ND | 0 | ND | ND | ND | |
| Ray | 0.1 | 0 | 0 | 0 | 0 | 0 | ND | ND | 0 | 1 | ND | 0 | 0 | 0 | 0 | 0 | 2 | 0 | ND |
| 1 | 2 | 0 | 0 | 0 | 0 | ND | ND | 0 | 1 | ND | 0 | 0 | 0 | 0 | 0 | 0 | 0 | ND | |
| 10 | 1 | 0 | 0 | 0 | 0 | 1 | 0 | 1 | 0 | ND | 0 | 0 | 0 | 2 | 0 | 0 | 0 | ND | |
| 50 | 3 | 0 | 0 | 1 | 0 | 0 | 0 | 3 | 3 | ND | 0 | 0 | 0 | 2 | 0 | 0 | 2 | ND | |
| Shark | 0.1 | 0 | 0 | 0 | 0 | 0 | ND | ND | 0 | 0 | ND | 0 | 0 | 0 | 0 | 0 | 0 | 0 | ND |
| 1 | 0 | 0 | 0 | 0 | 0 | ND | ND | 0 | 0 | ND | 0 | 0 | 0 | 0 | 0 | 0 | 0 | ND | |
| 10 | 0 | 0 | 0 | 0 | 0 | 1 | 0 | 2 | 1 | ND | 2 | 0 | 0 | 1 | 0 | 0 | 0 | ND | |
| 50 | 1 | 0 | 1 | 1 | 0 | 2 | 0 | 1 | 3 | ND | ND | 2 | 0 | 3 | 0 | 0 | 3 | ND |
ND, Not determined.
Numbers indicate average wheal diameter (mm).
Table E7. Spearman correlation test for the amount of parvalbumin-specific IgE (ELISA) and the percentage of activated basophils with 100 ng/mL parvalbumins (BAT)*.
| Parvalbumin | Spearman r | Corrected P value |
|---|---|---|
| Cod | 0.5974 | 0.0516 |
| Carp | 0.5266 | 0.1398 |
| Salmon β | 0.5658 | 0.0833 |
| Salmon α | 0.2378 | 0.9791 |
| Ray | 0.4367 | 0.3530 |
| Shark | 0.0012 | 1 |
P values listed in the table were obtained using the Bonferroni correction for multiple comparisons (Pcorrected – 1 (1 – Puncorrected),6 where 6 is the number of independent comparisons.
What is already known about this topic?
Patients allergic to fish are generally advised to avoid all types of fish. Most of these patients are sensitized to bony fish and their major allergen parvalbumin. The allergenicity of cartilaginous fish, a potential dietary alternative, is not well understood.
What does this article add to our knowledge?
We demonstrated tolerance of ray, a cartilaginous fish, by patients with allergy to bony fish. Furthermore, ray parvalbumin showed lower allergenicity than did the parvalbumins from bony fish.
How does this study impact current management guidelines?
Current diagnosis of fish allergy focuses on bony fish. Inclusion of cartilaginous fish and their parvalbumins in routine diagnosis of fish allergy may prevent unnecessary food restrictions.
Acknowledgment
We thank Tanja Scheuermann and Thorsten Graf for technical support, as well as Chiara Palladino and Sandip D. Kamath for fruitful discussions and help with manuscript editing.
Funding for this research was provided by the Austrian Science Fund (FWF) grant W1248-B30 (T.K., H.B.), the European Cooperation in Science and Technology (COST) Action FA1402 ImpARAS (T.K.), the Ministry of Higher Education and Research, Luxembourg (A.K.), the Luxembourg National Research Fund's Research Intensive Doctoral Education (FNR-PRIDE) grants 11012546/NEX-TIMMUNE (A.K., M.O.), the National Health and Medical Research Council grant APP1086656 (A.L.L.), and a scholarship of the Centre for Food and Allergy Research, Australia (T.R.).
Abbreviations used
- BAT
basophil activation test
- PPT
prick-to-prick test
- SPT
skin prick test
Footnotes
Conflicts of interest: The authors declare that they have no relevant conflicts of interest.
References
- 1.Matricardi PM, Kleine-Tebbe J, Hoffmann HJ, Valenta R, Hilger C, Hofmaier S, et al. EAACI Molecular Allergology User’s Guide. Pediatr Allergy Immunol. 2016;27:1–250. doi: 10.1111/pai.12563. [DOI] [PubMed] [Google Scholar]
- 2.Sharp MF, Lopata AL. Fish allergy: in review. Clin Rev Allergy Immunol. 2014;46:258–71. doi: 10.1007/s12016-013-8363-1. [DOI] [PubMed] [Google Scholar]
- 3.Inoue JG, Miya M, Lam K, Tay BH, Danks JA, Bell J, et al. Evolutionary origin and phylogeny of the modern holocephalans (Chondrichthyes: Chimaer-iformes): a mitogenomic perspective. Mol Biol Evol. 2010;27:2576–86. doi: 10.1093/molbev/msq147. [DOI] [PubMed] [Google Scholar]
- 4.Stephen JN, Sharp MF, Ruethers T, Taki A, Campbell DE, Lopata AL. Allergenicity of bony and cartilaginous fish—molecular and immunological properties. Clin Exp Allergy. 2017;47:300–12. doi: 10.1111/cea.12892. [DOI] [PubMed] [Google Scholar]
- 5.Calderon-Rodriguez S, Pineda F, Perez R, Munoz C. Tolerability to dogfish in children with fish allergy. Allergol Immunopathol (Madr) 2016;44:167–9. doi: 10.1016/j.aller.2015.05.007. [DOI] [PubMed] [Google Scholar]
- 6.San-Juan S, Garces M, Caballero ML, Monzon S, Moneo I. Occupational asthma caused by shark cartilage dust. J Allergy Clin Immunol. 2004;114:1227–8. doi: 10.1016/j.jaci.2004.07.057. [DOI] [PubMed] [Google Scholar]
- 7.Koyama H, Kakami M, Kawamura M, Tokuda R, Kondo Y, Tsuge I, et al. Grades of 43 fish species in Japan based on IgE-binding activity. Allergol Int. 2006;55:311–6. doi: 10.2332/allergolint.55.311. [DOI] [PubMed] [Google Scholar]
- 8.Seitz CS, Brocker EB, Trautmann A. Occupational allergy due to seafood delivery: case report. J Occup Med Toxicol. 2008;3:11. doi: 10.1186/1745-6673-3-11. [DOI] [PMC free article] [PubMed] [Google Scholar]
- 9.Moonesinghe H, Mackenzie H, Venter C, Kilburn S, Turner P, Weir K, et al. Prevalence of fish and shellfish allergy: a systematic review. Ann Allergy Asthma Immunol. 2016;117:264–272.e4. doi: 10.1016/j.anai.2016.07.015. [DOI] [PubMed] [Google Scholar]
- 10.Jeebhay MF, Lopata AL. Occupational allergies in seafood-processing workers. Adv Food Nutr Res. 2012;66:47–73. doi: 10.1016/B978-0-12-394597-6.00002-1. [DOI] [PubMed] [Google Scholar]
- 11.Jeebhay M, Robins T, Lehrer S, Lopata A. Occupational seafood allergy: a review. Occup Environ Med. 2001;58:553–62. doi: 10.1136/oem.58.9.553. [DOI] [PMC free article] [PubMed] [Google Scholar]
- 12.Needham S, Funge-Smith S. The consumption of fish and fish products in the Asia-Pacific region based on household surveys. Bangkok: FAO Regional Office for Asia and the Pacific; 2014. pp. 5–12. [Google Scholar]
- 13.European Market Observatory for Fisheries and Aquaculture Products—The EU fish market. Brussels: European Commission, Directorate-General for Maritime Affairs and Fisheries; 2017. pp. 5–25. [Google Scholar]
- 14.Worm B, Davis B, Kettemer L, Ward-Paige CA, Chapman D, Heithaus MR, et al. Global catches, exploitation rates, and rebuilding options for sharks. Marine Policy. 2013;40:194–204. [Google Scholar]
- 15.Dent F, Clarke S. State of global market for shark products. Rome: Food and Agriculture Organization of the United Nations; 2015. pp. 92–161. [Google Scholar]
- 16.Ruethers T, Taki AC, Johnston EB, Nugraha R, Le TTK, Kalic T, et al. Seafood allergy: a comprehensive review of fish and shellfish allergens. Mol Immunol. 2018;100:28–57. doi: 10.1016/j.molimm.2018.04.008. [DOI] [PubMed] [Google Scholar]
- 17.Schulkes KJ, Klemans RJ, Knigge L, de Bruin-Weller M, Bruijnzeel-Koomen CA, Marknell deWitt A, et al. Specific IgE to fish extracts does not predict allergy to specific species within an adult fish allergic population. Clin Transl Allergy. 2014;4:27. doi: 10.1186/2045-7022-4-27. [DOI] [PMC free article] [PubMed] [Google Scholar]
- 18.Sorensen M, Kuehn A, Mills ENC, Costello CA, Ollert M, Smabrekke L, et al. Cross-reactivity in fish allergy: a double-blind, placebo-controlled food-challenge trial. J Allergy Clin Immunol. 2017;140:1170–2. doi: 10.1016/j.jaci.2017.03.043. [DOI] [PubMed] [Google Scholar]
- 19.Flokstra-de Blok BM, van der Velde JL, Vlieg-Boerstra BJ, Oude Elberink JN, DunnGalvin A, Hourihane JO, et al. Health-related quality of life of food allergic patients measured with generic and disease-specific questionnaires. Allergy. 2010;65:1031–8. doi: 10.1111/j.1398-9995.2009.02304.x. [DOI] [PubMed] [Google Scholar]
- 20.Bugajska-Schretter A, Grote M, Vangelista L, Valent P, Sperr WR, Rumpold H, et al. Purification, biochemical, and immunological characterisation of a major food allergen: different immunoglobulin E recognition of the apo- and calcium-bound forms of carp parvalbumin. Gut. 2000;46:661–9. doi: 10.1136/gut.46.5.661. [DOI] [PMC free article] [PubMed] [Google Scholar]
- 21.Arif SH. A Ca(2+)-binding protein with numerous roles and uses: parvalbumin in molecular biology and physiology. Bioessays. 2009;31:410–21. doi: 10.1002/bies.200800170. [DOI] [PubMed] [Google Scholar]
- 22.Kobayashi A, Tanaka H, Hamada Y, Ishizaki S, Nagashima Y, Shiomi K. Comparison of allergenicity and allergens between fish white and dark muscles. Allergy. 2006;61:357–63. doi: 10.1111/j.1398-9995.2006.00966.x. [DOI] [PubMed] [Google Scholar]
- 23.Kuehn A, Hilger C, Lehners-Weber C, Codreanu-Morel F, Morisset M, Metz-Favre C, et al. Identification of enolases and aldolases as important fish allergens in cod, salmon and tuna: component resolved diagnosis using parvalbumin and the new allergens. Clin Exp Allergy. 2013;43:811–22. doi: 10.1111/cea.12117. [DOI] [PubMed] [Google Scholar]
- 24.Kuehn A, Swoboda I, Arumugam K, Hilger C, Hentges F. Fish allergens at a glance: variable allergenicity of parvalbumins, the major fish allergens. Front Immunol. 2014;5:179. doi: 10.3389/fimmu.2014.00179. [DOI] [PMC free article] [PubMed] [Google Scholar]
- 25.Cai QF, Liu GM, Li T, Hara K, Wang XC, Su WJ, et al. Purification and characterization of parvalbumins, the major allergens in red stingray (Dasyatis akajei) J Agric Food Chem. 2010;58:12964–9. doi: 10.1021/jf103316h. [DOI] [PubMed] [Google Scholar]
- 26.Sampson HA, Gerth van Wijk R, Bindslev-Jensen C, Sicherer S, Teuber SS, Burks AW, et al. Standardizing double-blind, placebo-controlled oral food challenges: American Academy of Allergy, Asthma & Immunology-European Academy of Allergy and Clinical Immunology PRACTALL consensus report. J Allergy Clin Immunol. 2012;130:1260–74. doi: 10.1016/j.jaci.2012.10.017. [DOI] [PubMed] [Google Scholar]
- 27.Kobayashi Y, Huge J, Imamura S, Hamada-Sato N. Study of the cross-reactivity of fish allergens based on a questionnaire and blood testing. Allergol Int. 2016;65:272–9. doi: 10.1016/j.alit.2016.01.002. [DOI] [PubMed] [Google Scholar]
- 28.Ng IE, Turner PJ, Kemp AS, Campbell DE. Parental perceptions and dietary adherence in children with seafood allergy. Pediatr Allergy Immunol. 2011;22:720–8. doi: 10.1111/j.1399-3038.2011.01189.x. [DOI] [PubMed] [Google Scholar]
- 29.Kobayashi A, Kobayashi Y, Shiomi K. Fish allergy in patients with parvalbumin-specific immunoglobulin E depends on parvalbumin content rather than molecular differences in the protein among fish species. Biosci Biotechnol Biochem. 2016;80:2018–21. doi: 10.1080/09168451.2016.1189318. [DOI] [PubMed] [Google Scholar]
- 30.Kuehn A, Lehners C, Hilger C, Hentges F. Food allergy to chicken meat with IgE reactivity to muscle alpha-parvalbumin. Allergy. 2009;64:1557–8. doi: 10.1111/j.1398-9995.2009.02094.x. [DOI] [PubMed] [Google Scholar]
- 31.Hilger C, Thill L, Grigioni F, Lehners C, Falagiani P, Ferrara A, et al. IgE antibodies of fish allergic patients cross-react with frog parvalbumin. Allergy. 2004;59:653–60. doi: 10.1111/j.1398-9995.2004.00436.x. [DOI] [PubMed] [Google Scholar]
- 32.Ruethers T, Raith M, Sharp MF, Koeberl M, Stephen JN, Nugraha R, et al. Characterisation of Ras k 1 a novel major allergen in Indian mackerel and identification of parvalbumin as the major fish allergen in 33 Asia-Pacific fish species. Clin Exp Allergy. 2018;48:452–63. doi: 10.1111/cea.13069. [DOI] [PubMed] [Google Scholar]
- 33.Sharp MF, Stephen JN, Kraft L, Weiss T, Kamath SD, Lopata AL. Immunological cross-reactivity between four distant parvalbumins—impact on allergen detection and diagnostics. Mol Immunol. 2015;63:437–48. doi: 10.1016/j.molimm.2014.09.019. [DOI] [PubMed] [Google Scholar]
- 34.Kobayashi Y, Kuriyama T, Nakagawara R, Aihara M, Hamada-Sato N. Allergy to fish collagen: thermostability of collagen and IgE reactivity of patients’ sera with extracts of 11 species of bony and cartilaginous fish. Allergol Int. 2016;65:450–8. doi: 10.1016/j.alit.2016.04.012. [DOI] [PubMed] [Google Scholar]
- 35.Santos AF, Shreffler WG. Road map for the clinical application of the basophil activation test in food allergy. Clin Exp Allergy. 2017;47:1115–24. doi: 10.1111/cea.12964. [DOI] [PMC free article] [PubMed] [Google Scholar]
- 36.Kuehn A, Codreanu-Morel F, Lehners-Weber C, Doyen V, Gomez-Andre SA, Bienvenu F, et al. Cross-reactivity to fish and chicken meat—a new clinical syndrome. Allergy. 2016;71:1772–81. doi: 10.1111/all.12968. [DOI] [PubMed] [Google Scholar]
- 37.Uehara K, Takahashi A, Watanabe M, Nomura Y. Shark protein improves bone mineral density in ovariectomized rats and inhibits osteoclast differentiation. Nutrition. 2014;30:719–25. doi: 10.1016/j.nut.2013.11.005. [DOI] [PubMed] [Google Scholar]
- 38.Turan H, Sonmez G, Kaya Y. Fatty acid profile and proximate composition of the thornback ray (Raja clavata, L. 1758) from the Sinop coast in the Black Sea. J Fish Sci. 2007;1:97–103. [Google Scholar]
References
- E1.Griesmeier U, Vazquez-Cortes S, Bublin M, Radauer C, Ma Y, Briza P, et al. Expression levels of parvalbumins determine allergenicity of fish species. Allergy. 2010;65:191–8. doi: 10.1111/j.1398-9995.2009.02162.x. [DOI] [PubMed] [Google Scholar]
- E2.Kuehn A, Hilger C, Lehners-Weber C, Codreanu-Morel F, Morisset M, Metz-Favre C, et al. Identification of enolases and aldolases as important fish allergens in cod, salmon and tuna: component resolved diagnosis using parvalbumin and the new allergens. Clin Exp Allergy. 2013;43:811–22. doi: 10.1111/cea.12117. [DOI] [PubMed] [Google Scholar]
- E3.Ruethers T, Raith M, Sharp MF, Koeberl M, Stephen JN, Nugraha R, et al. Characterization of Ras k 1 a novel major allergen in Indian mackerel and identification of parvalbumin as the major fish allergen in 33 Asia-Pacific fish species. Clin Exp Allergy. 2018;48:452–63. doi: 10.1111/cea.13069. [DOI] [PubMed] [Google Scholar]
- E4.Kuehn A, Lehners C, Hilger C, Hentges F. Food allergy to chicken meat with IgE reactivity to muscle alpha-parvalbumin. Allergy. 2009;64:1557–8. doi: 10.1111/j.1398-9995.2009.02094.x. [DOI] [PubMed] [Google Scholar]
- E5.Kuehn A, Codreanu-Morel F, Lehners-Weber C, Doyen V, Gomez-Andre SA, Bienvenu F, et al. Cross-reactivity to fish and chicken meat—a new clinical syndrome. Allergy. 2016;71:1772–81. doi: 10.1111/all.12968. [DOI] [PubMed] [Google Scholar]


