

SUMMARY
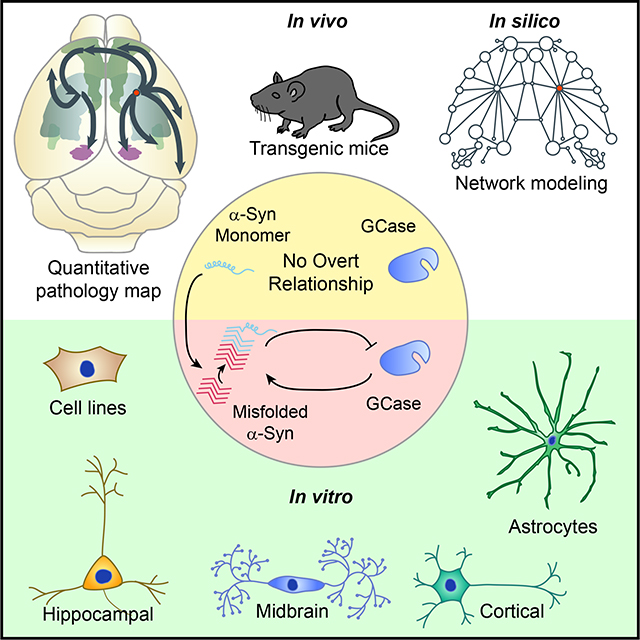
Mutations in the GBA1 gene are the most common genetic risk factor for Parkinson’s Disease (PD) and dementia with Lewy bodies (DLB). GBA1 encodes the lysosomal lipid hydrolase glucocerebrosidase (GCase), and its activity has been linked to accumulation of α-synuclein. The current study systematically examines the relationship between GCase activity and both pathogenic and non-pathogenic forms of α-synuclein in primary hippocampal, cortical, and midbrain neuron and astrocyte cultures, as well as in transgenic mice and a non-transgenic mouse model of PD. We find that reduced GCase activity does not result in aggregation of α-synuclein. However, in the context of extant misfolded α-synuclein, GCase activity modulates neuronal susceptibility to pathology. Further, this modulation is not dependent on neuron type, but rather is driven by the level of pathological α-synuclein seeds. This study has implications for understanding how GBA1 mutations influence PD pathogenesis and provides a platform for testing novel therapeutics.
Keywords: GBA1, GCase, glucosylceramide, glucosylsphingosine, Parkinson’s disease, Lewy body, neurodegenerative disease, transmission, network model, misfolding, vulnerability, D409V
eTOC Blurb
Henderson et al. use cell and animal models of Parkinson’s disease to show that reducing glucocerebrosidase activity leads to an enhancement of pre-existing α-synuclein pathology that is not dependent on neuron type, reconciling experimental biology with human epidemiology.
Graphical Abstract
INTRODUCTION
Parkinson’s disease (PD) and dementia with Lewy bodies (DLB) comprise two points on a spectrum of movement and cognitive disorders characterized by accumulation of misfolded α-synuclein inside neurons throughout the brain (Baba et al., 1998; Spillantini et al., 1998; Spillantini et al., 1997). While symptomology in these two diseases is initially divergent, up to 80 percent of PD patients will also experience cognitive decline during the disease course (Aarsland et al., 2003) and progression to cognitive decline is associated with the presence of α-synuclein Lewy bodies (LBs) in cortical brain regions (Beach et al., 2009; Braak et al., 2002; Braak et al., 2003). Mutations in (Appel-Cresswell et al., 2013; Kiely et al., 2013; Kruger et al., 1998; Pasanen et al., 2014; Polymeropoulos et al., 1997; Proukakis et al., 2013; Zarranz et al., 2004), duplications of (Chartier-Harlin et al., 2004; Ibanez et al., 2004), and triplications of (Singleton et al., 2003) the SNCA gene encoding α-synuclein also cause PD, suggesting that α-synuclein is a major factor in the etiology of PD. However, familial mutations are rare in PD, which is largely a sporadic disease.
Variants of the GBA1 gene encoding glucocerebrosidase (GCase) occur more often than SNCA mutations in PD and DLB (Nalls et al., 2013), with 2.3–9.4% of patients carrying a mutation in GBA1 (Aflaki et al., 2017; Sidransky et al., 2009). Mutations in GBA1 are mostly thought to lead to loss of function of lysosomal GCase and accumulation of lipid substrates glucosylceramide and glucosylsphingosine. However, the penetrance of GBA1 mutations is low, with only 9–12% of individuals who have a mutation in GBA1 going on to develop PD (Rosenbloom et al., 2011), suggesting that GBA1 mutations are acting as modulators of α-synucleinopathy risk. How GBA1 mutations confer elevated risk to developing α-synucleinopathies is not clear.
Early studies suggested that mutant GCase can lead to elevated levels of α-synuclein which reciprocally inhibits GCase activity leading to amplification of the pathogenic process (reviewed by (Aflaki et al., 2017)). However, while GCase activity is reduced in certain brain regions of PD patients with and without GBA1 mutations (Chiasserini et al., 2015; Gegg et al., 2012; Murphy et al., 2014; Rocha et al., 2015a), there is no apparent GCase lipid substrate accumulation in PD (Gegg et al., 2015). More recently, it has been demonstrated that reduced GCase activity can lead to accumulation of specific forms of α-synuclein—namely higher molecular weight species (Kim et al., 2018; Zunke et al., 2018). Still, the majority of GBA1 mutation carriers do not accumulate pathogenic α-synuclein or develop PD, suggesting that GCase activity is modulating an extant disease susceptibility, not inducing pathology.
In the current study, we directly investigate the relationship of GCase activity to non-pathogenic and pathogenic α-synuclein. We use primary hippocampal, cortical, and dopaminergic neurons, primary astrocytes, human embryonic kidney cells, transgenic and non-transgenic PD model mice, and an in silico model of pathological protein spread to conduct comprehensive studies investigating the relationship between GCase activity, α-synuclein, and PD pathogenesis. We find that GCase inhibition does not induce elevated total α-synuclein or the formation of pathological α-synuclein in primary neurons or in mice. Nor do α-synuclein levels correlate with GCase activity. However, pathogenic forms of α-synuclein can induce a time-dependent reduction in GCase activity. While reducing GCase activity does not itself induce α-synuclein pathology, small amounts of α-synuclein pathology can be dramatically amplified in the context of low GCase activity. This effect is abrogated in the presence of high α-synuclein pathological load. Broadly, our study suggests that GCase activity is not inducing α-synuclein pathology but rather amplifying an extant disease process, in agreement with epidemiological data (Nalls et al., 2013; Sidransky et al., 2009).
RESULTS
GCase Inhibition Does Not Induce De Novo α-Synuclein Accumulation in Primary Neurons
In this study, we sought to specifically address the relationship between GCase activity and α-synuclein using the potent and selective small molecule GCase inhibitor conduritol-β-epoxide (CBE) (Dermentzaki et al., 2013; Kanfer et al., 1975; Kuo et al., 2019; Rocha et al., 2015b; Rockenstein et al., 2016; Zunke et al., 2018). CBE shows dose-dependent inhibition of GCase activity in both primary neurons (Figure 1A) and human embryonic kidney (HEK293) cells (Figure S1A) after a single treatment. This inhibition induces a slight elevation in total GCase levels (Figure 1B, 1C).
Figure 1. GCase Inhibition Does Not Induce De Novo α-Synuclein Accumulation in Primary Neurons.

(A) Primary hippocampal neurons treated with CBE were lysed to determine GCase activity at 21 DIV. The plotted line is a non-linear fit of values with an estimated IC50 of 15.8 nM (n=3/group). (B) Parallel samples were assayed for total GCase and GAPDH protein levels. (C) Quantification of GCase levels with CBE treatment compared to vehicle treatment (one-way ANOVA with Dunnett’s multiple comparison test, n=3/group). (D) Primary hippocampal neurons treated with vehicle or CBE and either DPBS or 2.5 μg/mL α-synuclein PFFs were extracted with sequentially stronger detergents to allow the separation of soluble proteins from insoluble pathological proteins. Quantification of α-synuclein (E), pS129 α-synuclein (F) and GCase (G) normalized to GAPDH levels as a loading control and then to TX-100-soluble PBS-treated values confirms this observation. All sequential extraction values were compared by two-way ANOVA followed by Sidak’s multiple comparison tests. (G)**p=0.0022, (H)*p=0.0167, n=4–5/group. Data are represented as mean ± SEM.
To examine whether GCase inhibition induces changes in α-synuclein levels, HEK293 cells stably overexpressing α-synuclein (Clone 10)(Luk et al., 2009) were treated with ascending doses of CBE (Figure S1B). We observed no change in α-synuclein levels at any dose (Figure S1C), suggesting that GCase inhibition does not elevate α-synuclein in a non-specific manner. To determine if GCase inhibition alters α-synuclein levels or solubility, primary hippocampal neurons were treated with vehicle or CBE for 16 days. As a positive control for aggregation, α-synuclein pre-formed fibrils (PFFs) were added to parallel cultures. α-Synuclein PFFs induce misfolding of endogenous α-synuclein into 1% TX-100-insoluble and pathologically phosphorylated (pS129) forms. By Ponceau S stain, CBE treatment seems to induce a general elevation of proteins in the 1% TX-100-insoluble fraction (Figure 1D). However, there is no elevation of soluble α-synuclein with CBE treatment and no α-synuclein present in the insoluble fraction without the addition of α-synuclein PFFs (Figure 1D, 1E). With α-synuclein PFF treatment, α-synuclein shifts into the insoluble fraction and pathological pS129 α-synuclein appears (Figure 1D, 1F).
GCase Activity Does Not Correlate with Total α-Synuclein Load but Can Be Reduced by Pathogenic α-Synuclein
To understand whether α-synuclein can influence GCase activity, we first compared HEK293 cells without α-synuclein expression to HEK293 cells stably overexpressing α-synuclein (Figure S2). Α-Synuclein expression has no effect on GCase activity in this context. Next, we compared four lines of mice with various levels of α-synuclein expression. Mice lacking the α-synuclein gene (Snca KO) were bred to mice overexpressing human wildtype α-synuclein or human Ala53Thr (A53T) α-synuclein to produce mice lacking endogenous α-synuclein but overexpressing wildtype (M7KO) or A53T (M83KO) human α-synuclein (Figure 2A). α-Synuclein expression and GCase activity from the brains of these three mouse lines were compared to non-transgenic mice. Snca KO mice lack α-synuclein, while M83KO and M7KO mice express approximately twice the endogenous level of α-synuclein (Figure 2B, 2C). Despite the different expression of α-synuclein in these mice, GCase protein levels (Figure 2D) and activity (Figure 2E) remained unchanged.
Figure 2. GCase Activity Does Not Correlate with Total α-Synuclein Load but Can Be Reduced by Pathogenic α-Synuclein.

(A) Schematic of mouse lines used for this study. (B) Immunoblotting of brain lysates from the four described mouse lines. (C) Quantification of α-synuclein protein level shows that Snca KO mice lack α-synuclein (**p=0.0012), and M83KO (***p=0.0003) and M7KO (***p=0.0008) mice have approximately two-fold the expression of wildtype mice (one-way ANOVA, Dunnett’s multiple comparison tests, n=4–7/group). (D) Quantification of GCase protein levels (all non-significant by one-way ANOVA, Dunnett’s multiple comparison tests, n=4–7/group). (E) Normalized α-synuclein protein levels (x-axis) were compared to normalized GCase activity (y-axis) for individual mice (gray line represents a linear regression best-fit line with the 95% confidence interval in light gray, slope=0.0414, p=0.0405, R2 = 0.185, n=23). (F) Primary hippocampal neurons treated with 2.5 μg/mL α-synuclein monomer at 7 DIV and lysate was harvested 14 days post-treatment (DPT). GCase activity was unchanged, as were GCase protein levels (G), (H), and GCase specific activity (I) (all non-significant by unpaired t-tests, n=3/group). In contrast, 2.5 μg/mL α-synuclein PFF treatment of neuron cultures for the same time period resulted in a time-dependent reduction in GCase activity (J), no change in protein levels (K), (L) and therefore a reduction in GCase specific activity (M). One-way ANOVA with Dunnett’s multiple comparison tests, (I)*p=0.0317, all other p>0.05, n=3/group. Data are represented as mean ± SEM, except where individual values are plotted in panel (E).
α-Synuclein added to the media of neurons is taken up and processed through the endo-lysosomal pathway, where it may persist for weeks (Karpowicz et al., 2017). In order to further investigate the acute effect of excess α-synuclein in the lysosome of primary neurons, recombinant α-synuclein monomer or PFFs were added to the media of primary hippocampal neurons and allowed them to incubate up to 14 days. The addition of α-synuclein monomer to primary hippocampal neurons does not change GCase activity (Figure 2F), protein levels (Figure 2G, 2H), or GCase specific activity (Figure 2I). The addition of α-synuclein PFFs, however, leads to a time-dependent reduction in GCase activity (Figure 2J) without inducing any change in GCase protein levels (Figure 2K, 2L), suggesting a change in specific activity (Figure 2M).
GCase Inhibition Differentially Modulates α-Synuclein Pathology in Primary Hippocampal, Cortical, and Midbrain Neurons
While GCase inhibition does not cause de novo α-synuclein aggregation in primary neurons, there has been little investigation of whether GCase plays a role in modulating existing α-synuclein pathogenesis. LB-like inclusions induced in HEK cells or primary neurons by α-synuclein PFFs accrete pS129 α-synuclein, ubiquitin, p62 (Luk et al., 2009; Tanik et al., 2013; Volpicelli-Daley et al., 2011), and other proteins (Henderson et al., 2017) characteristic of human LBs. We first assayed whether increasing concentrations of CBE would alter the α-synuclein pathology in HEK293 cells (Figure S3A). CBE alone does not induce any pS129 α-synuclein inclusions in these cells despite α-synuclein expression. However, CBE causes a dose-dependent increase in the pathological burden of LB-like inclusions initiated by α-synuclein PFFs (Figure S3B).
Primary hippocampal neurons were treated with CBE at 5 days in vitro (DIV) and α-synuclein PFFs at 7 DIV. Two weeks following treatment, CBE addition alone did not induce pS129 α-synuclein pathology (Figures 3A, 3B). CBE also did not change the total pS129 α-synuclein burden induced by α-synuclein PFFs. CBE did, however, cause an increase in the number of LB-like cell body inclusions (Figure S3C) while not changing the overall neuritic pathology (Figure S3D). CBE also induced mild toxicity in hippocampal neurons at higher concentrations as indicated by reductions in MAP2 (a somatodendritic marker, Figure 3C) and NeuN (a neuronal nuclei marker, Figure 3D).
Figure 3. GCase Inhibition Differentially Modulates α-Synuclein Pathology in Primary Hippocampal, Cortical and Midbrain Neurons.

(A) Primary hippocampal neurons treated with CBE with or without the addition of 1 μg/mL α-synuclein PFFs for 14 days and stained for pathological pS129 α-synuclein (magenta), MAP2 (gray) and NeuN (gray). (B) Quantification of pS129 α-synuclein area/MAP2 area (one-way ANOVA with Dunnett’s multiple comparison tests comparing all conditions to α-synuclein PFF without CBE condition, PBS-0 μM CBE ****p<0.0001, PBS-200 μM CBE ****p<0.0001, all others p>0.05, n=15–18/group). (C) MAP2 area quantification (one-way ANOVA with Dunnett’s multiple comparison tests comparing all conditions to α-synuclein PFFs without CBE condition, PFF-200 μM CBE *p=0.0134, all others p>0.05, n=15–18/group). (D) NeuN number quantification (one-way ANOVA with Dunnett’s multiple comparison tests comparing all conditions to α-synuclein PFF without CBE condition, PBS-200 μM CBE **p=0.0055, PFF-100 μM CBE **p=0.0011, PFF-200 μM CBE ***p=0.0002, all others p>0.05, n=15–18/group). (E) Primary cortical neurons treated with CBE and 1 μg/mL α-synuclein PFFs and stained in the same manner as hippocampal neurons in panel (A). (F) Quantification of pS129 α-synuclein area/MAP2 area (one-way ANOVA with Dunnett’s multiple comparison tests comparing all conditions to α-synuclein PFF without CBE condition, PBS-0 μM CBE ****p<0.0001, PFF-1 μM CBE ***p=0.0002, PFF-10 μM CBE ***p=0.0005, PFF-100 μM CBE **p=0.0031, n=17–18/group). (G) MAP2 area quantification (one-way ANOVA with Dunnett’s multiple comparison tests comparing all conditions to α-synuclein PFF without CBE condition, PBS-0 μM CBE *p=0.0180, all others p>0.05, n=17–18/group). (H) Primary midbrain and striatal neurons were treated with 100 μM CBE and 1 μg/mL α-synuclein PFFs in the same manner as the hippocampal and cortical neurons, but were stained for TH (gray) to reveal dopaminergic neurons. (I) Quantification of pS129 α-synuclein area co-localized with TH/TH area (one-way ANOVA with Dunnett’s multiple comparison tests comparing all conditions to α-synuclein PFFs without CBE condition, PBS-0 μM CBE *p=0.0295, PFF-CBE ****p<0.0001, n=6/group). (J) Total TH area quantification (one-way ANOVA with Dunnett’s multiple comparison tests comparing all conditions to α-synuclein PFFs without CBE condition, all p>0.05, n=6/group). Scale bars = 50 μm. Data are represented as mean ± SEM.
To determine whether this lack of change in hippocampal neurons was due to neuron type, we also treated primary cortical neurons with combinations of CBE and α-synuclein PFFs (Figure 3E). Cortical neurons have substantially lower pathology at baseline, but CBE treatment elevated α-synuclein pathology by approximately 50% (Figure 3F) at all doses and showed a similar dose-dependent increase in cell body pathology (Figure S3E, S3F) as was seen in primary hippocampal neurons (Figure S3C). While α-synuclein PFFs reduced neuronal integrity (MAP2, Figure 3G), CBE did not kill cortical neurons (Figure S3G).
We also tested the effect of CBE and α-synuclein PFFs in vulnerable primary dopaminergic neurons derived from the ventral midbrain of mice and co-cultured with striatal neurons (Figure 3H). α-Synuclein pathology is also lower at baseline in these cultures, but was dramatically elevated with CBE treatment to approximately 4-fold of PBS-treated neurons (Figure 3I). This difference occurred in the absence of any effect on total tyrosine hydroxylase (TH, dopaminergic neurons) area (Figure 3J) or cell number (Figure S3H).
Astrocyte Co-Culture Reduces α-Synuclein Pathology in Hippocampal Neurons but Does Not Alter the Effect of GCase Inhibition
One reason neuron cultures could show differential vulnerability is that non-neuronal cells in the cultures are contributing to pathogenesis. To determine whether the ability of astrocytes to degrade exogenous α-synuclein is impaired by GCase inhibition primary mouse astrocytes were treated with α-synuclein PFFs and harvested 0 days (1 hour), 7 days, or 14 days after transduction. The astrocyte lysate was then sequentially extracted in 1% TX-100 and 2% SDS (Figure S4A). Astrocytes do not express α-synuclein, so there is no α-synuclein present in the absence of PFF treatment. Astrocytes degraded α-synuclein PFFs over time, but there was no difference between the degradation rate in astrocytes treated with CBE versus vehicle (Figure S4B).
To determine whether astrocytic GCase plays a role in the differential susceptibility of neuron subtypes to GCase-modulated pathology, hippocampal neurons were plated in the absence or presence of an astrocyte monolayer (Figure 4A, 4B). These cultures were then treated with α-synuclein PFFs in the presence of vehicle or CBE (Figure 4C, 4D). Astrocyte co-culture with hippocampal neurons reduced total α-synuclein pathology (Figure 4E), and more so cell body pathology (Figure 4F). Astrocytes also rescued MAP2 and NeuN loss (Figure 4G, 4H). However, CBE treatment does not change total α-synuclein pathology and results in a similar elevation of cell body inclusions (as in Figure S3C) when neurons are co-cultured with astrocytes, suggesting that astrocytes are neither abrogating nor exacerbating this effect.
Figure 4. Astrocyte Co-Culture Reduces α-Synuclein Pathology in Hippocampal Neurons but Does Not Alter the Effect of GCase Inhibition.

(A) Schematic of astrocyte co-culture experiments. (B) Primary hippocampal neurons cultured in the presence or absence of an astrocyte monolayer were stained for GFAP (astrocytic marker, magenta) and MAP2 (gray). (C) Primary hippocampal neuron cultures treated with vehicle or 100 μM CBE in addition to PBS or 1 μg/mL α-synuclein PFFs stained for pS129 α-synuclein (magenta), MAP2 (gray) and NeuN (gray) to allow quantification of pathology and neuronal toxicity. (D) The same batches of hippocampal neurons as in panel (C) were cultured on top of an astrocyte monolayer and stained as in panel (C). (E) Quantification of pathological pS129 α-synuclein area/MAP2 area (two-way ANOVA (Neuron versus neurons with astrocytes ***p=0.0001) with Dunnett’s multiple comparisons test comparing within culture to Vehicle-PFF: Hippocampal: Vehicle-PBS ****p<0.0001, CBE-PFF p=0.8245; Hipp+Astrocytes: Vehicle-PBS ****p<0.0001, CBE-PFF p=0.2399, n=11–12). (F) Quantification of pathological cell body pS129 α-synuclein area/MAP2 area reveals an overall effect of astrocyte co-culture and of CBE (two-way ANOVA (Neuron versus neurons with astrocytes ****p<0.0001) with Dunnett’s multiple comparisons test comparing within culture to Vehicle-PFF: Hippocampal: Vehicle-PBS ****p<0.0001, CBE-PFF ****p<0.0001; Hipp + Astrocytes: Vehicle-PBS ****p<0.0001, CBE-PFF ****p<0.0001, n=11–12). (G) Quantification of MAP2 area (two-way ANOVA (Neuron versus neurons with astrocytes *p=0.0119) with Dunnett’s multiple comparisons test comparing within culture to Vehicle-PFF: Hippocampal: Vehicle-PBS *p=0.0368, all others p>0.05, n=11–12). (H) Quantification NeuN number (two-way ANOVA (Neuron versus neurons with astrocytes ***p=0.0001) with Dunnett’s multiple comparisons test comparing within culture to Vehicle-PFF: Hippocampal: All p>0.05; Hipp + Astrocytes: Vehicle-PBS p=0.1195, CBE-PFF p=0.0016, n=11–12). Scale bars = 100 μm (B), 50 μm (C,D). Data are represented as mean ± SEM.
GCase Inhibition and α-Synuclein PFF Injection Cause Combinatorial Motor Weakness in the Absence of Dopaminergic Neuron Loss
A second possible reason for differences in neuron culture response to GCase inhibition is the intrinsic vulnerability of neurons. In order to assess brain-wide neuron vulnerability in the context of reduced GCase activity, we used in vivo analysis of the spread of α-synuclein pathology following the injection of α-synuclein PFFs. Injection of α-synuclein PFFs into non-transgenic mice results in a conserved spatiotemporal spread of α-synuclein pathology that follows neuroanatomical connectivity (Henderson et al., 2019; Luk et al., 2012). To induce GCase dysfunction, we used a highly-validated model of in vivo inhibition of GCase by treating mice with vehicle or 100 mg/kg CBE (Figure 5A). Prior to injection, all mice were assessed for baseline grip strength. Twenty-four mice were randomly assigned to vehicle or CBE groups and injected every other day for one month. Eight of these mice did not receive injection of α-synuclein PFFs, enabling the assessment of PFF-specific effects on animal behavior and pathology. The other 16 mice were injected with 5 μg α-synuclein PFFs in the dorsal striatum. Grip strength was assessed on the last day of vehicle/CBE injection and mice were assessed by histology and GCase activity assays.
Figure 5. GCase Inhibition and α-Synuclein Injection Cause Combinatorial Motor Weakness in the Absence of Dopaminergic Neuron Loss.

(A) Schematic of in vivo experiments testing the effect of GCase inhibition and/or α-synuclein PFF injection on motor dysfunction, neuropathology and neuron death. Mice in vehicle or CBE cohorts were further divided into cohorts injected in the dorsal striatum with α-synuclein PFFs or not injected and assayed for grip strength. (B) GCase activity in the liver was reduced with CBE treatment (unpaired t test, p=0.0001, n=12/group). (C) GCase activity was also reduced in the spinal cord following CBE treatment (unpaired t-test, p=0.0030, n=12/group). (D) Schematic for how the grip strength assay was performed. (E) Quantification of grip strength (normalized to mouse weight). Initial grip strength is compared to grip strength after 30 days by a paired t-test for each group of mice. Mice with both α-synuclein PFF and CBE injections have a significant reduction in grip strength (*p=0.0131, n=4=8/group). (F) Ventral midbrain image of mice treated with vehicle or CBE and stained with TH to reveal monoaminergic neurons (scale bar = 0.5 mm). (G) Quantification of TH-positive neurons within the substantia nigra in mice injected with α-synuclein PFFs (two-way ANOVA followed by Sidak’s multiple comparison test, All p>0.05, n=8/group).
CBE treatment resulted in a robust reduction of peripheral GCase activity in the liver (Figure 5B) and an attenuated but substantial reduction of GCase activity in the central nervous system (Figure 5C). CBE was well-tolerated in mice and there was no weight loss in any group (Figure S5A). Forelimb grip strength was not significantly changed in mice treated with CBE or α-synuclein PFFs alone, but mice treated with both had a substantial reduction in grip strength from baseline (Figure 5D, 5E, S5B), suggesting an additive effect of the two treatments. However, this reduction in motor strength was not accompanied by degeneration of dopaminergic neurons in the substantia nigra (Figure 5F, 5G).
CBE treatment did not change the overall level or distribution of α-synuclein in mice (Figure S5C). CBE-treated mice did develop rare but consistent spheroids, which stained with one pS129 α-synuclein antibody (81A, Figure S5D). However, these spheroids were not recognized by a second pS129 α-synuclein antibody (EP1536Y) or an antibody recognizing total α-synuclein. Instead, occasional spheroids were also observed with an antibody recognizing APP, suggesting that GCase inhibition does not induce aggregation of α-synuclein but rather induces mild neuronal spheroids recognized by 81A, which can cross-react with neurofilament (Sacino et al., 2014). Axonal spheroids have previously been described in models of GCase dysfunction (Uemura et al., 2015), possibly due to impairment of autophagosome transport (Lee et al., 2011). As previously described (Rocha et al., 2015b; Soria et al., 2017), GCase inhibition also induces prominent astroglial and microglial activation (Figure S5E–S5H).
GCase Inhibition Minimally Alters In Vivo Spread of α-Synuclein Pathology
Based on the primary neuron culture experiments, we hypothesized that if dopaminergic neurons are particularly vulnerable to the effect of GCase inhibition on α-synuclein aggregation, then we might expect to see more pathology specifically in this vulnerable population of neurons. To assess the specificity of any observed changes and relative regional vulnerability, we quantified total and LB-like pathological burden in 132 gray matter regions through the mouse brain (Figure S6) using manual annotation of regions followed by automated quantitation (Figure 6A). Sections for annotation were selected blind to treatment to match 5 coronal sections relative to Bregma. To prevent selection bias, an independent set of sections flanking the original set was stained and annotated similarly to the first. The average of the two sets is reported in the primary dataset available online (See STAR methods) and is used for all subsequent assessments. The overall spread pattern is remarkably similar between vehicle- and CBE-treated mice (Figure 6B), supporting the reproducibility of this model. The number of LB-like inclusions in each area is also very similar between the two groups of mice (Figure 6C).
Figure 6. GCase Inhibition Minimally Alters In Vivo Spread of α-Synuclein Pathology.

(A) α-Synuclein pathology was quantified in 132 regions throughout the brains of mice injected with DPBS (n=8) or CBE (n=8) in addition to α-synuclein PFFs. The 132 annotated regions are displayed here overlaid on mouse brain sections. Below, a zoomed image of the substantia nigra (left) with a total pathology mask (middle) or LB-like pathology mask (right). (B) A quantitative mean heat map of the percentage of area occupied with α-synuclein pathology in each region of DPBS and CBE groups of mice. Warm colors represent high pathology and cool colors represent low pathology as designated in the scale bar on the right. (C) A quantitative mean heat map of the number of LB-like α-synuclein inclusions/mm2 in each region of DPBS and CBE groups of mice. (D) The relative difference between CBE-injected and DPBS-injected mice is displayed here as CBE/DPBS α-synuclein pathology with warm colors indicating regions that have higher pathology in the CBE group and with cool colors indicating regions with that have lower pathology in the CBE group, relative to DPBS group. (E) The Log [% area occupied with α-synuclein pathology] for the DPBS group (x-axis) vs. the CBE group (y-axis) is plotted here with the smoothed mean and 95% confidence interval indicated by the gray line and gray shading (x=y axis; dotted yellow line for reference). Several regions with higher pathology in CBE-injected mice are labeled, as well as the substantia nigra (SN).
When the total α-synuclein pathology is compared between vehicle- and CBE-injected mice (Figure 6D), there are regions that show minimally elevated α-synuclein pathology with CBE treatment (caudoputamen, amygdala, and ipsilateral cortical regions) versus regions with elevated pathology in vehicle-treated mice (rostral and contralateral cortical regions). Notably, the substantia nigra does not have a substantial shift in pathological burden. Most of the changes are less than two-fold. When each region is plotted by the pathological burden in the two groups of mice (Figure 6E), almost all regions lie along an x=y axis, demonstrating the similarity between the two cohorts. These results suggest that there is neither an overall increase in pathology with GCase inhibition, nor a selective vulnerability of dopaminergic neurons to GCase inhibition. Instead, the mean α-synuclein pathology is mildly higher for CBE-treated mice in regions with lower absolute levels of α-synuclein pathology (Figure 6E), suggesting that only regions with low α-synuclein pathology have elevated pathology with CBE treatment.
Network Model Recapitulates α-Synuclein Pathology Spread and Allows Assessment of Regional Vulnerability
Previous work has shown that α-synuclein pathology spreads along an anatomical network in the mouse brain, modulated by selective vulnerability and genetic risk factors (Henderson et al., 2019; Mezias et al., 2019). To further understand any network changes in pathology induced by GCase inhibition, we modeled α-synuclein pathology spread through an anatomical network as previously established (Henderson et al., 2019). Specifically, we used the strength of anatomical connections and α-synuclein gene (Snca) expression to predict the spread of pathology throughout the brain. When compared to the actual pathology in each region, the model shows similar predictive value for both vehicle- (Figure 7A) and CBE- (Figure 7B) injected mice. As previously established, in silico injection into the iCP provides among the best fits to the empirical data (Figure 7C), and other seed regions that show good fits have high in-projection similarity to the iCP (Figure 7D).
Figure 7. Network Model Recapitulates α-Synuclein Pathology Spread and Allows Assessment of Regional Vulnerability.

(A) A network diffusion model based on retrograde propagation across synaptic connections predicts the spread of pathology from a seed in the iCP in vehicle-injected mice (p < 2.2×10^−16). Regional log10-scaled synuclein pathology values are on the y-axis and log10-scaled predicted pathology values are shown on the x-axis. (B) Pathology in CBE-injected mice is similarly fit base on the network diffusion model (p < 2.2×10^−16). (C) Assessment of model specificity to a seed in the iCP. The iCP (black diamond) was above the 96th percentile of regions (purple dots) in terms of model fit for both groups. (D) Model fit with alternate seeds increases non-linearly with increasing similarity of incoming connection weights to that of the iCP. R2 value on the plot indicate the amount of variance that the general affects model (GAM) was able to explain in the alternate seed fit using in-projection similarity to the iCP as a predictor variable. The purple line represents the fitted mean and the shaded area is the 95% confidence interval. (E) The residual vulnerability values is defined as the average model residual for ipsilateral and contralateral regions, and is plotted here using a heat map overlaid in neuroanatomical space. (F) The scatterplot displays the residual vulnerability values for vehicle-injected mice versus CBE-injected mice and fit by a linear regression. The line of best fit and the 95% confidence interval are indicated by the gray line and the gray shading, respectively.
For each region, the residual between the model prediction and the actual pathological load can be understood as a “residual vulnerability” defined as experimental variability that is not well explained by anatomical connectivity or by Snca expression. Vulnerability should be equivalent in the same nucleus on the opposite hemisphere, so all residuals were averaged across hemispheres to give an average residual vulnerability (Figure 7E). Interestingly, there appears to be a relatively strong rostro-caudal gradient in residual vulnerability, but little difference between vehicle- and CBE-treated mice. If GCase was a major factor influencing the residual vulnerability, we would expect residual vulnerability to increase in CBE-treated mice. In contrast to this prediction, values were similar for both groups of mice and well fit by linear regression, with only a few regions showing deviation from this pattern (Figure 7F). Combined with quantitative pathology mapping (Figure 6), this work suggests that GCase inhibition is exerting its influence most prominently in regions with low pathology.
When α-Synuclein Pathology is Low, GCase Activity Modulates Neuronal Vulnerability
The elevation of α-synuclein pathology in cases where α-synuclein pathology is low was consistent between primary neuron cultures and in vivo studies, suggesting that GCase activity may drive α-synuclein pathology when pathology is low. To test this hypothesis, we performed dosing experiments in primary hippocampal and cortical neurons to ascertain the α-synuclein PFF dose-pathology relationship (Figure S7). The dose of α-synuclein PFFs used for previous studies was 1 ng/μL. This dose does not limit the upper or lower bounds since increasing or decreasing α-synuclein PFF dose results in commensurate increases or decreases in pS129 α-synuclein pathology (Figure S7A) with a tight dose-pathology relationship for both hippocampal (R2=0.907, Figure S7B) and (R2=0.908, Figure S7F) cortical neurons. At higher doses, α-synuclein PFFs also induce dramatic dendrite (Figure S7C) and neuron loss (Figure S7D) in hippocampal neurons, features which are also well-fit by sigmoidal dose equations (R2=0.538 and 0.591, respectively). Even at the highest tested doses, cortical neurons had substantially lower pathology than hippocampal neurons, and pathology did not induce dendrite (Figure S7G) or neuron (Figure S7H) loss. Interestingly, reducing α-synuclein PFF dose did not induce less pathology in the same number of neurons, but rather an “all-or-nothing” response wherein a few neurons had a high degree of pathology, including LB-like inclusions, while the majority of neurons were resilient and had no pathology.
To mimic the low pathology observed in cortical and midbrain neuron cultures, hippocampal neurons were treated with 320 pg/mL α-synuclein PFFs (Figure 8A). GCase inhibition with CBE dramatically elevates the amount of pS129 α-synuclein pathology to over 4-fold of that seen with vehicle treatment (Figure 8B). This elevation was accompanied by no change in MAP2 (Figure 8C) and a slight reduction in the number of neurons (Figure 8D). Fitting pathological changes to the dose curve established in Figure S7B suggests that the level of change induced by CBE treatment is equivalent to a 9-fold higher dose of α-synuclein PFFs. Induction of a higher level of pathology in cortical neurons (Figure S7I) was also able to abrogate the previously-observed effect of CBE on pathology (Figure S7J), suggesting that reduced GCase activity has its largest effect when α-synuclein pathology is low.
Figure 8. When α-Synuclein Pathology is Low, GCase Activity Modulates Neuronal Vulnerability.

(A) Primary hippocampal neurons treated with 320 pg/mL α-synuclein PFFs are stained for pathological pS129 α-synuclein (magenta), MAP2 (gray) and NeuN (blue). (B) Quantification of pS129 α-synuclein area/MAP2 area reveals an over 4-fold elevation in pathology with CBE treatment (Kruskal-Wallis test with Dunn’s multiple comparisons test to PFF-Vehicle: PBS-Vehicle **p=0.0012, PFF-CBE **p=0.0021, n=18/group). (C) Quantification of MAP2 area (Kruskal-Wallis test with Dunn’s multiple comparisons test to PFF-Vehicle: All p-values are greater than 0.05, n=18/group). (D) Quantification of NeuN number (Kruskal-Wallis test with Dunn’s multiple comparisons test to PFF-Vehicle: PBS-Vehicle p=0.2101, PFF-CBE *p=0.0343, n=18/group). (E) Primary hippocampal neurons treated with 40 ng/mL LB α-synuclein and stained as in panel (A). (F) Quantification of pS129 α-synuclein area/MAP2 area (Kruskal-Wallis test with Dunn’s multiple comparisons test to LB-Vehicle: PBS-Vehicle ****p<0.0001, LB-CBE ****p<0.0001, n=7 LB cases). (G) Quantification of MAP2 area (Kruskal-Wallis test with Dunn’s multiple comparisons test to LB-Vehicle: PBS-Vehicle ***p=0.0005, **LB-CBE p=0.0030, n=7 LB cases). (H) Quantification of NeuN number (Kruskal-Wallis test with Dunn’s multiple comparisons test to LB-Vehicle: PBS-Vehicle p=0.2121, LB-CBE ****p<0.0001, n=7 LB cases). (I) Gba+/+ and GbaD409V/+ littermate brains were used to conduct a GCase activity assay. GbaD409V/+ mice showed an approximately 23% reduction in GCase activity compared to wildtype littermates (unpaired t-test: **p=0.0014). (J) Gba+/+ and GbaD409V/+ primary hippocampal neurons treated with 320 pg/mL α-synuclein PFFs were stained as in panel (A). (K) Quantification of pS129 α-synuclein area/MAP2 area (Welch’s t-test ****p<0.0001). Scale bars = 50 μm. Data are represented as mean ± SEM.
All of the experiments to this point have utilized recombinant α-synuclein PFFs. We have recently developed a protocol to induce α-synuclein pathology in primary neurons using human LB disease α-synuclein (Henderson et al., 2018; Peng et al., 2018). Only low concentrations of LB α-synuclein can be extracted and therefore will induce sparse pathology. This fact makes brain-derived LB α-synuclein a natural tool to test the hypothesis that low α-synuclein pathology can be modulated by GCase status. Treatment of primary hippocampal neurons with brain-derived LB α-synuclein (Table S1) induced sparse pathology (Figure 8E), as with low doses of α-synuclein PFFs. Again, treatment with CBE dramatically elevated the α-synuclein pathology in these neurons (Figure 8F). This elevation was accompanied by a slight decrease in MAP2 (Figure 8G) and neuron number (Figure 8H).
Most experiments in this manuscript were designed to explicitly investigate the effect of GCase activity on α-synuclein by utilizing the GCase inhibitor CBE. While this chemical inhibitor is a powerful tool, it does not involve mutated GCase as in human disease, and therefore cannot be used for development of most therapeutic agents for treatment of GBA PD. To assess whether a genetic mutation in Gba could lead to a similar exacerbation of α-synuclein pathology, we utilized a recently-developed knock-in (KI) mouse which expresses mutant Gba (D409V KI, C57BL/6N-Gbatm1.1Mjff/J). Mice heterozygous for the mutation yielded wildtype and D409V heterozygous (GbaD409V/+) pups which were used for primary hippocampal neuron culture. The non-hippocampal regions of the brain were assessed for GCase activity and in GbaD409V/+ mice showed an approximate 23% reduction in brain GCase activity (Figure 8I) compared to Gba+/+ mice. Hippocampal neurons from wildtype Gba+/+ and GbaD409V/+ mice were treated with 320 pg/mL α-synuclein PFFs (Figure 8J), which induced a small amount of pathology in wildtype neurons and approximately 3-fold higher pathology in GbaD409V/+ neurons (Figure 8K). Thus, genetic mutations in Gba also exacerbate α-synuclein pathology, and D409V KI neurons could be a powerful tool in screening potential GCase-directed therapeutics molecules.
DISCUSSION
It has been over 15 years since the initial recognition of a link between GBA1 mutation carriers and the development of PD (Goker-Alpan et al., 2004). Yet, the relationship between GCase and PD has remained unclear due to difficulties in capturing the complexities of neurodegenerative disease in cell and animal models (reviewed in (Aflaki et al., 2017; Barkhuizen et al., 2016)). The key finding in the field is that mutations in GBA1 elevate risk to PD and DLB with odds ratios of 5–8 (Nalls et al., 2013; Sidransky et al., 2009). Despite this strong association, there is no apparent direct relationship between reduced GCase activity, substrate accumulation and developing PD. The independence between these variables is highlighted by the fact that around 90 percent of people carrying mutations in GBA1 do not develop PD (Rosenbloom et al., 2011). This statistic is a major gap in the general hypothesis that reduced GCase activity can lead to elevated α-synuclein levels or the aggregation of α-synuclein. A causative relationship between GCase activity and α-synuclein levels should induce PD in a higher percentage of the population with GBA1 mutations as is seen with mutations or triplications in the α-synuclein gene, SNCA (Kasten and Klein, 2013). Instead, what is seen is a shift in susceptibility to PD, which suggests that GBA1 mutations are modifying an extant pathology.
In the current study, we systematically evaluated the relationship between GCase activity and α-synuclein pathology, and find that GCase inhibition does not increase total α-synuclein levels or lead to de novo aggregation of α-synuclein. Nor do total α-synuclein levels correlate with GCase activity, consistent with other recent literature (Tayebi et al., 2017). However, inhibition of GCase leads to a dramatic increase in α-synuclein pathology when this pathology is initiated with misfolded α-synuclein seeds. Intriguingly, we find that the modulation of α-synuclein pathology by GCase activity does not depend on neuron type, but rather the level of extant pathology. Collectively, these results fit the hypothesis that misfolded α-synuclein is generated throughout life at a certain rate, leading to PD or DLB in around 1.5% of people (Tanner and Goldman, 1996). However, in the early stages of PD, when misfolded α-synuclein is minimal, reductions in GCase activity may have an outsize effect, shifting the vulnerability of this population so that 10% of the population with GBA1 mutations is affected (Rosenbloom et al., 2011). Further, this increase in vulnerability would not appear to affect select neuronal populations, but rather depend on where pathology begins, leading to enhanced incidence of both PD (Sidransky et al., 2009) and DLB (Nalls et al., 2013).
How GCase modulates neuronal susceptibility to pathogenic α-synuclein is still an open question. Reduced GCase activity leads to accumulation of GCase substrates, GlcCer and GlcSph. The accumulation of these substrates can impair lysosomal function (Mazzulli et al., 2011), possibly leading to reduced degradation of pathogenic α-synuclein. Further, when the lysosome is overburdened, vesicle contents may be released into the extracellular space (Eitan et al., 2016). These released vesicles may contain GlcCer and GlcSph as well as pathogenic α-synuclein, enhancing the cell-to-cell spread of α-synuclein. Further, if GlcCer and GlcSph are in contact with α-synuclein, they may form a more potent pathogenic strain (Taguchi et al., 2017; Zunke et al., 2018). Further exploration of α-synuclein pathology in genetic models of GCase dysfunction are warranted, especially in relation to therapeutic development for PD and DLB.
STAR METHODS
LEAD CONTACT AND MATERIALS AVAILABILITY
Further information and requests for resources and reagents should be directed to and will be fulfilled by the Lead Contact, Dr. Michael X. Henderson (hendm@pennmedicine.upenn.edu). This study did not generate new unique reagents.
EXPERIMENTAL MODEL AND SUBJECT DETAILS
Mice
All housing, breeding, and procedures were performed according to the NIH Guide for the Care and Use of Experimental Animals and approved by the University of Pennsylvania Institutional Animal Care and Use Committee. C57BL/6J are available from Jackson Laboratory (JAX 000664, RRID: IMSR_JAX:000664) and were used for all in vivo experiments and for midbrain/striatum primary neuron co-cultures. For in vivo experiments, both male (n=11) and female (n=13) mice were used and were 3–4 months old at the time of injection. No influence of sex was identified in the measures reported in this study. CD1 (Strain 022, RRID: IMSR_CRL:22) mice were obtained from Charles River, Wilmington, MA and used for primary hippocampal, cortical and astrocyte cultures. D409V KI mice (C57BL/6N-Gbatm1.1Mjff/J, JAX Stock #019106, RRID: IMSR_JAX:019106) were obtained from Jackson Laboratory, were bred as heterozygous pairs and were used for primary hippocampal neuron experiments. D409V KI mice express the mouse mutant D427V Gba protein, which corresponds to the D409V mutation in human GBA protein.
Primary Hippocampal Neuron Cultures and Primary Cortical Neuron Cultures
Primary hippocampal or cortical neuron cultures were prepared as previously described (Henderson et al., 2017; Henderson et al., 2018) from embryonic day (E) 16–18 CD1 embryos or postnatal day (P) 1 D409V KI mice. Dissociated hippocampal or cortical neurons were plated at 17,000 cells/well (96-well plate), 375,000 cells/well (12-well plate) or 1,000,000 cells/well (6-well plate) in neuron media (Neurobasal medium (ThermoFisher 21103049) supplemented with B27 (ThermoFisher 17504044), 2 mM GlutaMax (ThermoFisher 35050061), and 100 U/mL penicillin/streptomycin (ThermoFisher 15140122).
Primary Midbrain and Striatum Neuron Co-cultures
The midbrain and striatum primary neuron co-cultures were prepared as previously described (Henderson et al., 2018). The ventral mesencephalon and striatum were dissected from P2 C57BL/6J mice in Hibernate A medium (ThermoFisher A1247501) with B27 (ThermoFisher 17504044) and 0.5 mM GlutaMax (ThermoFisher 35050061). The tissue was then digested in 20 U/mL papain (Worthington Biochemical LS003126) for approximately 20 minutes at 37°C, washed in neuronal medium and strained to remove cellular debris. Cells were mixed at a ratio of 1:1 and plated at a density of 34,000 cells/well in 96-well black-walled plates (Perkin Elmer 50–905-1605) in Neurobasal A medium (ThermoFisher 10888–022) supplemented with B27 and 0.4 mM GlutaMax, 50 ng/mL BDNF (PeproTech 450–02) and 30 ng/mL GDNF (Millipore Sigma GF030).
Primary Astrocyte Cultures
Primary astrocytes were prepared from the cortex of P2 CD1 mice. Cortices were dissected in ice-cold DPBS and digested in 20 U/mL papain for approximately 10 minutes at 37°C, washed in neuronal medium and strained to remove cellular debris. Cells were plated in T25 flasks in glial medium (DMEM (FisherScientific, Cat#MT10013CV), 10% fetal bovine serum (Atlanta Biologicals Cat#S10350), 25 U/mL penicillin/streptomycin (ThermoFisher 15140122)). Cells were placed in the incubator at 37°C for 2 hours. After 2 hours, cells were washed twice with 4°C MEM (Sigma-Aldrich Cat#M2279) and media was replaced with 4°C glial medium. When flasks reached confluence, they were shaken roughly to remove all remaining non-astrocytic cells. For astrocyte and hippocampal neuron co-culture, astrocytes were plated on 96-well plates that had been coated with 40 μg/mL poly-D-lysine (PDL, Sigma-Aldrich Cat#P0899) and 1.15 mg/mL laminin (EMD Millipore Cat#CC095). Astrocytes were lifted from the flask with trypsin and plated in 96-well plates for imaging (8,500 cell/well) or 6-well plates for biochemistry (500,000 cells/well). When cells reached 70% confluence 5-fluorodeoxyuridine (5-FDU) solution (6.7 mg/mL 5-FDU (Sigma-Aldrich Cat#F0503), 16.5 mg/mL uridine (Sigma-Aldrich Cat#U3003)) was added to slow cell division.
Primary Astrocyte and Neuron Co-cultures
For the astrocyte and neuron co-culture experiment comparison to primary hippocampal neuron cultures, astrocytes were plated on half of a 96-well plate as noted above and the other half was treated exactly the same except without astrocytes to allow direct comparison of the two cultures. The day before culturing of primary hippocampal neurons, astrocytes were washed twice with cold MEM and media was replaced with fresh glial-neuron medium (Neurobasal A medium, 1% B27, 1% FBS, 0.5 mM GlutaMax). Hippocampal neurons were then prepared as above and plated either on top of astrocytes or in adjacent wells without astrocytes.
Cell Lines
Human embryonic kidney 293 cells stably expressing WT α-synuclein have been described previously (Luk et al., 2009). Cells were cultured in HEK cell medium (DMEM (FisherScientific, Cat#MT10013CV) supplemented with 10% fetal bovine serum (Atlanta Biologicals Cat#S10350) and 100 U/mL penicillin/streptomycin (ThermoFisher 15140122)). Cells were plated at 30,000 cells/cm2 two days before transduction with α-synuclein PFFs.
α-synuclein PFFs
Purification of recombinant mouse α-synuclein and generation of α-synuclein PFFs was conducted as described elsewhere (Luk et al., 2009; Volpicelli-Daley et al., 2014; Volpicelli-Daley et al., 2011). The pRK172 plasmid containing the gene of interest was transformed into BL21 (DE3) RIL-competent E. coli (Agilent Technologies Cat#230245). A single colony from this transformation was expanded in Terrific Broth (12 g/L of Bacto-tryptone, 24 g/L of yeast extract 4% (vol/vol) glycerol, 17 mM KH2PO4 and 72 mM K2HPO4) with ampicillin. Bacterial pellets from the growth were sonicated and the sample was boiled to precipitate undesired proteins (this boiling step was skipped for GFP-tagged α-synuclein. The supernatant was dialyzed with 10 mM Tris, pH 7.6, 50 mM NaCl, 1 mM EDTA overnight. Protein was filtered with a 0.22 μm filter and concentrated using Amicon Ultra-15 centrifugal filter units (Millipore Sigma Cat#UFC901008). Protein was then loaded onto a Superdex 200 column and 1 mL fractions were collected. Fractions were run on SDS-PAGE and stained with Coomassie blue to select fractions that were highly enriched in α-synuclein. These fractions were combined and dialyzed in 10 mM Tris, pH 7.6, 50 mM NaCl, 1 mM EDTA overnight. Dialyzed fractions were applied to the MonoQ column (GE Health, HiTrap Q HP 645932) and run using a linear gradient from 25 mM NaCl to 1 M NaCl. Collected fractions were run on SDS-PAGE and stained with Coomassie blue. Fractions that were highly enriched in α-synuclein were collected and dialyzed into DPBS. Protein was filtered through a 0.22 μm filter and concentrated to 5 mg/mL (α-synuclein) or the molar equivalent (15 mg/mL α-synuclein-GFP) with Amicon Ultra Centrifugal Filters. Monomer was aliquoted and frozen at −80°C. For preparation of α-synuclein PFFs, α-synuclein monomer was shaken at 1,000 rpm for 7 days. Conversion to PFFs was validated by sedimentation at 100,000 × g for 60 minutes and by thioflavin S staining.
Human Tissue
All procedures were done in accordance with local institutional review board guidelines. Written informed consent for autopsy and analysis of tissue sample data was obtained either from patients themselves or their next of kin. Cases used for extraction (Table S1) of LB α-synuclein were selected based a high burden of α-synuclein by immunohistochemical staining. Cases used for extraction were balanced by sex (Female = 3; Male = 4) and were frozen an average of 12 hours post-mortem. Differences in sex were not assessed because these cases were only utilized for protein extraction.
METHOD DETAILS
CBE Administration
GCase inhibitor conduritol-β-epoxide (CBE, Cayman Chemical Company, Cat#15216, MedChem Express Cat#HY-100944) was reconstituted at 10 mg/mL in Dulbecco’s phosphate-buffered saline (DPBS, Corning Cat#21–031-CV) and stored at −20°C. For cell culture experiments, vehicle or CBE were further diluted to the final concentration indicated in neuron media or HEK cell media. For in vivo experiments, mice were injected intraperitoneally with 100 mg/kg CBE or an equivalent volume of DPBS the day before injection with α-synuclein PFFs. Mice were then injected every other day for one month, alternating sides of injection. Mice were sacrificed approximately 24 hours following the final injection of CBE or vehicle.
α-synuclein PFF Treatments
Primary Neurons
For treatment of neurons, mouse α-synuclein PFFs, which were generated at a concentration of 5 mg/mL were vortexed and diluted with Dulbecco’s phosphate-buffered saline (DPBS, Corning Cat#21–031-CV) to 100 μg/mL. They were then sonicated on high for 10 cycles of 30 seconds on, followed by 30 seconds off (Diagenode Biorupter UCD-300 bath sonicator). α-Synuclein PFFs were then diluted in neuron media to the noted concentrations and added to neuron cultures at 7 DIV. Neuron cultures were harvested 14 days post-treatment (DPT). For experiments in which α-synuclein monomer was used, it was diluted and sonicated in an identical manner.
HEK Cells
One day before transduction, cells were treated with vehicle or CBE. Transduction with human α-synuclein PFFs was performed as previously reported (Luk et al., 2009). Human α-synuclein PFFs were diluted in DPBS (Corning Cat#21–031-CV) to 100 μg/mL and sonicated on high for 10 cycles of 30 seconds on, followed by 30 seconds off (Diagenode Biorupter UCD-300 bath sonicator). 80 μL of the α-synuclein PFFs were added per tube of BioPORTER (Genlantis, Cat#BP509696). Tubes were vortexed and incubated at room temperature for 10 minutes. 420 μL of Opti-MEM (ThermoFisher Cat#31985070) was added to each tube and mixed by pipetting. Cells were washed once with warmed Opti-MEM and medium was replaced with Opti-MEM. The α-synuclein PFF-BioPORTER mix was added dropwise to cells. After 6 hours, media was aspirated and replaced with HEK cell media with reduced FBS (0.25%).
Mice
All surgery experiments were performed in accordance with protocols approved by the Institutional Animal Care and Use Committee (IACUC) of the University of Pennsylvania. Mouse α-synuclein PFFs, which were generated at a concentration of 5 mg/mL were vortexed and diluted with DPBS to 2 mg/mL. They were then sonicated on high for 10 cycles of 30 seconds on, followed by 30 seconds off (Diagenode Biorupter UCD-300 bath sonicator). Mice were injected when 3–4 months old. Mice were injected unilaterally by insertion of a single needle into the right forebrain (coordinates: +0.2 mm relative to Bregma, +2.0 mm from midline) targeting the dorsal striatum (2.6 mm beneath the dura) with 5 μg α-synuclein PFFs (2.5 μL). Injections were performed using a 10 μL syringe (Hamilton, NV) at a rate of 0.4 μL/minute. After 1 month, mice were perfused transcardially with PBS, brains were removed and underwent overnight fixation in 70% ethanol in 150 mM NaCl, pH 7.4. Liver and spinal cord were removed and rapidly frozen for assaying GCase activity.
GCase Activity Assay
GCase activity was determined using a fluorogenic substrate as has been reported extensively elsewhere (Aflaki et al., 2016; Marshall et al., 2002; Taguchi et al., 2017). Cells were washed twice with PBS and scraped in PBS supplemented with protease and phosphatase inhibitors. Cells were then spun down at 10,000 × g for 10 minutes and supernatant was removed. For in vivo experiments, tissue was rapidly weighed and frozen. Cell pellets or animal tissue was then suspended in ice-cold activity assay buffer (citrate-phosphate buffer pH 5.4, 0.25% TX-100, 1 mM EDTA) with protease and phosphatase inhibitors. Tissue was homogenized with a dounce homogenizer (Pyrex Cat# 7725–13) for 25 strokes. Tissue or cells were then sonicated 20 times for 1 second at a setting of 2.5 (QSonica Microson™ XL-2000) and rotated for 15 minutes or more at 4°C to allow for full resuspension of proteins. Samples were centrifuged for 15 minutes at 10,000 × g and supernatant was collected. Lysates were then incubated for 30 minutes with or without the presence of 100 μM CBE to exclude activity from non-lysosomal GCase. The final reported values are those taken from samples without CBE minus those taken from the same sample with CBE, normalized to the mean value of control samples. Samples were added to a 384-well plate and incubated with 10 mM 4-methylumbelliferyl β-D-glucopyranoside (Sigma-Aldrich Cat#M3633) in activity assay buffer with 1% BSA for 1 hour at 37°C. One volume stop buffer (1 M glycine, pH 12.5) was added and plates were read on a spectrophotometer (λex = 365, λem = 445). For determination of specific GCase activity, parallel samples were immunoblotted for GCase protein levels.
Sequential Detergent Fractionation
Proteins from primary neuronal or astrocyte cultures treated with PBS or α-synuclein PFFs were sequentially extracted as described previously (Henderson et al., 2017; Henderson et al., 2018; Volpicelli-Daley et al., 2011). Neurons were washed twice with PBS and scraped into 1 volume 1% TX-100 buffer (50 mM Tris-HCl pH 7.6, 150 mM NaCl, 1% TX-100) with protease and phosphatase inhibitors. Cells were then sonicated (20× 1 second pulses, setting 2.5, QSonica Microson™ XL-2000) and spun at 100,000 × g for 30 min. The pellet was sonicated and again spun at 100,000 × g for 30 min in 1 volume 1% TX-100 buffer to remove remaining TX-100-soluble proteins. This pellet was suspended in 0.5 volumes 2% SDS buffer (50 mM Tris-HCl pH 7.6, 150 mM NaCl, 2% SDS) with protease and phosphatase inhibitors, sonicated and spun once more at 100,000 × g for 30 min. The first and final supernatant were kept for immunoblot analysis.
Human Brain Sequential Detergent Fractionation
Frozen postmortem human cingulate gyrus or frontal cortex brain tissue containing abundant α-synuclein-positive inclusions was selected for sequential extraction based on IHC examination of these samples as described (Irwin et al., 2012) using previously established methods. These brains were sequentially extracted with increasing detergent strength as previously described (Guo et al., 2013; Henderson et al., 2018). After thawing, meninges were removed and gray matter was carefully separated from white matter. Gray matter was weighed and suspended in four volumes (w/v) high salt (HS) buffer (50 mM Tris-HCL (pH 7.4), 750 mM NaCl, 10 mM NaF, 5 mM EDTA, protease and phosphatase inhibitors), followed by homogenization with a dounce homogenizer and centrifugation at 100,000 × g for 30 minutes. The HS wash was repeated and the resulting pellet was then homogenized with 9 volumes HS buffer with 1% TX-100 and centrifuged at 100,000 × g for 30 minutes. The pellet fraction was then homogenized with 9 volumes HS buffer with 1% TX-100 and 30% sucrose and centrifuged at 100,000 × g for 30 minutes to float away the myelin, which was discarded. The pellet was then homogenized with 9 volumes HS buffer with 1% sarkosyl, rotated for 1 hour at room temperature and centrifuged at 100,000 × g for 30 minutes. The resulting pellets were washed once with Dulbecco’s PBS and re-suspended in Dulbecco’s PBS by brief sonication (QSonica Microson™ XL-2000; 20 pulses; setting 2; 0.5 sec/pulse). This suspension was termed the “sarkosyl insoluble fraction” containing pathological α-synuclein and used for the cellular assays described here. The amounts of α-synuclein in the sarkosyl insoluble fractions were determined by sandwich ELISA as described previously (Covell et al., 2017) using Syn9027 (100 ng/well) as the capture antibody and MJF-R1 (1:1000 dilution) as the reporter antibody.
Immunoblotting
Total protein concentration in each sample was determined by a bicinchoninic acid colorimetric assay (Fisher Cat#23223 and 23224), using bovine serum albumin as a standard (Thermo Fisher Cat#23210). Protein was resolved on 5–20% gradient polyacrylamide gels using equal protein loading. Proteins were transferred to 0.2 um nitrocellulose membranes and detected with primary antibodies (Syn9027, CNDR, 1:20,000), pS129 α-synuclein (Abcam Cat#ab168381, 1:1000), GCase (Sigma-Aldrich Cat#G4171, 1:1,000), GCase (Santa Cruz Biotech Cat#sc-166407, 1:200), GFAP (Agilent Cat# Z0334, 1:5,000) or GAPDH (2-RGM2, Advanced Immunological, 1:5000). Primary antibodies were detected using IRDye 800 (Li-cor 925–32210) or IRDye 680 (Li-cor 925–68071) secondary antibodies, scanned on a Li-cor Odyssey Imaging System and analyzed using Image Studio software. Values obtained from this program were normalized to GAPDH or GFAP, and were further normalized to the mean control values.
Immunocytochemistry
Primary neuron or cell line cultures were fixed with 4% paraformaldehyde, 4% sucrose in phosphate-buffered saline and washed five times in PBS. Immunostaining of cultures was carried out as described previously (Henderson et al., 2017; Henderson et al., 2018). Cells were permeabilized in 3% BSA + 0.3% TX-100 in PBS for 15 minutes at room temperature. After a PBS wash, cells were blocked for 50 minutes with 3% BSA in PBS prior to incubation with primary antibodies for 2 hours at room temperature. Primary antibodies used were targeting pS129 α-synuclein (81A, CNDR, 1:5000), MAP2 (17028, CNDR, 1:5000), NeuN (Millipore Cat#MAB377, 1:1500) or tyrosine hydroxylase (TH, Sigma-Aldrich Cat#T2928, 1:1000). Cells were washed 5x with PBS and incubated with secondary antibodies for 1 hour at room temperature. After 5x wash with PBS, cells were incubated in DAPI (ThermoFisher Cat#D21490, 1:10,000) in PBS. 96-well plates were imaged on an In Cell Analyzer 2200 (GE Healthcare) and analyzed in the accompanying software. A standard intensity-based threshold was applied to MAP2 and pS129 α-synuclein channels equally across plates and the positive area was quantified. For NeuN quantification, an object-based analysis was applied to identify objects of specified size and intensity. TH+ cell analysis was based on intensity and size of objects (TH+ cells bodies are much more intense than associated processes). All quantification was optimized and applied equally across all conditions.
Behavior
Mouse grip strength was measured using the animal grip strength test (IITC 2200). For this test, a bar is attached to a digital force transducer. Mice were moved to a quiet behavioral testing suite and allowed to acclimate for 1 hour. Each mouse was held by the base of the tail and allowed to grasp the bar. Once the mouse clasped, the mouse is slowly moved backwards, in line with the force transducer until the mouse released the grid. The maximum grip force was recorded. The mouse was allowed to rest for several seconds, and then was placed on the grid again. The maximum grip strength of 5 tests was recorded. No fatigue was observed during the test period, so the average of all 5 measures is reported.
Immunohistochemistry
After perfusion and fixation, brains were embedded in paraffin blocks, cut into 6 μm sections and mounted on glass slides. Slides were then stained using standard immunohistochemistry as described below. Slides were de-paraffinized with 2 sequential 5-minute washes in xylenes, followed by 1-minute washes in a descending series of ethanols: 100%, 100%, 95%, 80%, 70%. Slides were then incubated in deionized water for one minute prior to antigen retrieval as noted. After antigen retrieval, slides were incubated in 5% hydrogen peroxide in methanol to quench endogenous peroxidase activity. Slides were washed for 10 minutes in running tap water, 5 minutes in 0.1 M tris, then blocked in 0.1 M tris/2% fetal bovine serum (FBS). Slides were incubated in primary antibodies overnight. The following primary antibodies were used. For pathologically-phosphorylated α-synuclein, pS129 α-synuclein (EP1536Y; Abcam Cat#ab51253) was used at 1:20,000 with microwave antigen retrieval. A second primary antibody recognizing pathologically-phosphorylated α-synuclein, pS129 α-synuclein (81A, CNDR, 1:20,000, no antigen retrieval) was also used to characterize non-injected mice but was not used for pathology quantification. To stain midbrain dopaminergic neurons, anti-tyrosine hydroxylase (TH-16; Sigma-Aldrich T2928) was used at 1:5,000 with formic acid antigen retrieval. Anti-GFAP (CNDR, 2.2B10, 1:5,000, no antigen retrieval) and anti-Iba-1 (Wako Cat#019–19741, 1:1,000, no antigen retrieval) were used to quantify gliosis in mice. An antibody recognizing total α-synuclein (Syn9027, CNDR, 1:2,000 microwave antigen retrieval) and APP (Millipore Cat#MAB348, 1:4,000, no antigen retrieval) were also used to characterize non-injected mice.
Primary antibody was rinsed off with 0.1 M tris for 5 minutes, then incubated with goat anti-rabbit (Vector BA1000) or horse anti-mouse (Vector BA2000) biotinylated IgG in 0.1 M tris/2% FBS 1:1000 for 1 hour. Biotinylated antibody was rinsed off with 0.1 M tris for 5 minutes, then incubated with avidinbiotin solution (Vector PK-6100) for 1 hour. Slides were then rinsed for 5 minutes with 0.1 M tris, then developed with ImmPACT DAB peroxidase substrate (Vector SK-4105) and counterstained briefly with hematoxylin. Slides were washed in running tap water for 5 minutes, dehydrated in ascending ethanol for 1 minute each (70%, 80%, 95%, 100%, 100%), then washed twice in xylenes for 5 minutes and coverslipped in Cytoseal Mounting Media (Fisher 23–244-256).
Slides were scanned into digital format on a Lamina scanner (Perkin Elmer) at 20x magnification. Digitized slides were then used for quantitative pathology.
Quantitative pathology
All section selection, annotation and quantification was done blinded to treatment. For quantification of α-synuclein pathology, coronal sections were selected to closely match the following coordinates, relative to bregma: 2.10 mm, 0.98 mm, −1.22 mm, −2.92 mm and −4.48 mm. The digitized images were imported into HALO software to allow annotation and quantification of the percentage area occupied by α-synuclein pathology and the number of cell body inclusions. Standardized annotations were drawn to allow independent quantification of 132 gray matter regions throughout the brain. Each set of annotations was imported onto the desired section and modified by hand to match the designated brain regions. After annotation, the analysis scripts were applied to the brain to make sure that no nonpathology signal was detected. After annotation off all brains, analysis algorithms were applied to all stained sections, and data analysis measures for each region were recorded.
Two analysis algorithms were applied to the tissue. The first detects total signal above a minimum threshold. Specifically, the analysis included all DAB signal that was above a 0.157 optical density threshold, which was empirically determined to not include any background signal. This signal was then normalized to the total tissue area. A minimal tissue optical density of 0.02 was used to exclude any areas where tissue was split, and a tissue edge thickness of 25.2 μm was applied to exclude any edge effect staining. The second analysis was designed to detect only cell body inclusions. This analysis first classified staining into two broad classes: thin versus thick pathology based on size and texture inputs. The analysis used only the class of thick pathology and excluded objects smaller than 40 μm2 and greater than 400 μm2 to remove small inclusions and to separate multiple inclusions from each other.
Every 10th slide through the midbrain was stained with tyrosine hydroxylase (TH). TH-stained sections were used to annotate the substantia nigra, and cell counting was performed manually in a blinded manner for all sections. The sum of all sections was multiplied by 10 to estimate the total count that would be obtained by counting every section.
Computational models of pathological protein spread
Models of linear diffusion along white matter fibers have been used to predict the spread of misfolded α-synuclein in mice (Henderson et al., 2019), as well as patterns of atrophy observed in various neurodegenerative diseases neurodegenerative diseases (Pandya et al., 2017; Raj et al., 2012). In the present work, we aimed to further validate the explanatory power of these connectome-based models of protein spread and understand the effects of GCase inhibition on the network spread of misfolded α-synuclein. Similar to previous work (Henderson et al., 2019), we used an injection site in the right caudate-putamen (iCP).
We model pathological spread of α-synuclein as a diffusion process on a directed structural brain network G = {V, E} whose nodes V are N cortical and subcortical grey matter regions and whose edges eij ∈ E represent an axonal projection initiating in Vi and terminating in Vj, where eij ≥ 0 for all E. Edge strength was quantified by the Allen Brain Institute using measures of fluorescence intensity from retrograde viral tract tracing (Oh et al., 2014). We define the weighted adjacency matrix of G as A = [Aij]. Informed by the full anatomy, a set of rows and columns of A were averaged to generate an undersampled adjacency matrix A′, in which N = 116 regions, in accordance with our quantitative measurements of regional synuclein pathology at time t =1 month.
We represent the mean magnitude of observed α-synuclein pathology of all N nodes at time t as the vector x(t). This mean was computed separately across all mice treated with a DPBS vehicle injection or with a CBE injection. We compute the predicted regional α-synuclein pathology as a function of A′ and seed region s ∈ V using the form
where , and . Note that c time scale of the system, which is necessary due to the fact that the units of connection strength are arbitrary relative to the units of pathology. We selected the time constant c. which maximized the model fit f, defined as the Pearson correlation coefficient between log10 x(t) and for all non-zero values of x(t), averaged over t =[1 3 6]. We tested a range of values for c. between 0.01 and 60, because at c = 0, no propagation of pathology occurs and at c > 60, we began to observe numerical instability in computing . Note that L is the out-degree Laplacian, a version of the well-characterized graph Laplacian designed for directed graphs (Hong Ronald Chan et al., 2015). Intuitively, this model posits that the rate of change in the pathology at region i is proportional to a weighted sum of the pathology at all other regions and the strength of outgoing projections arriving at those regions from region i, minus the sum of outgoing connections from region i times the amount of pathology at region i. All computations were performed in R (https://www.R-project.org/) (Team, 2018).
Model incorporating α-synuclein expression
In addition to the spread of the misfolded protein along anatomical connections, previous work has demonstrated that the presence of endogenous α-synuclein at each brain region modulates the spread of pathogenic α-synuclein to that region. Using data obtained through the Allen Brain Institute, we computed the N × 1 vector R, containing the mean level of α-synuclein mRNA at each brain region in our 116-region parcellation. Next, we used multiple linear regression to predict observed pathology in each region from a linear combination of the diffusion-based prediction of regional pathology and regional levels of α-synuclein mRNA expression by fitting the model:
where Y is log10x(t = 1), the log-transformed vector of observed regional pathology at t = 1 month; D is , the vector of diffusion-based predictions of regional pathology at t =1 month for the optimal value of c; R is the vector of regional α-synuclein expression; β terms are regression weights; and ε is an error term. The predicted values generated by this model, , are plotted against log10x(t = 1) in the results section of the manuscript. We defined residual vulnerability as , which are the residuals of the model, and averaged those values across hemispheres to obtain final regional vulnerability values. We used the term “residual vulnerability” because the residuals of this model contain variance in regional pathology due to factors other than the spread along an average connectome or average synuclein expression. These factors may include GCase status, neurotransmitter type, spike rate, reactive oxygen species, hyperbranching axons, or gene expression, among other possibilities. In principle, positive values of εi indicate that region i has more pathology than expected, and negative values of εi indicate that region i has less pathology than expected. In the current study, the comparison between vehicle-injected and CBE-injected mice should unveil any difference in vulnerability due to CBE treatment.
Quantification of model specificity
In a previous study (Henderson et al., 2019), we found that the substantial variance explained in misfolded α-synuclein spread by connectome-based linear diffusion models was specific to the use of iCP as the seed site s, which defines the vector xo. Here, we sought to validate this finding in an independent sample. To test the model specificity, we fit the time constant c to the observed data as described above using every region as s except for iCP, generating a distribution of non-specific fits for each time points. We computed a one-tailed, non-parametric p-value for the specificity of iCP as the seed region s by computing the percentage of alternate seed regions yielding a better fit than the fit obtained using iCP as a seed.
We hypothesized that seed regions with similar connectivity profiles to that of iCPu would perform similarly in explaining the observed data. We computed the similarity of incoming connectivity to iCP as the Pearson correlation coefficients between the column of A′ij where j is the iCP, and the columns of A′ij where j is all other regions except iCPu. Conversely, we computed the similarity of outgoing connectivity to iCPu as the Pearson correlations between the row of A′ij where i is the iCPu, and the rows of A′ij where i is all other regions except iCPu.
Because the relationship between alternate seed model fit and similarity of incoming connectivity to iCPu appeared to have a non-linear form, we used a general additive model (GAM) to fit the relationship using the gam function from the mgcv package in R (N. Wood, 2006). A GAM is a generalized linear model in which the linear predictor is defined by unknown smooth functions of predictor variables (Wood, 2004, 2011). We fit the following non-linear model to predict the fit of the alternate seed model from a smooth function of the connection similarity:
where y is the fit of the alternate seed model, C is the incoming or outgoing connection similarity of the respective seed region to iCPU (described above), and ε is an error term.
QUANTIFICATION AND STATISTICAL ANALYSIS
The number of samples or animals analyzed in each experiment, the statistical analysis performed, as well as the p-values for all results <0.05 are reported in the figure legends. For all in vivo experiments, the reported “n” represents the number of animals. For all cell culture experiments, “n” represents the number of separate cultures (e.g. one scraped or imaged well is reported as one “n”).
All cell culture data and in vivo non-pathological measures were analyzed in GraphPad Prism 7 using the noted statistical tests. In vivo pathological spread data was analyzed and all computations were performed in R (https://www.R-project.org/) (Team, 2018) as described.
DATA AND CODE AVAILABILITY
Primary data and code used to generate spread modeling is available on GitHub (https://github.com/ejcorn/GBAvsPBSDiffusion). Other primary data from the manuscript can be found on Mendeley (https://data.mendeley.com/datasets/43bss7kkcd/draft?a=f9cb5ca9-9b2d-4db1-849f-a61000bb8360).
Supplementary Material
KEY RESOURCES TABLE.
| REAGENT or RESOURCE | SOURCE | IDENTIFIER |
|---|---|---|
| Antibodies | ||
| Amyloid Precursor Protein (APP) | Millipore | Cat# MAB348; RRID:AB_94882 |
| α-synuclein | CNDR | Syn9027 |
| pS129 α-synuclein | CNDR | 81A |
| pS129 α-synuclein | Abcam | MJF-R13; Cat#ab168381; RRID:AB_2728613 |
| pS129 a α-synuclein | Abcam | EP1536Y; Cat#ab51253, RRID:AB_869973 |
| GAPDH | Advanced Immunological | Cat#2-RGM2; RRID:AB_2721282 |
| Glucocerebrosidase | Sigma-Aldrich | Cat#G4171; AB_1078958 |
| Glucocerebrosidase | Santa Cruz Biotech | Cat#sc-166407; RRID:AB_2109068 |
| Glial Fibrillary Acidic Protein | CNDR | 2.2B10 |
| Glial Fibrillary Acidic Protein | Agilent | Cat# Z0334; RRID:AB_10013382 |
| Iba-1 | Wako | Cat#019–19741, RRID:AB_839504 |
| Microtubule-associated protein 2 | CNDR | 17028 |
| NeuN | Millipore | Cat#MAB377; AB_2298772 |
| Tyrosine hydroxylase | Sigma-Aldrich | TH-16; Cat#T2928; RRID:AB_477569 |
| Bacterial and Virus Strains | ||
| BL21-Codon Plus (DE3)-RIL Competent Cells | Agilent Technologies | Cat#230245 |
| Biological Samples | ||
| Human brain tissue | See Table S1 | CNDR Brain Bank |
| Chemicals, Peptides, and Recombinant Proteins | ||
| Conduritol-β-epoxide | Cayman Chemical Company | Cat# 15216 |
| Conduritol-β-epoxide | MedChem Express | Cat# HY-100944 |
| Mouse α-synuclein | This manuscript | N/A |
| Human α-synuclein | This manuscript | N/A |
| BioPORTER Protein QuikEase Kit | Genlantis | Cat# BP509696 |
| Critical Commercial Assays | ||
| 4-Methylumbelliferyl β-D-glucopyranoside | Sigma-Aldrich | Cat# M3633 |
| Deposited Data | ||
| All primary data from this manuscript: https://data.mendeley.com/datasets/43bss7kkcd/draft7a=f9cb5ca9-9b2d-4db1-849f-a61000bb8360 | This manuscript | N/A |
| Primary data and code used for pathology spread mapping: https://github.com/ejcorn/GBAvsPBSDiffusion | This manuscript | N/A |
| Experimental Models: Cell Lines | ||
| HEK293 | Quantum Biotech Inc. | RRID:CVCL_0045 |
| Clone 10 (Human α-synuclein stably expressing) | CNDR; (Luk et al., 2009) | N/A |
| Experimental Models: Organisms/Strains | ||
| C57BL/6J Mice | Jackson Laboratory | JAX 000664; RRID: IMSR_JAX:000664 |
| CD1 Mice | Charles River Laboratory | Strain 022; RRID: IMSR_CRL:22 |
| Snca KO Mice | Jackson Laboratory | Cat# JAX:003692, RRID:IMSR_JAX:003692 |
| M83 (B6;C3-Tg(Prnp-SNCA*A53T)83Vle/J) Mice | Jackson Laboratory | JAX 004479; RRID: IMSR_JAX:004479 |
| M7 (Tg(Prnp-SNCA)7Vle) Mice | CNDR | (Giasson et al., 2002) |
| D409V KI (C57BL/6N-Gbatm1.1Mjff/J) Mice | Jackson Laboratory | JAX 019106; RRID:IMSR_JAX:019106 |
| Oligonucleotides | ||
| Recombinant DNA | ||
| pRK172-Ms α-synuclein | CNDR | N/A |
| pRK172-Hu α-synuclein | CNDR | N/A |
| Software and Algorithms | ||
| Prism 7 | GraphPad | RRID:SCR_002798 |
| R | R Core Team | RRID:SCR_001905 |
| Other | ||
Highlights.
GCase inhibition does not lead to α-synuclein aggregation in cell or animal models
Reducing GCase activity enhances pre-existing α-synuclein aggregation
GCase modulation of α-synuclein aggregation is not dependent on neuron type
GCase activity enhances α-synuclein pathology when pathological seeds are low
ACKNOWLEDGEMENTS
We would like to thank members of the laboratory for their feedback in developing this manuscript. We thank Dr. Norihito Uemura for reading and editing the manuscript. This study was supported by NIH grants: T32-AG000255, P30-AG10124, P50-NS053488. DSB also acknowledges support from the John D. and Catherine T. MacArthur Foundation, the ISI Foundation, the Alfred P. Sloan Foundation, the Paul G. Allen Foundation, the National Institute of Neurological Disorders and Stroke (R01 NS099348), and the National Science Foundation (BCS-1441502, BCS-1430087, NSF PHY-1554488 and BCS-1631550).
Footnotes
DECLARATION OF INTERESTS
The authors declare no competing interests.
Publisher's Disclaimer: This is a PDF file of an unedited manuscript that has been accepted for publication. As a service to our customers we are providing this early version of the manuscript. The manuscript will undergo copyediting, typesetting, and review of the resulting proof before it is published in its final form. Please note that during the production process errors may be discovered which could affect the content, and all legal disclaimers that apply to the journal pertain.
REFERENCES
- Aarsland D, Andersen K, Larsen JP, Lolk A, and Kragh-Sorensen P (2003). Prevalence and characteristics of dementia in Parkinson disease: an 8-year prospective study. Archives of neurology 60, 387–392. [DOI] [PubMed] [Google Scholar]
- Aflaki E, Borger DK, Moaven N, Stubblefield BK, Rogers SA, Patnaik S, Schoenen FJ, Westbroek W, Zheng W, Sullivan P, et al. (2016). A New Glucocerebrosidase Chaperone Reduces alpha-Synuclein and Glycolipid Levels in iPSC-Derived Dopaminergic Neurons from Patients with Gaucher Disease and Parkinsonism. J Neurosci 36, 7441–7452. [DOI] [PMC free article] [PubMed] [Google Scholar]
- Aflaki E, Westbroek W, and Sidransky E (2017). The Complicated Relationship between Gaucher Disease and Parkinsonism: Insights from a Rare Disease. Neuron 93, 737–746. [DOI] [PMC free article] [PubMed] [Google Scholar]
- Appel-Cresswell S, Vilarino-Guell C, Encarnacion M, Sherman H, Yu I, Shah B, Weir D, Thompson C, Szu-Tu C, Trinh J, et al. (2013). Alpha-synuclein p.H50Q, a novel pathogenic mutation for Parkinson’s disease. Movement disorders : official journal of the Movement Disorder Society 28, 811–813. [DOI] [PubMed] [Google Scholar]
- Baba M, Nakajo S, Tu PH, Tomita T, Nakaya K, Lee VM, Trojanowski JQ, and Iwatsubo T (1998). Aggregation of alpha-synuclein in Lewy bodies of sporadic Parkinson’s disease and dementia with Lewy bodies. The American journal of pathology 152, 879–884. [PMC free article] [PubMed] [Google Scholar]
- Barkhuizen M, Anderson DG, and Grobler AF (2016). Advances in GBA-associated Parkinson’s disease--Pathology, presentation and therapies. Neurochemistry international 93, 6–25. [DOI] [PubMed] [Google Scholar]
- Beach TG, Adler CH, Lue L, Sue LI, Bachalakuri J, Henry-Watson J, Sasse J, Boyer S, Shirohi S, Brooks R, et al. (2009). Unified staging system for Lewy body disorders: correlation with nigrostriatal degeneration, cognitive impairment and motor dysfunction. Acta neuropathologica 117, 613–634. [DOI] [PMC free article] [PubMed] [Google Scholar]
- Braak H, Del Tredici K, Bratzke H, Hamm-Clement J, Sandmann-Keil D, and Rub U (2002). Staging of the intracerebral inclusion body pathology associated with idiopathic Parkinson’s disease (preclinical and clinical stages). Journal of neurology 249 Suppl 3, III/1–5. [DOI] [PubMed] [Google Scholar]
- Braak H, Del Tredici K, Rub U, de Vos RA, Jansen Steur EN, and Braak E (2003). Staging of brain pathology related to sporadic Parkinson’s disease. Neurobiol Aging 24, 197–211. [DOI] [PubMed] [Google Scholar]
- Chartier-Harlin MC., Kachergu J., Roumie C., Mourou V., Doua X., Lincol S., Levecqu C., Larvo L., Andrieu J., Huliha M., et al. (2004). Alpha-synuclein locus duplication as a cause of familial Parkinson’s disease. Lancet 364, 1167–-1169.. [DOI] [PubMed] [Google Scholar]
- Chiasserini D, Paciotti S, Eusebi P, Persichetti E, Tasegian A, Kurzawa-Akanbi M, Chinnery PF, Morris CM, Calabresi P, Parnetti L, et al. (2015). Selective loss of glucocerebrosidase activity in sporadic Parkinson’s disease and dementia with Lewy bodies. Molecular neurodegeneration 10, 15. [DOI] [PMC free article] [PubMed] [Google Scholar]
- Covell DJ, Robinson JL, Akhtar RS, Grossman M, Weintraub D, Bucklin HM, Pitkin RM, Riddle D, Yousef A, Trojanowski JQ, et al. (2017). Novel conformation-selective alpha-synuclein antibodies raised against different in vitro fibril forms show distinct patterns of Lewy pathology in Parkinson’s disease. Neuropathology and applied neurobiology 43, 604–620. [DOI] [PMC free article] [PubMed] [Google Scholar]
- Dermentzaki G, Dimitriou E, Xilouri M, Michelakakis H, and Stefanis L (2013). Loss of beta-glucocerebrosidase activity does not affect alpha-synuclein levels or lysosomal function in neuronal cells. PloS one 8, e60674. [DOI] [PMC free article] [PubMed] [Google Scholar]
- Eitan E, Suire C, Zhang S, and Mattson MP (2016). Impact of lysosome status on extracellular vesicle content and release. Ageing research reviews 32, 65–74. [DOI] [PMC free article] [PubMed] [Google Scholar]
- Gegg ME, Burke D, Heales SJ, Cooper JM, Hardy J, Wood NW, and Schapira AH (2012). Glucocerebrosidase deficiency in substantia nigra of parkinson disease brains. Ann Neurol 72, 455–463. [DOI] [PMC free article] [PubMed] [Google Scholar]
- Gegg ME, Sweet L, Wang BH, Shihabuddin LS, Sardi SP, and Schapira AH (2015). No evidence for substrate accumulation in Parkinson brains with GBA mutations. Movement disorders : official journal of the Movement Disorder Society 30, 1085–1089. [DOI] [PMC free article] [PubMed] [Google Scholar]
- Giasson BI, Duda JE, Quinn SM, Zhang B, Trojanowski JQ, and Lee VM (2002). Neuronal alpha-synucleinopathy with severe movement disorder in mice expressing A53T human alpha-synuclein. Neuron 34, 521–533. [DOI] [PubMed] [Google Scholar]
- Goker-Alpan O, Schiffmann R, LaMarca ME, Nussbaum RL, McInerney-Leo A, and Sidransky E (2004). Parkinsonism among Gaucher disease carriers. Journal of medical genetics 41, 937–940. [DOI] [PMC free article] [PubMed] [Google Scholar]
- Guo JL, Covell DJ, Daniels JP, Iba M, Stieber A, Zhang B, Riddle DM, Kwong LK, Xu Y, Trojanowski JQ, et al. (2013). Distinct alpha-synuclein strains differentially promote tau inclusions in neurons. Cell 154, 103–117. [DOI] [PMC free article] [PubMed] [Google Scholar]
- Henderson MX, Chung CH, Riddle DM, Zhang B, Gathagan RJ, Seeholzer SH, Trojanowski JQ, and Lee VMY (2017). Unbiased proteomics of early Lewy body formation model implicates active microtubule affinity-regulating kinases (MARKs) in synucleinopathies. J Neurosci. [DOI] [PMC free article] [PubMed] [Google Scholar]
- Henderson MX, Cornblath EJ, Darwich A, Zhang B, Brown H, Gathagan RJ, Sandler RM, Bassett DS, Trojanowski JQ, and Lee VMY (2019). Spread of α-synuclein pathology through the brain connectome is modulated by selective vulnerability and predicted by network analysis. Nature Neuroscience 22, 1248–1257. [DOI] [PMC free article] [PubMed] [Google Scholar]
- Henderson MX, Peng C, Trojanowski JQ, and Lee VMY (2018). LRRK2 activity does not dramatically alter alpha-synuclein pathology in primary neurons. Acta neuropathologica communications 6, 45. [DOI] [PMC free article] [PubMed] [Google Scholar]
- Hong Ronald Chan W, Wildemeersch M, and Quek TQS (2015). Characterization and Control of Diffusion Processes in Multi-Agent Networks.
- Ibanez P, Bonnet AM, Debarges B, Lohmann E, Tison F, Pollak P, Agid Y, Durr A, and Brice A (2004). Causal relation between alpha-synuclein gene duplication and familial Parkinson’s disease. Lancet 364, 1169–1171. [DOI] [PubMed] [Google Scholar]
- Irwin DJ, White MT, Toledo JB, Xie SX, Robinson JL, Van Deerlin V, Lee VM, Leverenz JB, Montine TJ, Duda JE, et al. (2012). Neuropathologic substrates of Parkinson disease dementia. Ann Neurol 72, 587–598. [DOI] [PMC free article] [PubMed] [Google Scholar]
- Kanfer JN, Legler G, Sullivan J, Raghavan SS, and Mumford RA (1975). The Gaucher mouse. Biochemical and biophysical research communications 67, 85–90. [DOI] [PubMed] [Google Scholar]
- Karpowicz RJ Jr., Hane CM., Mihail TS., Sandle RM., Petersso EJ., and Le VM. (2017). Selective imaging of internalized proteopathic alpha-synuclein seeds in primary neurons reveals mechanistic insight into transmission of synucleinopathies. J Biol Chem 292, 13482–13497. [DOI] [PMC free article] [PubMed] [Google Scholar]
- Kasten M, and Klein C (2013). The many faces of alpha-synuclein mutations. Movement disorders : official journal of the Movement Disorder Society 28, 697–701. [DOI] [PubMed] [Google Scholar]
- Kiely AP, Asi YT, Kara E, Limousin P, Ling H, Lewis P, Proukakis C, Quinn N, Lees AJ, Hardy J, et al. (2013). alpha-Synucleinopathy associated with G51D SNCA mutation: a link between Parkinson’s disease and multiple system atrophy? Acta neuropathologica 125, 753–769. [DOI] [PMC free article] [PubMed] [Google Scholar]
- Kim S, Yun SP, Lee S, Umanah GE, Bandaru VVR, Yin X, Rhee P, Karuppagounder SS, Kwon SH, Lee H, et al. (2018). GBA1 deficiency negatively affects physiological alpha-synuclein tetramers and related multimers. Proc Natl Acad Sci U S A 115, 798–803. [DOI] [PMC free article] [PubMed] [Google Scholar]
- Kruger R, Kuhn W, Muller T, Woitalla D, Graeber M, Kosel S, Przuntek H, Epplen JT, Schols L, and Riess O (1998). Ala30Pro mutation in the gene encoding alpha-synuclein in Parkinson’s disease. Nature genetics 18, 106–108. [DOI] [PubMed] [Google Scholar]
- Kuo CL, Kallemeijn WW, Lelieveld LT, Mirzaian M, Zoutendijk I, Vardi A, Futerman AH, Meijer AH, Spaink HP, Overkleeft HS, et al. (2019). In vivo inactivation of glycosidases by conduritol B epoxide and cyclophellitol as revealed by activity-based protein profiling. The FEBS journal. [DOI] [PMC free article] [PubMed] [Google Scholar]
- Lee S, Sato Y, and Nixon RA (2011). Lysosomal proteolysis inhibition selectively disrupts axonal transport of degradative organelles and causes an Alzheimer’s-like axonal dystrophy. J Neurosci 31, 7817–7830. [DOI] [PMC free article] [PubMed] [Google Scholar]
- Luk KC, Kehm V, Carroll J, Zhang B, O’Brien P, Trojanowski JQ, and Lee VM (2012). Pathological alpha-synuclein transmission initiates Parkinson-like neurodegeneration in nontransgenic mice. Science 338, 949–953. [DOI] [PMC free article] [PubMed] [Google Scholar]
- Luk KC, Song C, O’Brien P, Stieber A, Branch JR, Brunden KR, Trojanowski JQ, and Lee VM (2009). Exogenous alpha-synuclein fibrils seed the formation of Lewy body-like intracellular inclusions in cultured cells. Proc Natl Acad Sci U S A 106, 20051–20056. [DOI] [PMC free article] [PubMed] [Google Scholar]
- Marshall J, McEachern KA, Kyros JA, Nietupski JB, Budzinski T, Ziegler RJ, Yew NS, Sullivan J, Scaria A, van Rooijen N, et al. (2002). Demonstration of feasibility of in vivo gene therapy for Gaucher disease using a chemically induced mouse model. Molecular therapy : the journal of the American Society of Gene Therapy 6, 179–189. [DOI] [PubMed] [Google Scholar]
- Mazzulli JR, Xu YH, Sun Y, Knight AL, McLean PJ, Caldwell GA, Sidransky E, Grabowski GA, and Krainc D (2011). Gaucher disease glucocerebrosidase and alpha-synuclein form a bidirectional pathogenic loop in synucleinopathies. Cell 146, 37–52. [DOI] [PMC free article] [PubMed] [Google Scholar]
- Mezias C, Rey N, Brundin P, and Raj A (2019). Neural connectivity predicts spreading of alpha-synuclein pathology in fibril-injected mouse models: Involvement of retrograde and anterograde axonal propagation. Neurobiology of disease 134, 104623. [DOI] [PMC free article] [PubMed] [Google Scholar]
- Murphy KE, Gysbers AM, Abbott SK, Tayebi N, Kim WS, Sidransky E, Cooper A, Garner B, and Halliday GM (2014). Reduced glucocerebrosidase is associated with increased alpha-synuclein in sporadic Parkinson’s disease. Brain : a journal of neurology 137, 834–848. [DOI] [PMC free article] [PubMed] [Google Scholar]
- N. Wood S(2006). Generalized Additive Models: An Introduction With R , Vol 66. [Google Scholar]
- Nalls MA, Duran R, Lopez G, Kurzawa-Akanbi M, McKeith IG, Chinnery PF, Morris CM, Theuns J, Crosiers D, Cras P, et al. (2013). A multicenter study of glucocerebrosidase mutations in dementia with Lewy bodies. JAMA neurology 70, 727–735. [DOI] [PMC free article] [PubMed] [Google Scholar]
- Oh SW, Harris JA, Ng L, Winslow B, Cain N, Mihalas S, Wang Q, Lau C, Kuan L, Henry AM, et al. (2014). A mesoscale connectome of the mouse brain. Nature 508, 207–214. [DOI] [PMC free article] [PubMed] [Google Scholar]
- Pandya S, Mezias C, and Raj A (2017). Predictive Model of Spread of Progressive Supranuclear Palsy Using Directional Network Diffusion. Frontiers in neurology 8, 692. [DOI] [PMC free article] [PubMed] [Google Scholar]
- Pasanen P., Myllykangas L., Siitonen M., Raunio A., Kaakkola S., Lyytinen J., Tienari PJ., Poyhonen M., and Paetau A. (2014). Novel alpha-synuclein mutation A53E associated with atypical multiple system atrophy and Parkinson’s disease-type pathology. Neurobiol Aging 35, 2180 e2181–2185. [DOI] [PubMed] [Google Scholar]
- Peng C, Gathagan RJ, Covell DJ, Medellin C, Stieber A, Robinson JL, Zhang B, Pitkin RM, Olufemi MF, Luk KC, et al. (2018). Cellular milieu imparts distinct pathological alpha-synuclein strains in alpha-synucleinopathies. Nature. [DOI] [PMC free article] [PubMed] [Google Scholar]
- Polymeropoulos MH, Lavedan C, Leroy E, Ide SE, Dehejia A, Dutra A, Pike B, Root H, Rubenstein J, Boyer R, et al. (1997). Mutation in the alpha-synuclein gene identified in families with Parkinson’s disease. Science 276, 2045–2047. [DOI] [PubMed] [Google Scholar]
- Proukakis C, Dudzik CG, Brier T, MacKay DS, Cooper JM, Millhauser GL, Houlden H, and Schapira AH (2013). A novel alpha-synuclein missense mutation in Parkinson disease. Neurology 80, 1062–1064. [DOI] [PMC free article] [PubMed] [Google Scholar]
- Raj A, Kuceyeski A, and Weiner M (2012). A network diffusion model of disease progression in dementia. Neuron 73, 1204–1215. [DOI] [PMC free article] [PubMed] [Google Scholar]
- Rocha EM, Smith GA, Park E, Cao H, Brown E, Hallett P, and Isacson O (2015a). Progressive decline of glucocerebrosidase in aging and Parkinson’s disease. Annals of clinical and translational neurology 2, 433–438. [DOI] [PMC free article] [PubMed] [Google Scholar]
- Rocha EM, Smith GA, Park E, Cao H, Graham AR, Brown E, McLean JR, Hayes MA, Beagan J, Izen SC, et al. (2015b). Sustained Systemic Glucocerebrosidase Inhibition Induces Brain alpha-Synuclein Aggregation, Microglia and Complement C1q Activation in Mice. Antioxidants & redox signaling 23, 550–564. [DOI] [PMC free article] [PubMed] [Google Scholar]
- Rockenstein E, Clarke J, Viel C, Panarello N, Treleaven CM, Kim C, Spencer B, Adame A, Park H, Dodge JC, et al. (2016). Glucocerebrosidase modulates cognitive and motor activities in murine models of Parkinson’s disease. Hum Mol Genet 25, 2645–2660. [DOI] [PMC free article] [PubMed] [Google Scholar]
- Rosenbloom B, Balwani M, Bronstein JM, Kolodny E, Sathe S, Gwosdow AR, Taylor JS, Cole JA, Zimran A, and Weinreb NJ (2011). The incidence of Parkinsonism in patients with type 1 Gaucher disease: data from the ICGG Gaucher Registry. Blood cells, molecules & diseases 46, 95102. [DOI] [PMC free article] [PubMed] [Google Scholar]
- Sacino AN, Brooks M, Thomas MA, McKinney AB, McGarvey NH, Rutherford NJ, Ceballos-Diaz C, Robertson J, Golde TE, and Giasson BI (2014). Amyloidogenic alpha-synuclein seeds do not invariably induce rapid, widespread pathology in mice. Acta neuropathologica 127, 645–665. [DOI] [PMC free article] [PubMed] [Google Scholar]
- Sidransky E, Nalls MA, Aasly JO, Aharon-Peretz J, Annesi G, Barbosa ER, Bar-Shira A, Berg D, Bras J, Brice A, et al. (2009). Multicenter analysis of glucocerebrosidase mutations in Parkinson’s disease. The New England journal of medicine 361, 1651–1661. [DOI] [PMC free article] [PubMed] [Google Scholar]
- Singleton AB, Farrer M, Johnson J, Singleton A, Hague S, Kachergus J, Hulihan M, Peuralinna T, Dutra A, Nussbaum R, et al. (2003). alpha-Synuclein locus triplication causes Parkinson’s disease. Science 302, 841. [DOI] [PubMed] [Google Scholar]
- Soria FN, Engeln M, Martinez-Vicente M, Glangetas C, Lopez-Gonzalez MJ, Dovero S, Dehay B, Normand E, Vila M, Favereaux A, et al. (2017). Glucocerebrosidase deficiency in dopaminergic neurons induces microglial activation without neurodegeneration. Hum Mol Genet 26, 2603–2615. [DOI] [PubMed] [Google Scholar]
- Spillantini MG, Crowther RA, Jakes R, Hasegawa M, and Goedert M (1998). alpha-Synuclein in filamentous inclusions of Lewy bodies from Parkinson’s disease and dementia with lewy bodies. Proc Natl Acad Sci U S A 95, 6469–6473. [DOI] [PMC free article] [PubMed] [Google Scholar]
- Spillantini MG, Schmidt ML, Lee VM, Trojanowski JQ, Jakes R, and Goedert M (1997). Alpha-synuclein in Lewy bodies. Nature 388, 839–840. [DOI] [PubMed] [Google Scholar]
- Taguchi YV, Liu J, Ruan J, Pacheco J, Zhang X, Abbasi J, Keutzer J, Mistry PK, and Chandra SS (2017). Glucosylsphingosine Promotes alpha-Synuclein Pathology in Mutant GBA-Associated Parkinson’s Disease. J Neurosci 37, 9617–9631. [DOI] [PMC free article] [PubMed] [Google Scholar]
- Tanik SA, Schultheiss CE, Volpicelli-Daley LA, Brunden KR, and Lee VM (2013). Lewy body-like alpha-synuclein aggregates resist degradation and impair macroautophagy. J Biol Chem 288, 15194–15210. [DOI] [PMC free article] [PubMed] [Google Scholar]
- Tanner CM, and Goldman SM (1996). Epidemiology of Parkinson’s disease. Neurologic clinics 14, 317–335. [DOI] [PMC free article] [PubMed] [Google Scholar]
- Tayebi N, Parisiadou L, Berhe B, Gonzalez AN, Serra-Vinardell J, Tamargo RJ, Maniwang E, Sorrentino Z, Fujiwara H, Grey RJ, et al. (2017). Glucocerebrosidase haploinsufficiency in A53T alpha-synuclein mice impacts disease onset and course. Molecular genetics and metabolism 122, 198–208. [DOI] [PMC free article] [PubMed] [Google Scholar]
- Team RC (2018). R: A Language and Environment for Statistical Computing.
- Uemura N, Koike M, Ansai S, Kinoshita M, Ishikawa-Fujiwara T, Matsui H, Naruse K, Sakamoto N, Uchiyama Y, Todo T, et al. (2015). Viable neuronopathic Gaucher disease model in Medaka (Oryzias latipes) displays axonal accumulation of alpha-synuclein. PLoS genetics 11, e1005065. [DOI] [PMC free article] [PubMed] [Google Scholar]
- Volpicelli-Daley LA, Luk KC, and Lee VM (2014). Addition of exogenous alpha-synuclein preformed fibrils to primary neuronal cultures to seed recruitment of endogenous alpha-synuclein to Lewy body and Lewy neurite-like aggregates. Nature protocols 9, 2135–2146. [DOI] [PMC free article] [PubMed] [Google Scholar]
- Volpicelli-Daley LA, Luk KC, Patel TP, Tanik SA, Riddle DM, Stieber A, Meaney DF, Trojanowski JQ, and Lee VM (2011). Exogenous alpha-synuclein fibrils induce Lewy body pathology leading to synaptic dysfunction and neuron death. Neuron 72, 57–71. [DOI] [PMC free article] [PubMed] [Google Scholar]
- Wood SN (2004). Stable and Efficient Multiple Smoothing Parameter Estimation for Generalized Additive Models. Journal of the American Statistical Association 99, 673–686. [Google Scholar]
- Wood SN (2011). Fast stable restricted maximum likelihood and marginal likelihood estimation of semiparametric generalized linear models. Journal of the Royal Statistical Society: Series B (Statistical Methodology) 73, 3–36. [Google Scholar]
- Zarranz JJ, Alegre J, Gomez-Esteban JC, Lezcano E, Ros R, Ampuero I, Vidal L, Hoenicka J, Rodriguez O, Atares B, et al. (2004). The new mutation, E46K, of alpha-synuclein causes Parkinson and Lewy body dementia. Ann Neurol 55, 164–173. [DOI] [PubMed] [Google Scholar]
- Zunke F, Moise AC, Belur NR, Gelyana E, Stojkovska I, Dzaferbegovic H, Toker NJ, Jeon S, Fredriksen K, and Mazzulli JR (2018). Reversible Conformational Conversion of alpha-Synuclein into Toxic Assemblies by Glucosylceramide. Neuron 97, 92–107 e110. [DOI] [PMC free article] [PubMed] [Google Scholar]
Associated Data
This section collects any data citations, data availability statements, or supplementary materials included in this article.
Supplementary Materials
Data Availability Statement
Primary data and code used to generate spread modeling is available on GitHub (https://github.com/ejcorn/GBAvsPBSDiffusion). Other primary data from the manuscript can be found on Mendeley (https://data.mendeley.com/datasets/43bss7kkcd/draft?a=f9cb5ca9-9b2d-4db1-849f-a61000bb8360).