

Abstract
Catalase is present in prokaryotic and eukaryotic organisms and is important for the protective effects of the antioxidant system against free radicals. Many studies have confirmed that catalase is required for the growth, development, and pathogenesis of bacteria, plants, animals, and fungi. However, there has been relatively little research on the catalases in oomycetes, which form an important group of fungus‐like eukaryotes that produce zoosporangia. In this study, we detected two Phytophthora infestans genes encoding catalases, but only PiCAT2 exhibited catalase activity in the sporulation stage and was highly produced during asexual reproduction and in the late infection stage. Compared with the wild‐type strain, the PiCAT2‐silenced P. infestans transformants were more sensitive to abiotic stress, were less pathogenic, and had a lower colony expansion rate and lower PiMPK7, PiVPS1, and PiGPG1 expression levels. In contrast, the PiCAT2‐overexpressed transformants were slightly less sensitive to abiotic stress. Interestingly, increasing and decreasing PiCAT2 expression from the normal level inhibited sporulation, germination, and infectivity, and down‐regulated PiCdc14 expression, but up‐regulated PiSDA1 expression. These results suggest that PiCAT2 is required for P. infestans mycelial growth, asexual reproduction, abiotic stress tolerance, and pathogenicity. However, a proper PiCAT2 level is critical for the formation and normal function of sporangia. Furthermore, PiCAT2 affects P. infestans sporangial formation and function, pathogenicity, and abiotic stress tolerance by regulating the expression of cell cycle‐related genes (PiCdc14 and PiSDA1) and MAPK pathway genes. Our findings provide new insights into catalase functions in eukaryotic pathogens.
Keywords: abiotic stress, appressorium, catalase, Phytophthora infestans, reactive oxygen species, sporulation
PiCAT2 is required for P. infestans asexual reproduction, abiotic stress tolerance, and pathogenicity; reducing or elevating catalase activity suppresses sporangia formation, germination, and appressoria formation.
1. INTRODUCTION
Hydrogen peroxide (H2O2) is a reactive oxygen species (ROS) that is constantly produced intracellularly as a normal metabolic by‐product through the electron transport chain in aerobic microorganisms (Apel and Hirt, 2004; Kowaltowski et al., 2009). In addition, H2O2 is relatively stable and able to pass freely through cell membranes (Branco et al., 2004). It acts as a signalling molecule during cellular differentiation and development in eukaryotes (Takemoto et al., 2007; Veal and Day, 2011; Tudzynski et al., 2012). However, excessive H2O2 is harmful for cell components, so its rapid and efficient removal is essential for aerobic organisms (Zamocky et al., 2008). Moreover, microorganisms must counteract the effects of environmental H2O2 due to redox reactions or the oxidative burst generated by the host during an invasion (Camejo et al., 2016).
The antioxidant effect of catalase involves the decomposition of H2O2 to form water (H2O) and oxygen (O2) (Kwok et al., 2004). This enzyme is produced by many prokaryotic and eukaryotic organisms (Zamocky et al., 2008). Together with superoxide dismutase and glutathione peroxidase, catalase plays a vital role in the antioxidant systems that protect against the adverse effects of free radicals (Blackman and Hardham, 2008; Ighodaro and Akinloye, 2018). Many studies have confirmed that catalase is required for the growth, development, and pathogenesis of various organisms (Wysong et al., 1998; Schriner et al., 2005; Pan et al., 2017; Wang et al., 2019). Moreover, organisms may contain multiple catalase genes that are required for various biological processes. For example, in Neurospora crassa, CAT‐1 is involved in oxidative stress responses (Wang et al., 2007), whereas CAT‐3 is required for growth and differentiation as well as for oxidative stress responses (Michán et al., 2003). In Beauveria bassiana, CatA affects pathogenicity and the tolerance to abiotic stresses, whereas CatB and CatC only influence the resistance to oxidative stress (Wang et al., 2013). However, there has been relatively little research on catalases in oomycetes, which form an important group of filamentous, multinucleate, and non‐fungal eukaryotes.
Oomycetes belong to the kingdom Stramenopila (Baldauf et al., 2000; Yoon et al., 2002), which includes diverse microorganisms living in marine, freshwater, and terrestrial environments (Sparrow, 1960; Karling, 1981). Many oomycetes are important pathogens of plants and animals, and cause severe economic losses. Examples include Phytophthora infestans, the causal pathogen of potato late blight, which resulted in the death of millions of people during the Irish potato famine in the 19th century (Birch and Whisson, 2001), and Pythium insidiosum, a unique pathogen of human and animals (Mendoza et al., 1993). The life cycle of oomycetes in the genus Phytophthora has been well studied. Phytophthora species reproduce asexually by producing sporangia. In response to cold shock conditions, sporangia cleave into zoospores, which swim, encyst, and germinate to form mycelia or a specialized infection structure (appressorium) on plants or on hydrophobic surfaces (Erwin and Ribeiro, 1996; Hardham, 2001). Sporangia can also germinate directly to produce mycelia or form an appressorium (Nowicki et al., 2012). Both sporangia and zoospores are important for dissemination and host infection (Lacy and Hammerschmidt, 1984).
Many factors, such as nutrient availability, humidity, oxygen levels, and pH, affect the formation of sporangia and the production of zoospores in Phytophthora species (Erwin and Ribeiro, 1996). Previous studies revealed that many genes, including those encoding cell cycle regulators, PiCdc14 (Ah‐Fong and Judelson, 2003) and PcSDA1 (Zhu et al., 2016), G protein β and γ subunits (Latijnhouwers and Govers, 2003; van den Hoogen et al., 2018), Myb and MADS‐box transcription factors (Xiang and Judelson, 2014; Leesutthiphonchai and Judelson, 2018), and the loricrin‐like protein PiLLP (Guo et al., 2017), are associated with the sporulation and pathogenicity of Phytophthora species. However, whether catalase activity affects the sporulation and pathogenicity of Phytophthora species remains unclear.
P. infestans is a destructive pathogen and a model oomycete species. A genomic analysis revealed that P. infestans has two catalase genes, PiCAT1 (PITG_15292) and PiCAT2 (PITG_15248). Published RNA‐sequencing data from Ah‐Fong et al. (2017) and microarray data from Haas et al. (2009) indicated that the PITG_15248 expression level is up‐regulated during asexual reproduction and in the late infection stage. A previous study proved that the silencing of PiLLP in P. infestans inhibits the formation of sporangia and decreases virulence as well as catalase activity (Guo et al., 2017). These findings suggest that catalase may be important for the asexual reproduction and pathogenesis of oomycetes. In this study, we functionally characterized PiCAT2 by analysing the phenotypes of PiCAT2‐silenced and ‐overexpressed transformants. The results of this study indicate that a proper PiCAT2 level is important for the growth, sporulation, sporangium function, abiotic stress tolerance, and virulence of oomycetes. Moreover, altering PiCAT2 activity affects the expression of genes related to sporulation, abiotic stress responses, and pathogenicity.
2. RESULTS
2.1. PiCAT2 is the major catalase gene in sporulation stage of P. infestans
A sequence analysis revealed that oomycetes contain one to four catalase genes. A phylogenetic analysis indicated that all oomycete catalases are clustered in one clade and have conserved sequences, including a typical catalase domain with no signal peptide. The P. infestans genome contains two catalase genes, PiCAT1 (PITG_15292; 1,539 bp) and PiCAT2 (PITG_15248; 1,569 bp), which are designated according to a published article (Blackman and Hardham, 2008) (Figure S1a). These two genes are located on supercontig1.35 and the encoded proteins are similar (71% amino acid sequence identity). Both proteins contain a catalase proximal active site, a proximal heme‐ligand signature, and residues thought to be important for the formation of tetramers (Gouet et al., 1995) (Figure S1b, Table S3). However, PiCAT2, but not PiCAT1, also has two peroxisomal‐targeting signals, SKL and PRL, both belonging to PTS1, at the C‐terminus (Figure S1b).
When the total proteins from sporulating P. infestans MX5‐1 hyphae were analysed by native‐PAGE, only one band was associated with catalase activity (Figure 1a). The results of a mass spectrometry analysis indicated that this band contained PiCAT2, but not PiCAT1 (Figure 1b), implying that PiCAT2 is the major catalase in the sporulation stage of P. infestans. Thus, we focused on PiCAT2 for the subsequent analyses.
Figure 1.
Catalase activity in sporulating hyphae of Phytophthora infestans. (a) In‐gel assay for measuring catalase activity. The corresponding bands stained with Coomassie brilliant blue (CBB) R250 were used for mass spectrometry. (b) Results of mass spectrometry analysis of catalases
2.2. PiCAT2 was highly expressed during asexual reproduction and in the late infection stage
To functionally characterize PiCAT2, we analysed the PiCAT2 transcript level in P. infestans at various developmental and infection stages. The quantitative reverse transcription polymerase chain reaction (RT‐qPCR) results revealed that PiCAT2 was highly expressed in sporangia, zoospores, cysts, and germinated cysts (Figure 2a). In infected potato leaf tissues, PiCAT2 was expressed at low levels during the early infection stage (1–2 days post‐inoculation, dpi), but the expression level increased significantly in the late infection stage (3–5 dpi) (Figure 2a). These results imply that PiCAT2 may be important for P. infestans sporulation and the infection of susceptible hosts.
Figure 2.
The expression pattern of mRNA and protein levels of PiCAT2 in Phytophthora infestans. (a) The expression pattern of PiCAT2 in various developmental stages. MY, mycelia; SP, sporangia; ZO, zoospores; CY, cysts; GC, germinated cysts. Leaflet of susceptible cv. Impala at 12 hr as well as at 1, 2, 3, 4, and 5 days after inoculation, in comparison to MY and at 0 hr (value 1.0). The ubiquitin‐conjugating enzyme (ubc) gene was used as an internal control. There were significant differences between the two biological replicates, but the expression of PiCAT2 showed the same trend in the two biological replicates. (b) Transcript levels of PiCAT1 and PiCAT2 in mycelia of wild‐type (WT), control (CK) and PiCAT2‐silenced transformants. The ubc gene was used as an internal control and the transcript level of PiCAT1 in WT was used as a reference (value 1.0). Three replicates were used for each treatment and the whole experiment was repeated with a different set of biological samples. The data are averages (and standard errors) of values from two biological replicates. Statistical significance was analysed using Student's t test between WT and each transformant (**p < .01). (c) In‐gel assay of catalase activity of sporulating hyphae. (d) Quantification of the PiCAT2 activities. Error bars show standard errors of two biological replicates
2.3. PiCAT2 activity affected mycelial growth and sporulation
To determine whether PiCAT2 affects P. infestans asexual development, we generated PiCAT2‐silenced transformants (STs) with a polyethylene glycol‐mediated protoplast transformation method. Three STs (C2ST7, C2ST10, and C2ST33) and a control (CK) strain were obtained. They were analysed regarding the PiCAT2 expression levels (Figure 2b) and the in‐gel catalase activities of sporulating hyphae (Figure 2c,d). In addition, the ROS level increased in STs (Figure S2). An examination of the PiCAT1 expression level indicated it was slightly higher in STs than in the wild‐type (WT) strain, but was much lower than the PiCAT2 expression level in the CK strain (Figure 2b). Moreover, the STs grew more slowly than the WT and CK strains (p < .01) and produced significantly fewer sporangia (Figure 3a–c). The ST sporangia were morphologically similar to the WT and CK sporangia (Figure 3a,d). However, the ST sporangia had a significantly lower indirect germination rate (through zoospore release) and direct germination rate (through germ‐tube production) compared with the WT and CK strains (Figure 3e,f). We also assessed the expression levels of neighbouring genes PITG_15247 and PITG_15249 in the PiCAT2‐silenced transformants. The expression levels of these two genes did not decrease consistently in the three STs compared with WT and CK strains (Figure S3). Therefore, the common characteristics of STs can be attributed to the silencing of the PiCAT2 gene. These results indicate that reducing the PiCAT2 level considerably affects the formation and the function of P. infestans sporangia.
Figure 3.
Asexual phenotypic characterization of PiCAT2‐silenced transformants (STs). (a) Mycelial growth, sporangia production and morphology of the wild‐type (WT), control (CK), and STs. Images were taken at 7 days after incubation on rye V8 agar. Bars indicate 5 mm, 0.5 mm, and 10 μm, respectively. (b) Statistics of colony diameters of WT, CK, and STs were based on 7 days of growth on rye V8 agar. (c) Number of sporangia of the WT, CK, and STs. (d) Length:width (LW) ratios from 50 sporangia per strain. (e) Sporangial suspension was incubated in a plate for 2 hr at 10 °C. The ratios of the number of empty sporangia to the total number of sporangia were calculated for each strain. (f) Sporangial suspension was incubated in 200 g/L pea broth at 18 °C. The numbers of germinated and ungerminated sporangia were counted under a microscope at time points (0, 1.5, 3, 4.5, 6, and 7.5 hr), and the percentages of the germinated sporangia to the total number of sporangia were calculated for each strain. Three replicates were used for each treatment and the whole experiment was repeated once. The data are averages (and standard errors) of values from two biological replicates. Statistical significance was analysed with Student's t test between WT and each transformant (**p < .01)
We also generated PiCAT2‐overexpressed transformants (OTs) via a polyethylene glycol‐mediated protoplast transformation method. Three OTs (C2OT11, C2OT12, and C2OT41) were obtained, and they were verified based on the PiCAT2 expression levels (Figure 4a) and the in‐gel catalase activities of sporulating hyphae (Figure 4b,c). Moreover, the ROS levels decreased in the OTs (Figure S2). The PiCAT1 transcript levels in the OTs were similar to that in the WT strain (Figure 4a). Furthermore, the OT colonies were denser than the WT and CK colonies, but there were no differences in the mycelial growth rates (Figure 5a,b). Interestingly, compared with the results for the WT, CK, and ST strains, the length:width ratio of the OT sporangia was smaller (Figure 5a,c), although no significant differences were observed in the width of sporangia. Similar to the STs, the OTs exhibited significantly inhibited sporangia production, with decreased zoospore release and sporangia germination rates (p < .01) (Figure 5a,d,e,f). These results suggested that high PiCAT2 levels are detrimental to P. infestans asexual development.
Figure 4.
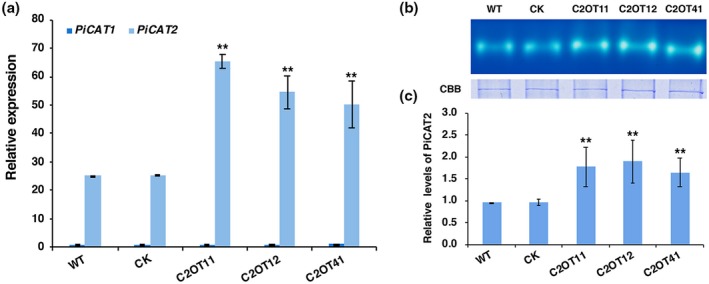
Detection of the mRNA and protein expression levels of PiCAT2 in wild‐type (WT), control (CK), and PiCAT2‐overexpressed transformants (OTs). (a) Transcript levels of PiCAT1 and PiCAT2 in mycelia of WT, CK and OTs. The ubc gene was used as an internal control and the transcript level of PiCAT1 in WT was used as a reference (value 1.0). Three replicates were used for each treatment and the whole experiment was repeated with a different set of biological samples. The data are averages (and standard errors) of values from two biological replicates. Statistical significance was analysed using Student's t test between WT and each transformant (**p < .01). (b) In‐gel assay of catalase activity of sporulating hyphae. (c) Quantification of the PiCAT2 activities. Error bars show standard errors of two biological replicates
Figure 5.
Asexual phenotypic characterization of PiCAT2‐overexpressed transformants (OTs). (a) Mycelial growth, sporangia production, and morphology of the wild‐type (WT), control (CK), and OTs. Images were taken at 7 days after incubation on rye V8 agar. Bars indicate 5 mm, 0.5 mm and 10 μm, respectively. (b) Statistics of colony diameters of WT, CK, and OTs were based on 7 days of growth on rye V8 agar. (c) Length:width (LW) ratios from 50 sporangia per strain. (d) Number of sporangia of the WT, CK, and OTs. (e) Sporangial suspension was incubated in a plate for 2 hr at 10 °C. The ratios of the number of empty sporangia to the total number of sporangia were calculated for each strain. (f) Sporangial suspension was incubated in 200 g/L pea broth at 18 °C. The numbers of germinated and ungerminated sporangia were counted under a microscope at different time points (0, 1.5, 3, 4.5, 6, and 7.5 hr), and the percentages of the germinated sporangia to the total number of sporangia were calculated for each strain. Three replicates were used for each treatment and the whole experiment was repeated once. The data are averages (and standard errors) of values from two biological replicates. Statistical significance was analysed with Student's t test between WT and each transformant (**p < .01)
2.4. PiCAT2 is important for P. infestans pathogenicity
To determine whether PiCAT2 is required for P. infestans pathogenicity, equivalent amounts of sporangia (based on the germination rate) were used to inoculate potato leaves (cv. Impala). An analysis of the infected leaves indicated the pathogenicity of the STs and OTs decreased significantly (Figure 6a,b). To determine the reasons for the decreased pathogenicity, inoculated leaf tissues were stained with 3,3′‐diaminobenzidine (DAB). No differences in ROS accumulation were detected between the leaves inoculated with the ST or OT strains and the leaves inoculated with the WT or CK strains (Figure 6a). However, the trypan blue staining results indicated there was less mycelia in the leaf tissues inoculated with STs or OTs than in the leaf tissues inoculated with the WT or CK strains. Because the appressorium produced by P. infestans sporangia is critical for the infection of susceptible hosts, we compared the appressorium formation of WT, CK, ST, and OT strains (Figure S4a). Appressorium formation was significantly lower for the STs and OTs (p < .01) than for the WT and CK strains (Figure S4b), implying that excessive and inadequate amounts of catalase adversely affect appressorium formation in P. infestans.
Figure 6.
Infection assay on detached potato leaflet of susceptible cv. Impala. (a) Each leaflet was inoculated with a mycelial plug or equivalent amounts of sporangia (based on the germination rate), then incubated at 21 °C with a 12‐hr light/12‐hr dark cycle. At 12 hr after the inoculation, the leaves were incubated in 1 mg/mL 3,3′‐diaminobenzidine (DAB) solution (pH 3.8) at room temperature for 8 hr and destained with ethanol. Five days after inoculation, leaves were boiled for c. 2 min in lactophenol–trypan blue and decolourized in1 g/mL chloral hydrate for 30–40 min, then observed under a light microscope. Bars indicate 50 µm. (b) Lesions induced by sporangia. (c) Lesions induced by mycelial plug. The diameter of each lesion was measured at 5 days after inoculation. Three replicates were used for each treatment in these tests and the whole experiment was repeated once. WT, wild‐type; CK, control; ST, PiCAT2‐silenced transformants; OT, PiCAT2‐overexpressed transformants. The data are averages (and standard errors) of values from two biological replicates. Statistical significance was analysed using Student's t test between wild‐type (WT) and each transformant (**p < .01)
To bypass the appressorium formation stage, we used mycelial plugs as inocula. At 5 days post‐inoculation, typical disease symptoms (i.e., water‐soaked lesions) were observed on the leaves inoculated with WT, CK, and OT strains, but not on leaves inoculated with the STs (Figure 6a,c). The DAB staining results revealed significantly more ROS accumulated in the leaves inoculated with STs than in the leaves infected with the WT, CK, or OT strains. Trypan blue staining also confirmed that there were few invading hyphae in leaf tissues inoculated with STs, whereas substantial amounts of hyphae were detected in leaf tissues inoculated with the WT, CK, or OT strains (Figure 6a). This finding indicates that ST mycelia did not scavenge plant‐derived ROS at the infection site.
To determine whether the lack of infection of STs is simply due to the slower growth of the STs, we added a slow‐growing transformant C2‐24, which grew significantly slower than STs but the PiCAT2 was not silenced (Figure S5a), in the pathogenicity test using mycelium as inoculum. At 3 dpi, the wounded and unwounded potato leaves were infected by WT, CK, and C2‐24, but not the STs (Figure S5b,c). Moreover, ROS accumulation on leaves inoculated by C2‐24 was not significantly different from that of WT (Figure S5d). These results show that lack of infection on leaves inoculated with the STs is not simply due to the slower growth of the silenced lines; the decreased catalase activity does play an important role.
2.5. PiCAT2 activity affected the expression of genes related to sporulation and pathogenicity
Previous investigations proved that the cell cycle‐related genes PiCdc14 and PcSDA1 are associated with oomycete sporulation (Ah‐Fong and Judelson, 2003; Zhu et al., 2016). Consequently, we analysed the expression levels of PiCdc14 (PITG_18578) and PiSDA1 (PITG_18755; homolog of PcSDA1 in P. capsici) in the STs and OTs. The PiCdc14 expression level was significantly lower in the STs and OTs than in the WT and CK strains, whereas the opposite pattern was observed for the PiSDA1 expression level. These results suggest that reducing and elevating PiCAT2 activity influences the expression of sporulation‐related genes (Figure 7a).
Figure 7.
Expression levels of genes in mycelia of wild‐type (WT), control (CK), PiCAT2‐silenced transformants (STs), and PiCAT2‐overexpressed transformants (OTs) by quantitative reverse transcription PCR. (a) Genes related to sporulation (PiCdc14 and PiSDA1). (b) Genes related to pathogenicity (PiMPK7, PiVPS1, and PiGPG1). Expression level in transformants was determined relative to that of ubc, as the internal reference, and WT was used as a reference (value 1.0). The data are averages (and standard errors) of values from two biological replicates. Statistical significance was analysed using Student's t test between CK and each transformant (**p < .01)
Previous studies determined that PsMPK7, PsVPS1, and PiGPG1 are pathogenicity‐related genes in oomycetes (Li et al., 2013; Gao et al., 2015; van den Hoogen et al., 2018). An analysis of the expression levels of these genes in the STs and OTs indicated that reducing the PiCAT2 activity significantly decreased the expression levels of PiMPK7 (PITG_07274), PiVPS1 (PITG_00183), and PiGPG1 (PITG_16898) (p < .01). However, elevating the PiCAT2 activity did not affect the expression of PiMPK7, PiVPS1, and PiGPG1. Therefore, reducing the PiCAT2 activity appears to affect the expression of pathogenicity‐related genes, including PiMPK7, PiVPS1, and PiGPG1 (Figure 7b).
2.6. PiCAT2 activity was important for oxidative and osmotic stress tolerance
In this study, PiMPK7 and PiCAT2 expression levels exhibited similar trends in STs. Considering that PsMPK7 is an abiotic stress response‐related gene in Phytophthora sojae (Gao et al., 2015), we tested the abiotic stress resistance of the STs and OTs by growing the strains on rye V8 agar (RVA) supplemented with H2O2, NaCl, or sorbitol (Figure 8a). Compared with the WT and CK strains, the STs and OTs were more and slightly less sensitive to abiotic stress, respectively (Figure 8a,b). These results imply that PiCAT2 activity is important for the resistance of P. infestans to abiotic stresses, including oxidative and osmotic stresses.
Figure 8.
PiCAT2 participates in the response to abiotic stress. (a) Colony expansion of wild‐type (WT), control (CK), PiCAT2‐silenced transformants (STs), and PiCAT2‐overexpressed transformants (OTs) on rye V8 agar supplemented with 0, 2 mM H2O2, 0.5 M NaCl, 1 M sorbitol, and cultured at 18 °C. (b) Colony diameters were measured after 7 days of growth. Relative growth inhibition rates were calculated based on colony diameters. Three replicates were used for each treatment in these tests and the whole experiment was repeated once. The data are averages (and standard errors) of values from two biological replicates. Statistical significance was analysed using Student's t test between CK and each transformant (*p < .05, **p < .01)
3. DISCUSSION
Catalase is crucial for maintaining the intracellular redox balance and is a required antioxidant that influences fungal growth, development, and pathogenesis (Aguirre et al., 2005; Skamnioti et al., 2007). In this study, we identified two P. infestans catalase genes that encode proteins with 71% amino acid sequence identity. A bioinformatics analysis proved that both catalases contain a typical catalase domain, but lack a signal peptide. However, only PiCAT2 peptides were identified in sporulating mycelia by mass spectrometry, probably due to the low expression of PiCAT1 and the sensitivity of mass spectrometry, indicating that PiCAT2 exhibits mainly catalase activity. Compared with the WT and CK strains, the STs grew more slowly and were more sensitive to abiotic stress, whereas the OTs were slightly less sensitive to abiotic stress. In addition, down‐regulating or up‐regulating PiCAT2 expression is inhibitory toward sporulation and the germination of sporangia. The data presented herein imply that PiCAT2 is required for P. infestans mycelial growth, asexual reproduction, and abiotic stress tolerance. Moreover, a proper PiCAT2 level is critical for the formation and normal function of sporangia.
Previous studies confirmed that catalase is required for the pathogenicity of fungi (Wysong et al., 1998; Huang et al., 2012; Yarden et al., 2014). In this study, we detected a significant decrease in the pathogenicity of the ST mycelia and sporangia, suggesting that catalase is also required for oomycete pathogenicity. The accumulation of plant‐derived ROS at the infection site is an early defence response in plants (Mellersh et al., 2002; Torres and Dangl, 2005). To successfully invade plant cells, plant pathogens must avoid being damaged by ROS through self‐protection and/or the scavenging of ROS. In this study, DAB staining revealed a significant increase in ROS accumulation in the leaves inoculated with ST mycelia, but not in the leaves infected with WT, CK, or OT mycelia. Hydrogen peroxide is a ROS that is converted to H2O and O2 via a reaction catalysed by catalase (Kwok et al., 2004). An earlier study demonstrated that in Magnaporthe grisea, CATB is required for appressorium formation, conidial penetration, and virulence (Skamnioti et al., 2007). Considered together, these results suggest that silencing PiCAT2 affects the pathogenicity of P. infestans by adversely affecting self‐protection and the scavenging of plant ROS.
Interestingly, the pathogenicity of the OT sporangia decreased, but not the mycelia. This inoculum‐related difference in pathogenicity is probably due to the differences in the infection processes of sporangia and mycelium. When sporangia land on a susceptible plant, they must form an appressorium and then an infection peg that penetrates the host epidermis to initiate a successful infection (Nowicki et al., 2012). However, mycelia can grow and enter plants through stomata, and do not need to form an appressorium (Judelson and Blanco, 2005). A further analysis of appressorium formation revealed that silencing and overexpressing PiCAT2 significantly inhibit appressorium formation. Trypan blue staining results indicated that considerable amounts of hyphae were present in leaf tissues inoculated with OT mycelia, but not in leaf tissues inoculated with OT sporangia. Accordingly, changes of PiCAT2 activity appear to inhibit appressorium formation, which then affects the ability of sporangia to infect plants. In oomycetes, sporangia are important for dissemination and the infection of hosts (Lacy and Hammerschmidt, 1984). Collectively, these results reveal that a proper PiCAT2 level is critical for P. infestans pathogenicity.
In multinucleate filamentous oomycetes, nuclear division and movement are essential for sporulation, zoospore release, and appressorium formation. Moreover, Cdc14 and SDA1 are conserved cell cycle regulators in eukaryotes. Specifically, Cdc14 is involved in mitosis and DNA damage repair (Mocciaro and Schiebel, 2010), whereas SDA1 is an important regulator of the actin cytoskeleton (Buscemi et al., 2000). A previous study proved that the MoCdc14 phosphatase is required for appressorium formation in Magnaporthe oryzae (Li et al., 2018). In oomycetes, Cdc14‐silenced transformants are reportedly defective regarding sporangia production and development (Ah‐Fong and Judelson, 2003). Moreover, silencing and overexpressing PcSDA1 inhibited sporangiophore formation, sporangial development, zoospore release, cyst germination, and decreased pathogenicity (Zhu et al., 2016). In this study, the production of sporangia as well as the zoospore release rate and the sporangial germination rate were adversely affected in the STs and OTs, in which PiCdc14 expression levels decreased and PiSDA1 expression levels increased. These results suggest that reducing and elevating PiCAT2 activity affects sporulation and the function of sporangia by altering PiCdc14 and PiSDA1 expression levels.
In eukaryotic organisms, mitogen‐activated protein kinases (MAPKs) help mediate the transduction of diverse extracellular signals that regulate growth, development, and infection processes (Chen and Thorner, 2007). In addition, the MAPK signalling network has many essential components, including MAPKs, vacuolar protein sorting proteins (VPSs), and G protein‐coupled receptors (Chen and Thorner, 2007; Zhao et al., 2007). In oomycetes, PsMPK7, PsVPS1, and PiGPG1 are pathogenicity‐related genes (Li et al., 2013; Gao et al., 2015; van den Hoogen et al., 2018). In this study, we observed that reducing PiCAT2 activity significantly down‐regulated the expression of these three genes, whereas elevating PiCAT2 activity did not affect PiMPK7, PiVPS1, and PiGPG1 expression. An earlier investigation indicated that PsMPK7 is also an abiotic stress response‐related gene in Phytophthora species (Gao et al., 2015). These results suggest that PiCAT2 affects the pathogenicity and abiotic stress tolerance of P. infestans by regulating the expression of MAPK pathway genes.
Hydrogen peroxide also functions as a signalling molecule and is required for many differentiation processes in eukaryotes (Veal et al., 2007; Veal and Day, 2011). Thus, our data support a proposed model regarding how PiCAT2 regulates P. infestans asexual reproduction, abiotic stress resistance, and pathogenicity (Figure 9). Briefly, during growth and development, P. infestans encounters endogenous and exogenous ROS, including H2O2, and needs catalase to maintain the intracellular redox balance. In the WT strain, ROS is maintained at a normal level, which is favourable for sporulation and the germination of sporangia (through zoospore release or germ‐tube production). Reducing and elevating catalase activity affects ROS accumulation and induces the down‐regulation of PiCdc14 expression and the up‐regulation of PiSDA1 expression, ultimately suppressing sporangia formation and germination as well as appressorium formation. The inhibition of appressorium formation restricts the ability of sporangia to infect susceptible hosts. Interestingly, the length:width ratio of the OT sporangia was smaller, but the underlying mechanism is unclear. Reducing catalase activity results in increased ROS levels, decreased pathogenicity, and the expression of abiotic stress‐related genes, including PiVPS1, PiGPG1, and PsMPK7. Elevating catalase activity decreases the ROS level, but does not affect the expression of PiMPK7, PiVPS1, and PiGPG1. Thus, OT mycelia exhibit increased abiotic stress resistance and remain pathogenic. However, the mechanism underlying the associated signal transduction and cross‐talk between genes remains to be investigated.
Figure 9.
A model of PiCAT2‐regulated sporulation of Phytophthora infestans. During growth and development, P. infestans encounters endogenous and exogenous reactive oxygen species (ROS) and needs catalase to maintain the intracellular redox balance. In the wild‐type strain, ROS is maintained at a normal level, which is favourable for sporulation and the germination of sporangia. In PiCAT2‐silenced or ‐overexpressed transformants, more or less catalase activity affects ROS accumulation, and induces the down‐regulation of PiCdc14 expression and the up‐regulation of PiSDA1 expression, ultimately suppressing sporangia formation and germination as well as appressorium formation
In previous studies related to catalases, gene knockout and complementation techniques were commonly used, and the results suggested that catalase is required for the growth and development of pathogens (Skamnioti et al., 2007; Wang et al., 2013). In our gene silencing and overexpression study, we revealed that a proper catalase level is critical for P. infestans growth and development, especially in sporangia. To the best of our knowledge, this is the first study to demonstrate that elevating catalase contents is detrimental to sporulation and the function of sporangia.
So far, localization of PiCAT2 is still unknown. Sequence analysis revealed that PiCAT2 has two peroxisomal‐targeting signals, SKL and PRL, both belonging to PTS1, at the C‐terminus (Figure S1b). Prediction using the online program pSORT (http://www.genscript.com/wolf-psort.html; Horton et al., 2007) and Euk‐mPLoc 2.0 (http://www.csbio.sjtu.edu.cn/bioinf/euk-multi-2/; Chou and Shen, 2010) suggested that PiCAT2 localized in mitochondria and peroxisomes. Because the GFP is poorly expressed in all the transformants of P. infestans, we detected the localization of PiCAT2‐GFP (GFP fused at C‐terminal) and GFP‐PiCAT2 (GFP fused at N‐terminal) in hyphae from regenerated protoplast of P. sojae strain P6497 (Figure S6). Both fusions displayed similar characteristics in transformants. Fluorescence localized to spherical to slightly elongated structures of various sizes in the cytoplasm, which matched the description of mitochondria and peroxisomes of Phytophthora (Ah‐Fong and Judelson, 2011). This result is consistent with the predicted localization. However, further investigation is needed for the precise location of PiCAT2. In conclusion, PiCAT2 is required for P. infestans asexual reproduction, abiotic stress tolerance, and pathogenicity. Elevating catalase production may enhance abiotic stress tolerance, but a proper PiCAT2 level is required for the formation and function of sporangia as well as pathogenicity. The data presented herein provide new insights into catalase functions in eukaryotic pathogens.
4. EXPERIMENTAL PROCEDURES
4.1. P. infestans strains and culture conditions
The P. infestans MX5‐1 isolate (Han et al., 2012) was used in this study. The WT and transformant strains were maintained on 10% RVA (Chang and Ko, 1991) at 18 °C in darkness. To test the abiotic stress sensitivities of each strain, culture blocks (5 mm in diameter) were placed on fresh RVA supplemented with 2 mM H2O2, 0.5 M NaCl, or 1 M sorbitol. Colony diameters were measured after incubating the cultures at 18 °C in darkness for 7 days. All experiments were performed twice, and each treatment was completed in triplicate.
4.2. Catalase gene analysis
Oomycete catalase gene sequences were retrieved from the DOE Joint Genome Institute (http://www.jgi.doe.gov/) and Ensembl Genomes (http://www.ensemblgenomes.org/) databases. Additional catalase genes were retrieved from the NCBI and KEGG databases for the following species: diatom (Thalassiosira pseudonana), protists (Tetrahymena thermophila and Paramecium tetraurelia), animals (Homo sapiens and Mus musculus), plant (Arabidopsis thaliana), and fungi (M. oryzae and Saccharomyces cerevisiae) (Table S1). The amino acid sequences encoded by these genes were aligned with ClustalW2 (http://www.ebi.ac.uk/Tools/msa/clustalw2/; Larkin et al., 2007). In addition, phylogenetic trees were constructed with the maximum likelihood evolution algorithm in MEGA 7.0 (Kumar et al., 2016). A Poisson correction was used for multiple substitution models and a pairwise deletion was used for handling missing data. Statistical accuracy was assessed with 1,000 bootstrap replicates.
4.3. RNA extraction and gene expression analysis
To determine the PiCAT2 transcript profiles during various P. infestans developmental stages, mycelium, sporangium, zoospore, cyst, and germinated cyst samples were collected (Wang et al., 2016b). To measure the PiCAT2 transcript levels during a P. infestans infection, potato (cv. Impala) leaves were inoculated with the P. infestans MX5‐1 sporangia. Each leaflet was spot‐inoculated with a 20‐μl sporangial suspension (104 sporangia/ml) and then incubated at 21 °C with a 12‐hr light/12‐hr dark cycle for 5 days (Guo et al., 2017). Lesion samples were collected at 0 and 12 hr as well as at 1, 2, 3, 4, and 5 days, and immediately placed in liquid nitrogen. Total RNA was extracted and gene expression was analysed as previously described (Wang et al., 2016b). The gene of ubiquitin‐conjugating enzyme (ubc, PITG_00505) in P. infestans was used as an internal control (Yan and Liou, 2006). Three replicates were used for each treatment and the whole experiment was repeated with two different sets of biological samples.
4.4. Plasmid construction and transformation of P. infestans
We used the pGFPN vector to construct transformation plasmids (Ah‐Fong and Judelson, 2011). The fragment of 5′ untranslated region (UTR, 147 bp) and 3′ UTR (137 bp) with highly specific sequence (less than 15 bp matched to other sequences in the genome of P. infestans based on sequence similarity search) and the open reading frame (ORF) of PiCAT2 were amplified by a PCR with specific primers (Table S2) and cDNA derived from P. infestans MX5‐1 as the template. The amplified 5′ UTR and 3′ UTR fragments were inserted in the anti‐sense orientation into the pGFPN vector digested with the restriction enzymes SacII and NheI to produce the gene silencing construct. The PiCAT2 ORF was inserted in the sense orientation into the pGFPN vector digested with the restriction enzyme NheI to produce the gene overexpression construct. The accuracy of the plasmid constructs was verified by DNA sequencing, after which the plasmids were used to transform P. infestans MX5‐1 as previously described (McLeod et al., 2008). The G418 resistance was used to select for transformants. To validate the transformants, the PiCAT2 transcript level was measured by RT‐qPCR.
4.5. In‐gel assay for measuring catalase activity
The catalase activities of WT, control (CK, i.e., harbouring an empty pGFPN vector), and transformant strains were assayed as described by Guo et al. (2017). Briefly, mycelia cultured in pea broth (200 g/L) for 5 days were collected. Each mycelial sample was ground in liquid nitrogen and then mixed with ice‐cold extraction buffer (50 mM HEPES pH 7.4, 137 mM NaCl, 10% glycerol, and protease inhibitors pepstatin A [1 μg/ml], leupeptin [1 μg/ml], and PMSF [1 mM]). Mixtures were centrifuged at 10,000 × g for 10 min at 4 °C, after which the supernatants were collected and used as crude extracts (Wang et al., 2016a). Protein concentrations were quantified with a protein assay dye (Bio‐Rad) (absorbance at 595 nm). An in‐gel assay was performed as described by Lledías et al. (1998). Equal amounts of total protein (20 µg) from the different strains (WT, CK, STs, and OTs) were loaded into a 7.5% native polyacrylamide slab gel. The gel was immersed in 7 mM H2O2 for 10 min after the electrophoresis, and then incubated in a 1:1 mixture of freshly prepared 1% potassium hexacyanoferrate (III) and 1% iron (III) chloride hexahydrate. The gel was stained blue except in zones where H2O2 was degraded by catalases (Harris and Hopkinson, 1987).
4.6. Phenotypic analysis of sporangia
The sporangia of each strain were collected by washing 12‐day‐old cultures with 200 g/L pea broth, then cultivated at 18 °C for a germination assay, or with 10 ml sterile water to count the sporangia and analyse zoospore release. Zoospores were generated by incubating the sporangial suspension at 10 °C for 2 hr and then at room temperature.
The in vitro appressorium formation rates of sporangia on cellulose membranes were calculated as described by Jiang et al. (1996). Specifically, a 20‐μl sporangial suspension (containing approximately 1,000 sporangia) was placed on a cellulose membrane attached to the underside of a potato leaf. After a 36‐hr incubation at 21 °C with a 12‐hr light/12‐hr dark cycle, the sporangia were washed and the appressorium formation rate (%) was calculated. All experiments were performed twice, and each treatment was completed in triplicate.
4.7. Pathogenicity test and analysis of the infection process
Pathogenicity was tested as described by Guo et al. (2017). For plant inoculations, a 20‐μl droplet of sporangial suspension containing approximately 1,000 sporangia for WT and CK strains and approximately 2,000 sporangia for the ST and OT strains was used to inoculate detached potato (cv. Impala) leaves. Potato leaves were also inoculated with a mycelial plug of the WT, CK, ST, and OT strains. Two detached leaves placed on water‐moistened filter paper in a Petri dish served as a replicate, and three plates were used for each treatment. Inoculated leaves were then incubated at 21 °C with a 12‐hr light/12‐hr dark cycle for 5 days. The size of each lesion was measured and analysed with Student's t test. Trypan blue staining was performed as described by Koch and Slusarenko (1990). The stained infected leaves were observed under a light microscope. At 12 hr after the inoculation, ROS were stained with the oxidant‐sensitive probe DAB (Sigma Aldrich) as described by Liu and Friesen (2012). Samples were analysed with an Olympus microscope. All experiments were performed twice.
4.8. Intracellular ROS assay
The sporulating mycelia of each strain grown on RVA for 5 days were collected and incubated with 10 μM fluorogenic probe (2′,7′‐dichlorodihydrofluorescein diacetate; Sigma Aldrich). The treated mycelia were analysed with the SP8 confocal laser‐scanning microscope (Leica Microsystems), with an excitation wavelength of 488 nm and an emission wavelength of 530 nm (Liu et al., 2018).
COMPETING INTERESTS
The authors declare that no competing interests exist.
Supporting information
FIGURE S1 Information for catalase in Phytophthora infestans. (a) Phylogenetic analysis of catalase. The phylogenetic tree was constructed with the domain sequences of catalase using the maximum likelihood evolution algorithm. Statistical accuracy was assessed with 1,000 bootstrap replicates. Bootstrap values ≥50 are shown near the tree nodes. (b) Amino acid sequence of PiCAT1 (PITG_15292) and PiCAT2 (PITG_15248). Amino acids in shaded regions are important for the tetramer formation. The wavy‐lined region indicates the catalase domain, the underlined region indicates the catalase proximal active site signature, while the boxed region indicates the catalase proximal heme‐ligand signature motif. The PTS1 of the PiCAT2 protein is shown in bold type
FIGURE S2 Intracellular ROS assay. Sporulation stages of WT, CK, ST (C2ST33), and OT (C2OT11) strain were incubated with 10 μM fluorogenic probe (2′,7′dichlorodihydrofluorescein diacetate; DCFH‐DA), followed by the fluorescent microscopic observation. Bars indicate 20 μm
FIGURE S3 Expression levels of genes flanking the silenced target PiCAT2. Expression levels of PITG_15247 and PITG_15249 in STs were determined relative to that of ubc, as the internal reference, and WT was used as a reference (value 1.0). The data are averages (and standard errors) of values from two biological replicates. Statistical significance was analysed using Student’s t test between CK and each transformant (*p < .05, **p < .01)
FIGURE S4 Appressorium formation of WT, CK, STs, and OTs. (a) Appressorium of WT, CK, ST (C2ST10), and OT (C2OT11) strains at 16 hr. Bars indicate 20 μm. (b) Comparison appressorium formation of WT, CK, STs, and OTs at 36 hr. The data are averages (and standard errors) of values from two biological replicates. Statistical significance was analysed using Student’s t test between WT and each transformant (**p < .01)
FIGURE S5 Colony diameters and pathogenicity of transformants with slow growth rate. (a) Statistics of colony diameters of WT, CK, and C2‐24 were based on 7 days of growth on RVA medium. (b) Each leaflet was inoculated with a mycelial plug, and then incubated at 21 °C with a 12‐hr light/12‐hr dark cycle. (c) Lesions induced by mycelia plug. The diameter of each lesion was measured at 3 days after inoculation. Three replicates were used for each treatment in these tests and the whole experiment was repeated once. The data are averages (and standard errors) of values from two biological replicates. Statistical significance was analysed using Student’s t test between WT and each transformant (**p < .01). (d) At 12 hr after the inoculation, the leaves were incubated in 1 mg/ml DAB solution (pH 3.8), at room temperature for 8 hr and destained with ethanol. Bars indicate 50 µm
FIGURE S6 Localization of PiCAT2 in Phytophthora sojae. Fluorescence from green fluorescent protein (GFP), PiCAT2‐GFP protein (with GFP at C‐terminal), and GFP‐PiCAT2 protein (with GFP at N‐terminal). Bars indicate 10 μm
TABLE S1 The catalase genes of Phytophthora infestans and other species
TABLE S2 Primers used in this study
TABLE S3 The information of catalases in Phytophthora infestans
ACKNOWLEDGMENTS
We sincerely thank Francine Govers (Wageningen University) for providing the pGFPN vector, and Brett M. Tyler (Oregon State University) and Zejian Guo (China Agricultural University) for helpful suggestions. This work was funded in part by the Special Fund for Agro‐Scientific Research in the Public Interest (201303018) and the Chinese Universities Scientific Fund (2017ZB001).
Wang T‐H, Wang X‐W, Zhu X‐Q, He Q, Guo L‐Y. A proper PiCAT2 level is critical for sporulation, sporangium function, and pathogenicity of Phytophthora infestans . Molecular Plant Pathology. 2020;21:460–474. 10.1111/mpp.12907
Funding information
This work was funded in part by the Special Fund for Agro‐Scientific Research in the Public Interest (201303018) and the Chinese Universities Scientific Fund (2017ZB001).
REFERENCES
- Aguirre, J. , Ríos‐Momberg, M. , Hewitt, D. and Hansberg, W. (2005) Reactive oxygen species and development in microbial eukaryotes. Trends in Microbiology, 13, 111–118. [DOI] [PubMed] [Google Scholar]
- Ah‐Fong, A.M.V. and Judelson, H.S. (2003) Cell cycle regulator Cdc14 is expressed during sporulation but not hyphal growth in the fungus‐like oomycete Phytophthora infestans . Molecular Microbiology, 50, 487–494. [DOI] [PubMed] [Google Scholar]
- Ah‐Fong, A.M.V. and Judelson, H.S. (2011) Vectors for fluorescent protein tagging in Phytophthora: tools for functional genomics and cell biology. Fungal Biology, 115, 882–890. [DOI] [PubMed] [Google Scholar]
- Ah‐Fong, A.M.V. , Kim, K.S. and Judelson, H.S. (2017) RNA‐seq of life stages of the oomycete Phytophthora infestans reveals dynamic changes in metabolic, signal transduction, and pathogenesis genes and a major role for calcium signaling in development. BMC Genomics, 18, 198. [DOI] [PMC free article] [PubMed] [Google Scholar]
- Apel, K. and Hirt, H. (2004) Reactive oxygen species: metabolism, oxidative stress, and signal transduction. Annual Review of Plant Biology, 55, 373–399. [DOI] [PubMed] [Google Scholar]
- Baldauf, S.L. , Roger, A.J. , Wenk‐Siefert, I. and Doolittle, W.F. (2000) A kingdom‐level phylogeny of eukaryotes based on combined protein data. Science, 290, 972–977. [DOI] [PubMed] [Google Scholar]
- Birch, P.R. and Whisson, S.C. (2001) Phytophthora infestans enters the genomics era. Molecular Plant Pathology, 2, 257–263. [DOI] [PubMed] [Google Scholar]
- Blackman, L.M. and Hardham, A.R. (2008) Regulation of catalase activity and gene expression during Phytophthora nicotianae development and infection of tobacco. Molecular Plant Pathology, 9, 495–510. [DOI] [PMC free article] [PubMed] [Google Scholar]
- Branco, M.R. , Marinho, H.S. , Cyrne, L. and Antunes, F. (2004) Decrease of H2O2 plasma membrane permeability during adaptation to H2O2 in Saccharomyces cerevisiae . Journal of Biological Chemistry, 279, 6501–6506. [DOI] [PubMed] [Google Scholar]
- Buscemi, G. , Saracino, F. , Masnada, D. and Carbone, M.L. (2000) The Saccharomyces cerevisiae SDA1 gene is required for actin cytoskeleton organization and cell cycle progression. Journal of Cell Science, 113, 1199–1211. [DOI] [PubMed] [Google Scholar]
- Camejo, D. , Guzman‐Cedeno, A. and Moreno, A. (2016) Reactive oxygen species, essential molecules, during plant–pathogen interactions. Plant Physiology and Biochemistry, 103, 10–23. [DOI] [PubMed] [Google Scholar]
- Chang, T.T. and Ko, W.H. (1991) Factors affecting germination of oospores of Phytophthora infestans . Journal of Phytopathology, 133, 29–35. [Google Scholar]
- Chen, R.E. and Thorner, J. (2007) Function and regulation in MAPK signaling pathways: lessons learned from the yeast Saccharomyces cerevisiae . Biochimica et Biophysica Acta, 1773, 1311–1340. [DOI] [PMC free article] [PubMed] [Google Scholar]
- Chou, K.C. and Shen, H.B. (2010) A new method for predicting the subcellular localization of eukaryotic proteins with both single and multiple sites: Euk‐mPLoc 2.0. PLoS One, 5, e9931. [DOI] [PMC free article] [PubMed] [Google Scholar]
- Erwin, D.C. and Ribeiro, O.K. (1996) Phytophthora Diseases Worldwide. St. Paul, MN: The American Phytopathological Society Press. [Google Scholar]
- Gao, J. , Cao, M. , Ye, W. , Li, H. , Kong, L. , Zheng, X. et al (2015) PsMPK7, a stress‐associated mitogen‐activated protein kinase (MAPK) in Phytophthora sojae, is required for stress tolerance, reactive oxygenated species detoxification, cyst germination, sexual reproduction and infection of soybean. Molecular Plant Pathology, 16, 61–70. [DOI] [PMC free article] [PubMed] [Google Scholar]
- Gouet, P. , Jouve, H.M. and Dideberg, O. (1995) Crystal structure of Proteus mirabilis PR catalase with and without bound NADPH. Journal of Molecular Biology, 249, 933–954. [DOI] [PubMed] [Google Scholar]
- Guo, T. , Wang, X.W. , Shan, K. , Sun, W. and Guo, L.Y. (2017) The Loricrin‐like protein (LLP) of Phytophthora infestans is required for oospore formation and plant infection. Frontiers in Plant Science, 8, 142. [DOI] [PMC free article] [PubMed] [Google Scholar]
- Haas, B.J. , Kamoun, S. , Zody, M.C. , Jiang, R.H. , Handsaker, R.E. , Cano, L.M. et al (2009) Genome sequence and analysis of the Irish potato famine pathogen Phytophthora infestans . Nature, 461, 393–398. [DOI] [PubMed] [Google Scholar]
- Han, M. , Liu, G. , Li, J.P. , Govers, F. , Zhu, X.Q. , Shen, C.Y. et al (2012) Phytophthora infestans field isolates from Gansu province, China are genetically highly diverse and show a high frequency of self fertility. Journal of Eukaryotic Microbiology, 60, 79–88. [DOI] [PubMed] [Google Scholar]
- Hardham, A.R. (2001) The cell biology behind Phytophthora pathogenicity. Australasian Plant Pathology, 30, 91–98. [Google Scholar]
- Harris, H. and Hopkinson, D.A. (1987) Handbook of Enzyme Electrophoresis in Human Genetics. Amsterdam: North‐Holland Press. [Google Scholar]
- Horton, P. , Park, K.J. , Obayashi, T. , Fujita, N. , Harada, H. , Adams‐Collier, C. et al (2007) WoLF PSORT: protein localization predictor. Nucleic Acids Research, 35, W585–587. [DOI] [PMC free article] [PubMed] [Google Scholar]
- Huang, Z. , Ali, S. and Ren, S. (2012) Catalase production influences germination, stress tolerance and virulence of Lecanicillium muscarium conidia. Biocontrol Science and Technology, 22, 249–260. [Google Scholar]
- Ighodaro, O.M. and Akinloye, O.A. (2018) First line defence antioxidants‐superoxide dismutase (SOD), catalase (CAT) and glutathione peroxidase (GPX): their fundamental role in the entire antioxidant defence grid. Alexandria Journal of Medicine, 54, 287–293. [Google Scholar]
- Jiang, J.Z. , Dao, J.J.Z. , Zheng, X.B. and Lu, J.Y. (1996) A new method for studying the interaction between Phytophthora infestans and plants before invasive use of cellulose membrane technology. Acta Phytopathologica Sinica, 26, 269–275. [Google Scholar]
- Judelson, H.S. and Blanco, F.A. (2005) The spores of Phytophthora: weapons of the plant destroyer. Nature Reviews Microbiology, 3, 47–58. [DOI] [PubMed] [Google Scholar]
- Karling, J.S. (1981) Predominantly Holocarpic and Eucarpic Simple Biflagellate Phycomycetes. Germany: J. Cramer. [Google Scholar]
- Koch, E. and Slusarenko, A. (1990) Arabidopsis is susceptible to infection by a downy mildew fungus. The Plant Cell, 2, 437–445. [DOI] [PMC free article] [PubMed] [Google Scholar]
- Kowaltowski, A.J. , De Souza‐Pinto, N.C. , Castilho, R.F. and Vercesi, A.E. (2009) Mitochondria and reactive oxygen species. Free Radical Biology and Medicine, 47, 333–343. [DOI] [PubMed] [Google Scholar]
- Kumar, S. , Stecher, G. and Tamura, K. (2016) MEGA7: molecular evolutionary genetics analysis version 7.0 for bigger datasets. Molecular Biology and Evolution, 33, 1870–1874. [DOI] [PMC free article] [PubMed] [Google Scholar]
- Kwok, L.Y. , Schlüter, D. , Clayton, C. and Soldati, D. (2004) The antioxidant systems in Toxoplasma gondii and the role of cytosolic catalase in defence against oxidative injury. Molecular Microbiology, 51, 47–61. [DOI] [PubMed] [Google Scholar]
- Lacy, M.L. and Hammerschmidt, R. (1984) Diseases of Potato: Late Blight. East Lansing, MI: Michigan State University, Cooperative Extension Service. [Google Scholar]
- Larkin, M.A. , Blackshields, G. , Brown, N.P. , Chenna, R. , McGettigan, P.A. , McWilliam, H. et al (2007) Clustal W and Clustal X version 2.0. Bioinformatics, 23, 2947–2948. [DOI] [PubMed] [Google Scholar]
- Latijnhouwers, M. and Govers, F. (2003) A Phytophthora infestans G‐Protein β subunit is involved in sporangium formation. Eukaryotic Cell, 2, 971–977. [DOI] [PMC free article] [PubMed] [Google Scholar]
- Leesutthiphonchai, W. and Judelson, H.S. (2018) A MADS‐box transcription factor regulates a central step in sporulation of the oomycete Phytophthora infestans . Molecular Microbiology, 110, 562–575. [DOI] [PubMed] [Google Scholar]
- Li, C. , Cao, S. , Zhang, C. , Zhang, Y. , Zhang, Q. , Xu, J.R. et al (2018) MoCDC14 is important for septation during conidiation and appressorium formation in Magnaporthe oryzae . Molecular Plant Pathology, 19, 328–340. [DOI] [PMC free article] [PubMed] [Google Scholar]
- Li, D. , Zhao, Z. , Huang, Y. , Lu, Z. , Yao, M. , Hao, Y. et al (2013) PsVPS1, a dynamin‐related protein, is involved in cyst germination and soybean infection of Phytophthora sojae . PLoS One, 8, e58623. [DOI] [PMC free article] [PubMed] [Google Scholar]
- Liu, Z. and Friesen, T. (2012) DAB staining and visualization of hydrogen peroxide in wheat leaves. Bioprotocols, 2, e309. [Google Scholar]
- Liu, P. , Wei, M. , Zhang, J. , Wang, R. , Li, B. , Chen, Q. et al (2018) Changes in mycelia growth, sporulation, and virulence of Phytophthora capsici when challenged by heavy metals (Cu2+, Cr2+ and Hg2+) under acid pH stress. Environmental Pollution, 235, 372–380. [DOI] [PubMed] [Google Scholar]
- Lledías, F. , Rangel, P. and Hansberg, W. (1998) Oxidation of catalase by singlet oxygen. Journal of Biological Chemistry, 273, 10630–10637. [DOI] [PubMed] [Google Scholar]
- Mcleod, A. , Fry, B.A. , Zuluaga, A.P. , Myers, K.L. and Fry, W.E. (2008) Toward improvements of oomycete transformation protocols. Journal of Eukaryotic Microbiology, 55, 103–109. [DOI] [PubMed] [Google Scholar]
- Mellersh, D.G. , Foulds, I.V. , Higgins, V.J. and Heath, M.C. (2002) H2O2 plays different roles in determining penetration failure in three diverse plant–fungal interactions. The Plant Journal, 29, 257–268. [DOI] [PubMed] [Google Scholar]
- Mendoza, L. , Hernandez, F. and Ajello, L. (1993) Life cycle of the human and animal oomycete pathogen Pythium insidiosum . Journal of Clinical Microbiology, 31, 2967–2973. [DOI] [PMC free article] [PubMed] [Google Scholar]
- Michán, S. , Lledías, F. and Hansberg, W. (2003) Asexual development is increased in Neurospora crassa cat‐3‐null mutant strains. Eukaryotic Cell, 2, 798–808. [DOI] [PMC free article] [PubMed] [Google Scholar]
- Mocciaro, A. and Schiebel, E. (2010) Cdc14: a highly conserved family of phosphatases with non‐conserved functions? Journal of Cell Science, 123, 2867–2876. [DOI] [PubMed] [Google Scholar]
- Nowicki, M. , Lichocka, M. , Nowakowska, M. , Kłosińska, U. , Golik, P. and Kozik, E.U. (2012) A simple dual stain for detailed investigations of plant–fungal pathogen interactions. Vegetable Crops Research Bulletin, 77, 61–74. [Google Scholar]
- Pan, X. , Wu, J. , Xu, S. , Duan, Y. and Zhou, M. (2017) CatB is critical for total catalase activity and reduces bactericidal effects of phenazine‐1‐carboxylic acid on Xanthomonas oryzae pv. oryzae and X. oryzae pv. oryzicola . Phytopathology, 107, 163–172. [DOI] [PubMed] [Google Scholar]
- Schriner, S.E. , Linford, N.J. , Martin, G.M. , Treuting, P. , Ogburn, C.E. , Emond, M. et al (2005) Extension of murine life span by overexpression of catalase targeted to mitochondria. Science, 308, 1909–1911. [DOI] [PubMed] [Google Scholar]
- Skamnioti, P. , Henderson, C. , Zhang, Z. , Robinson, Z. and Gurr, S.J. (2007) A novel role for catalase B in the maintenance of fungal cell‐wall integrity during host invasion in the rice blast fungus Magnaporthe grisea . Molecular Plant‐Microbe Interactions, 20, 568–580. [DOI] [PubMed] [Google Scholar]
- Sparrow, F.K. (1960) Aquatic Phycomycetes. Ann Arbor, MI: University of Michigan Press. [Google Scholar]
- Takemoto, D. , Tanaka, A. and Scott, B. (2007) NADPH oxidases in fungi: diverse roles of reactive oxygen species in fungal cellular differentiation. Fungal Genetics and Biology, 44, 1065–1076. [DOI] [PubMed] [Google Scholar]
- Torres, M.A. and Dangl, J.L. (2005) Functions of the respiratory burst oxidase in biotic interactions, abiotic stress and development. Current Opinion in Plant Biology, 8, 397–403. [DOI] [PubMed] [Google Scholar]
- Tudzynski, P. , Heller, J. and Siegmund, U. (2012) Reactive oxygen species generation in fungal development and pathogenesis. Current Opinion in Microbiology, 15, 653–659. [DOI] [PubMed] [Google Scholar]
- Van Den Hoogen, J. , Verbeek‐De Kruif, N. and Govers, F. (2018) The G‐protein γ subunit of Phytophthora infestans is involved in sporangial development. Fungal Genetics and Biology, 116, 73–82. [DOI] [PubMed] [Google Scholar]
- Veal, E. and Day, A. (2011) Hydrogen peroxide as a signaling molecule. Antioxidants & Redox Signaling, 15, 147–151. [DOI] [PubMed] [Google Scholar]
- Veal, E.A. , Day, A.M. and Morgan, B.A. (2007) Hydrogen peroxide sensing and signaling. Molecular Cell, 26, 1–14. [DOI] [PubMed] [Google Scholar]
- Wang, W. , Cheng, Y. , Chen, D. , Liu, D. , Hu, M. , Dong, J. et al (2019) The catalase gene family in cotton: genome‐wide characterization and bioinformatics analysis. Cells, 8, 86. [DOI] [PMC free article] [PubMed] [Google Scholar]
- Wang, Y. , Dong, Q. , Ding, Z. , Gai, K. , Han, X. , Kaleri, F.N. et al (2016a) Regulation of Neurospora Catalase‐3 by global heterochromatin formation and its proximal heterochromatin region. Free Radical Biology and Medicine, 99, 139–152. [DOI] [PubMed] [Google Scholar]
- Wang, X.W. , Guo, L.Y. , Han, M. and Shan, K. (2016b) Diversity, evolution and expression profiles of histone acetyltransferases and deacetylases in oomycetes. BMC Genomics, 17, 927. [DOI] [PMC free article] [PubMed] [Google Scholar]
- Wang, N. , Yoshida, Y. and Hasunuma, K. (2007) Loss of Catalase‐1 (Cat‐1) results in decreased conidial viability enhanced by exposure to light in Neurospora crassa . Molecular Genetics and Genomics, 277, 13–22. [DOI] [PubMed] [Google Scholar]
- Wang, Z.L. , Zhang, L.B. , Ying, S.H. and Feng, M.G. (2013) Catalases play differentiated roles in the adaptation of a fungal entomopathogen to environmental stresses. Environmental Microbiology, 15, 409–418. [DOI] [PubMed] [Google Scholar]
- Wysong, D.R. , Christin, L. , Sugar, A.M. , Robbins, P.W. and Diamond, R.D. (1998) Cloning and sequencing of a Candida albicans catalase gene and effects of disruption of this gene. Infection and Immunity, 66, 1953–1961. [DOI] [PMC free article] [PubMed] [Google Scholar]
- Xiang, Q. and Judelson, H.S. (2014) Myb transcription factors and light regulate sporulation in the oomycete Phytophthora infestans . PLoS One, 9, e92086. [DOI] [PMC free article] [PubMed] [Google Scholar]
- Yan, H.Z. and Liou, R.F. (2006) Selection of internal control genes for real‐time quantitative RT‐PCR assays in the oomycete plant pathogen Phytophthora parasitica . Fungal Genetics and Biology, 43, 430–438. [DOI] [PubMed] [Google Scholar]
- Yarden, O. , Veluchamy, S. , Dickman, M.B. and Kabbage, M. (2014) Sclerotinia sclerotiorum catalase SCAT1 affects oxidative stress tolerance, regulates ergosterol levels and controls pathogenic development. Physiological and Molecular Plant Pathology, 85, 34–41. [Google Scholar]
- Yoon, H.S. , Hackett, J.D. and Bhattacharya, D. (2002) A single origin of the peridinin‐and fucoxanthin‐containing plastids in dinoflagellates through tertiary endosymbiosis. Proceedings of the National Academy of Sciences of the United States of America, 99, 11724–11729. [DOI] [PMC free article] [PubMed] [Google Scholar]
- Zamocky, M. , FurtmüLler, P.G. and Obinger, C. (2008) Evolution of catalases from bacteria to humans. Antioxidants & Redox Signaling, 10, 1527–1548. [DOI] [PMC free article] [PubMed] [Google Scholar]
- Zhao, X. , Mehrabi, R. and Xu, J.R. (2007) Mitogen‐activated protein kinase pathways and fungal pathogenesis. Eukaryotic Cell, 6, 1701–1714. [DOI] [PMC free article] [PubMed] [Google Scholar]
- Zhu, C. , Yang, X. , Lv, R. , Li, Z. , Ding, X. , Tyler, B.M. et al (2016) Phytophthora capsici homologue of the cell cycle regulator SDA1 is required for sporangial morphology, mycelial growth and plant infection. Molecular Plant Pathology, 17, 369–387. [DOI] [PMC free article] [PubMed] [Google Scholar]
Associated Data
This section collects any data citations, data availability statements, or supplementary materials included in this article.
Supplementary Materials
FIGURE S1 Information for catalase in Phytophthora infestans. (a) Phylogenetic analysis of catalase. The phylogenetic tree was constructed with the domain sequences of catalase using the maximum likelihood evolution algorithm. Statistical accuracy was assessed with 1,000 bootstrap replicates. Bootstrap values ≥50 are shown near the tree nodes. (b) Amino acid sequence of PiCAT1 (PITG_15292) and PiCAT2 (PITG_15248). Amino acids in shaded regions are important for the tetramer formation. The wavy‐lined region indicates the catalase domain, the underlined region indicates the catalase proximal active site signature, while the boxed region indicates the catalase proximal heme‐ligand signature motif. The PTS1 of the PiCAT2 protein is shown in bold type
FIGURE S2 Intracellular ROS assay. Sporulation stages of WT, CK, ST (C2ST33), and OT (C2OT11) strain were incubated with 10 μM fluorogenic probe (2′,7′dichlorodihydrofluorescein diacetate; DCFH‐DA), followed by the fluorescent microscopic observation. Bars indicate 20 μm
FIGURE S3 Expression levels of genes flanking the silenced target PiCAT2. Expression levels of PITG_15247 and PITG_15249 in STs were determined relative to that of ubc, as the internal reference, and WT was used as a reference (value 1.0). The data are averages (and standard errors) of values from two biological replicates. Statistical significance was analysed using Student’s t test between CK and each transformant (*p < .05, **p < .01)
FIGURE S4 Appressorium formation of WT, CK, STs, and OTs. (a) Appressorium of WT, CK, ST (C2ST10), and OT (C2OT11) strains at 16 hr. Bars indicate 20 μm. (b) Comparison appressorium formation of WT, CK, STs, and OTs at 36 hr. The data are averages (and standard errors) of values from two biological replicates. Statistical significance was analysed using Student’s t test between WT and each transformant (**p < .01)
FIGURE S5 Colony diameters and pathogenicity of transformants with slow growth rate. (a) Statistics of colony diameters of WT, CK, and C2‐24 were based on 7 days of growth on RVA medium. (b) Each leaflet was inoculated with a mycelial plug, and then incubated at 21 °C with a 12‐hr light/12‐hr dark cycle. (c) Lesions induced by mycelia plug. The diameter of each lesion was measured at 3 days after inoculation. Three replicates were used for each treatment in these tests and the whole experiment was repeated once. The data are averages (and standard errors) of values from two biological replicates. Statistical significance was analysed using Student’s t test between WT and each transformant (**p < .01). (d) At 12 hr after the inoculation, the leaves were incubated in 1 mg/ml DAB solution (pH 3.8), at room temperature for 8 hr and destained with ethanol. Bars indicate 50 µm
FIGURE S6 Localization of PiCAT2 in Phytophthora sojae. Fluorescence from green fluorescent protein (GFP), PiCAT2‐GFP protein (with GFP at C‐terminal), and GFP‐PiCAT2 protein (with GFP at N‐terminal). Bars indicate 10 μm
TABLE S1 The catalase genes of Phytophthora infestans and other species
TABLE S2 Primers used in this study
TABLE S3 The information of catalases in Phytophthora infestans