

Abstract
Background and Purpose
HM01, a novel, orally bioavailable, brain‐penetrating agonist of ghrelin receptors, ameliorates emesis in Suncus murinus. This study compared HM01's activity against motion sickness with that of the less brain‐penetrating ghrelin receptor agonist, HM02.
Experimental Approach
The potential of HM01 and HM02 to relax isolated mesenteric arteries and to increase feeding was investigated. Radio telemetry was used to record gastric slow waves and body temperature. Plethysmography was used to measure respiratory function. HM01 and HM02 were administered p.o. 1 hr prior to provocative motion, and c‐Fos expression in brain sections was assessed.
Key Results
HM01 and HM02 both relaxed precontracted arteries, yielding EC50 values of 2.5 ± 0.5 and 3.5 ± 0.4 nM respectively. HM01 increased feeding, but HM02 did not. Both compounds caused hypothermia and bradygastria. Motion induced 123 ± 24 emetic events. HM01, but not HM02, reduced motion‐induced emesis by 67.6%. Motion increased c‐Fos expression in the nucleus tractus solitarius (NTS), dorsal motor nucleus of the vagus (DMNV), medial vestibular nucleus (MVe), central nucleus of the amygdala, and paraventricular hypothalamic nucleus (PVH). HM01 alone increased c‐Fos expression in the area postrema, NTS, DMNV, PVH, and arcuate hypothalamic nucleus; HM02 had a similar pattern except it did not increase c‐Fos in the PVH. Both compounds antagonized the motion‐induced increases in c‐Fos expression in the MVe.
Conclusions and Implications
HM01 is more effective than HM02 in preventing motion‐induced emesis. The difference in potency may relate to activation of ghrelin receptors in the PVH.
Abbreviations
- AP
area postrema
- Arc
arcuate nucleus
- CeA
central nucleus of the amygdala
- cpm
cycle per minute
- DF
dominant frequency
- DMNV
dorsal motor nucleus of the vagus
- DP
dominant power
- GMA
gastric myoelectric activity
- HM01
1′‐[(1S)‐1‐(2,3‐dichloro‐4‐methoxyphenyl)ethyl]‐3‐methyl‐3‐[(4R)‐1‐methyl‐3,3‐dimethyl‐4‐piperidyl]urea
- HM02
N′‐[(1S)‐1‐(2,3‐dichloro‐4‐methoxyphenyl)ethyl]‐N‐hydroxy‐N‐(1‐methyl‐4‐piperidinyl)‐urea
- MVe
medial vestibular nucleus
- NTS
nucleus tractus solitarius
- PVH
paraventricular nucleus of hypothalamus
What is already known
HM01 could antagonize provocative motion‐induced emesis in Suncus murinus.
What this study adds
Centrally located ghrelin receptors in the brain are critically involved in emesis control.
Anti‐emetic potency of HM01 may relate to an activation of ghrelin receptors in PVH.
What is the clinical significance
Ghrelin receptors provide a promising target for anti‐motion sickness drug development.
1. INTRODUCTION
Motion sickness occurs in susceptible individuals during journeys by car, train, boat, and aeroplanes (Golding, 2006). It also occurs during space exploration (Lackner & DiZio, 2006). It is characterized by a cluster of variable signs and symptoms including cold sweating, facial pallor, drowsiness, hypersalivation, “stomach awareness,” and nausea (Golding & Gresty, 2015). The most widely accepted mechanism of motion sickness is described by “sensory‐mismatch theory,” which proposes that sensory conflict and neural mismatch between converging patterns of vestibular, visual, and proprioceptive input patterns perturbs the response (Reason, 1978; Reason & Brand, 1975). Anti‐muscarinics, such as https://www.guidetopharmacology.org/GRAC/LigandDisplayForward?ligandId=330 and antihistamines (H1 receptor antagonists), such as https://www.guidetopharmacology.org/GRAC/LigandDisplayForward?ligandId=7282, are the most common treatments for motion sickness (Golding & Gresty, 2015; Schmäl, 2013), but they are variably efficacious and are associated with unwanted side effects such as sedation, drowsiness, blurred vision, depression, and dry mouth/nose/throat (Schmäl, 2013; Spinks & Wasiak, 2011).
https://www.guidetopharmacology.org/GRAC/LigandDisplayForward?ligandId=3597 is an orexigenic peptide that was originally isolated from rat stomach extracts (Kojima et al., 1999). It is also synthesized in the hypothalamic arcuate nucleus (Arc), although the number of ghrelin‐producing neurons is low (Kojima et al., 1999). Ghrelin activates growth hormone secretagogue 1A receptors, which were defined as http://www.guidetopharmacology.org/GRAC/ObjectDisplayForward?objectId=246&familyId=28&familyType=GPCRs (nomenclature as agreed by the NC‐IUPHAR subcommittee for ghrelin receptor) to exert a variety of biological effects including an ability to increase growth hormone secretion, stimulate feeding, and increase gastrointestinal motility and gastric acid secretion (Callaghan & Furness, 2014; Kitazawa, De Smet, Verbeke, Depoortere, & Peeters, 2005; Kojima & Kangawa, 2005; Sanger, Broad, Callaghan, & Furness, 2017). It has been hypothesized that ghrelin, or ghrelin mimetics, may be useful in situations where gastrointestinal motility is disturbed and/or appetite is suppressed, for example, in diabetic gastroparesis or post‐operative ileus (Sanger, 2008; Sanger et al., 2017). Our previous studies showed that ghrelin ameliorates https://www.guidetopharmacology.org/GRAC/LigandDisplayForward?ligandId=5343‐induced acute emesis in ferrets via central actions in the brain (Rudd et al., 2006). Our latest studies showed that a new orally bioavailable, brain‐penetrating, ghrelin receptor agonist, 1‐[(1S)‐1‐(2,3‐dichloro‐4‐methoxyphenyl)ethyl]‐3‐methyl‐3‐[(4R)‐1‐methyl‐3,3‐dimethyl‐4‐piperidyl]urea (HM01), can ameliorate cisplatin‐induced acute emesis in Suncus murinus and enhance the control of emesis by a combination of https://www.guidetopharmacology.org/GRAC/FamilyDisplayForward?familyId=68 and https://www.guidetopharmacology.org/GRAC/ObjectDisplayForward?objectId=360 receptor antagonists, such as a https://www.guidetopharmacology.org/GRAC/LigandDisplayForward?ligandId=7486 and https://www.guidetopharmacology.org/GRAC/LigandDisplayForward?ligandId=5742 anti‐emetic regimen (Rudd et al., 2018). HM01 also ameliorated provocative motion‐induced emesis (Rudd et al., 2018).
In a study of visually induced nausea in human subjects, compared with non‐susceptible subjects, nausea‐sensitive individuals had a lower level of plasma ghrelin and a lower normogastria/tachygastria ratio, which refers to electrical activities derived indirectly via EGG measures taken on the wall of the abdomen (Farmer et al., 2015). In S. murinus, emesis induced by provocative motion is associated with an increase in the percentage power in the bradygastric range and a concomitant decrease in the normogastric range (Tu et al., 2017). Evidence from molecular studies shows that ghrelin and ghrelin receptors are present in S. murinus (Ishida et al., 2009; Suzuki et al., 2012). More specifically, ghrelin mRNA was expressed in all parts of gastrointestinal tract, kidney, and ovary; ghrelin receptor was detected throughout the stomach and intestine and also found in the hypothalamus, medulla oblongata, adrenal gland, nodose ganglion, and pituitary gland in this species (Ishida et al., 2009; Suzuki et al., 2012). Although HM01 can ameliorate motion‐induced emesis, it is not known whether ghrelin receptors in the brain or periphery are critical to the mechanisms or to the changes in normogastria associated with the symptomology. In this study, the anti‐emetic potential of HM01 was compared with the ghrelin mimetic N′‐[(1S)‐1‐(2,3‐dichloro‐4‐methoxyphenyl)ethyl]‐N‐hydroxy‐N‐(1‐methyl‐4‐piperidinyl)‐urea (HM02), which is more restricted to the periphery, against provocative motion‐induced emesis in S. murinus (Karasawa et al., 2014; Mohammadi, Pietra, Giuliano, Fugang, & Greenwood‐Van Meerveld, 2019). The two compounds emerged from a screening programme aimed at identifying potent and selective ghrelin agonists with non‐peptidic structures. Kinetic studies of HM02 revealed that brain:plasma ratio is 0.3 (Ki at ghrelin receptor = 3.7 nM; rat plasma t0.5 = 3.2 hr; unpunished data), while for brain penetrating HM01, its brain:plasma ratio = 1.4 (Ki at ghrelin receptor = 1.4 nM; rat plasma t0.5 = 4.3 hr; Karasawa et al., 2014). To assess bradygastria, normogastria, and tachygastria, the animals were implanted with radio telemetry devices to permit the recording of gastric myoelectric activity (GMA) as well as body temperature (Percie du Sert, Chu, Wai, Rudd, & Andrews, 2010; Tu et al., 2017). To examine the potential anti‐emetic action of the ghrelin mimetics in detail, experiments were conducted in whole‐body plethysmography chambers to permit the simultaneous recording of respiration and an assessment of behaviour to quantify side effects. At the end of the experiments, the brains were removed and processed for c‐Fos immunohistochemistry to determine whether the ghrelin mimetics had suppressed or enhanced brain nuclei known to be involved in motion‐induced emesis (Tu et al., 2017). The relative ability of HM01 and HM02 were also determined to relax mesenteric arteries isolated from S. murinus, to provide potency estimates at ghrelin receptors in this species, and thus permit a better interpretation of the in vivo data generated during our study. Food and water consumption were also assessed, as this has been shown to be modulated by peripheral ghrelin receptors, via the vagus nerve (Date et al., 2002).
2. METHODS
2.1. Validity of animal species
Common laboratory animals (e.g., mice and rats) are incapable of vomiting, so S. murinus, a species commonly used in research into mechanisms of motion‐induced nausea and vomiting, are used in the present studies (Bolognini et al., 2013; Ueno, Matsuki, & Saito, 1988).
2.2. Animals
All animal care and experimental procedures were conducted under licence from the Government of the Hong Kong SAR and the Animal Experimentation Ethics Committee of The Chinese University of Hong Kong. Animal studies are reported in compliance with the ARRIVE guidelines (Kilkenny, Browne, Cuthill, Emerson, & Altman, 2010) and with the recommendations made by the British Journal of Pharmacology. Adult male S. murinus (55–75 g) were obtained from The Chinese University of Hong Kong and housed in a temperature‐controlled room (24 ± 1°C). Artificial lighting was provided between 06:00 and 18:00 hr. Relative humidity was maintained at 50 ± 5%. Water and dry pelleted cat chow (Feline Diet 5003, PMI Feeds, St. Louis, USA) were provided ad libitum, unless otherwise stated.
2.3. Isolation and mounting of blood vessels
Shrews were killed by asphyxiation using carbon dioxide. Their intestines were isolated and the inferior mesenteric arteries were carefully dissected and transferred to ice‐cold Krebs–Henseleit solution (composition in mM: NaCl 118, KCl 4.7, CaCl2 2.5, MgSO4 1.2, KH2PO4 1.18, NaHCO3 25, and glucose 10) gassed with 95% O2/5% CO2. Fat and connective tissue were removed under a dissecting microscope. Three 2‐mm long vessel rings were cut from the artery and then mounted in 5‐ml tissue baths in an integrated myograph system using 25 μm steel wires (Danish Myo Technology Model 619M, Aarhus N, Denmark). The tissue baths were filled with Krebs–Henseleit solution at 37 ± 1°C and gassed with 95% O2/5% CO2. Tissue tension was recorded using a Grass transducer via a MacLab system (ADInstruments Pty Ltd., New South Wales, Australia) and saved to a Macintosh PowerMac computer system (sampling rate 100 s−1). The rings were equilibrated for 45 min under a resting tension of 3.0 mN. The preparations were then checked for contractile response to 10‐μM phenylephrine and the integrity of the endothelium in each vessel ring was confirmed by an adequate relaxation response (>70% of the phenylephrine response) to 10‐μM ACh. The rings were then washed with Krebs–Henseleit solution and 10‐μM phenylephrine was again added to establish stable contractile tone. Subsequently, concentration–response curves for ghrelin, HM01, and HM02 (1 nM to 1 μM) were obtained using a cumulative dosing schedule at 3‐ to 5‐min intervals. The total volume of drugs added to the tissue bath was less than 3% of the bath volume.
2.4. Assessment of the anti‐emetic potential of HM01 and HM02
The anti‐emetic potential of HM01 has been reported previously (Rudd et al., 2018). A dose of 10 mg·kg−1 (p.o.) was selected for further investigation. HM02 has not been profiled for anti‐emetic activity before. Therefore, initial experiments were conducted to find a suitable dose to use in the radio telemetry and plethysmography experiments. One day prior to experimentation, animals were transferred to an observation room with controlled lighting (15 ± 2 lux) and habituated to clear Perspex observation chambers (21 × 14 × 13 cm). Food and water were withdrawn immediately prior to the administration of HM02 (1–30 mg·kg−1, p.o.) or vehicle (distilled water, 10 ml·kg−1, p.o.). One hour after administration of the drug, the animals were exposed to provocative motion (1 Hz, 4‐cm horizontal displacement) for 10 min without assessing food and water consumption.
2.5. Effects of HM01 and HM02 on food and water intake and body weight
Animals were housed singly in cages, and water and dry pelleted cat chow (Feline Diet 5003, PMI Feeds) were given ad libitum unless otherwise stated. After 1 week of adaptation to the housing conditions, the animals were given saline (10 ml·kg−1, p.o.), HM01 (10 mg·kg−1, p.o.), or HM02 (30 mg·kg−1, p.o.) at 10:00 a.m. for six consecutive days. Food and water intake and body weight were measured daily immediately before each treatment.
2.6. Implantation of radio telemetry transmitters
The surgical procedures are described in our previous studies (Percie du Sert et al., 2010). In brief, animals were fasted overnight, injected with buprenorphine (0.05 mg·kg−1, s.c. Temgesic; Schering Plough, Welwyn Garden City, UK), anaesthetized with ketamine (20 mg·kg−1, i.m.; Alfasan, Holland) and xylazine (3 mg·kg−1, i.m.; Alfasan), and maintained with 3% isoflurane (Halocarbon Products Corporation, USA) in a 3:1 ratio of O2 to N2O using an anaesthetic machine (Narkomed 2C, Drager, USA). Following a midline abdominal incision, the distal stomach was exposed. Two biopotential wires of an ETA‐F20 transmitter (Data Sciences, Inc., USA) were inserted into the serosal wall of the antrum. The body of the transmitter was placed subcutaneously on the dorsal aspect of the animal. The abdominal cavity was closed using a continuous suture for the muscle layer and a discontinuous suture for the skin, and the initial incision was sprayed with a permeable spray dressing (Opsite, Smith and Nephew, UK). After surgery, all animals were administered marbofloxacin (Marbocyl, 2 mg·kg−1, s.c.) once per day for 3 days, and buprenorphine (0.05 mg·kg−1, s.c.) was re‐administered 12 hr after the first dose. The animals were allowed 7 days to recover from the surgical procedures.
2.7. Effects of HM01 and HM02 against motion‐induced emesis and associated changes in physiological function
Although short exposure to provocative motion is sufficient to screen for compounds with anti‐emetic potential, it does not allow associated changes of c‐Fos expression in the brain to be studied (Tu et al., 2017). However, two previous studies demonstrated that 30 min of motion can elicit detectable c‐Fos expression in vestibular and brainstem areas in S. murinus (Ito et al., 2003; Ito, Nishibayashi, Maeda, Seki, & Ebukuro, 2005). Therefore, in the more detailed investigations reported here, 30 min of provocative motion was used. The animals were initially prescreened for motion sensitivity. They were placed into a clear Perspex whole‐body plethysmography chamber for 1‐hr habituation before being subjected to provocative motion (1 Hz, 4‐cm horizontal displacement, 30 min) using a desktop shaker (Heidolph Promax, UK), followed by a further 1‐hr recording. Thirty‐six animals were originally prescreened for motion sickness. All animals were sensitive (median latency to the first episode was 1.3 min, total number of episodes [20.1 ± 1.0]). After 7 days, they were randomized to their respective treatment groups using a Latin square design. After 1 hr of basal recordings, they were administered (a) saline 2 ml·kg−1, p.o. + motion, (b) HM01 10 mg·kg−1, p.o. + motion, (c) HM02 30 mg·kg−1, p.o. + motion, (d) saline 2 ml·kg−1, p.o. without motion, (e) HM01 10 mg·kg−1, p.o. without motion, or (f) HM02 30 mg·kg−1, p.o. without motion. The motion stimulus was exactly the same as in the prescreening studies (i.e., 1 Hz, 4‐cm horizontal displacement, 30 min) followed by a further 1 hr of recording to assess recovery. The animals were then deeply anaesthetized with pentobarbitone (80 mg·kg−1, i.p.; Dorminal, Alfasan) and intracardially perfused with pre‐cooled (4°C) saline (40 ml) followed by 4% paraformaldehyde (PFA) in PBS (80 ml). Their brains were removed and post‐fixed in 4% PFA overnight at 4°C. After fixation, the brains were transferred into 15% sucrose/4% PFA for dehydration overnight or until they sank, then into 30% sucrose/4% PFA until they sank again before being placed in aluminium foil containers filled with optimal cutting temperature compound (Tissue‐Tek, Sakura, USA). They were then stored at −80°C until they were sectioned and processed for c‐Fos immunohistochemistry.
2.8. c‐Fos immunohistochemistry
The antibody‐based procedures used intis study comply with the recommendations made by the British Journal of Pharmacology. The methodology for c‐Fos immunohistochemistry followed that previously used in studies of pathways involved in emesis in S. murinus (Chan et al., 2014; Chan, Lin, Yew, Yeung, & Rudd, 2013). In brief, frozen tissues were sectioned at 30 μm in the coronal plane using a freezing microtome and incubated at room temperature for 1 hr in 0.03% H2O2. The free‐floating sections were blocked with 5% donkey serum containing 0.3% Triton X‐100 in PBS for 1 hr. After washing three times with PBS, the sections were then incubated with rabbit anti‐c‐Fos antibody (1:10,000; Oncogene Research Products, Cambridge, USA) for 48 hr at 4°C. The sections were subsequently washed and incubated with secondary goat‐anti‐rabbit antibody (1:200; Vector Laboratories, RRID: AB_2313606) for 1 hr, followed by Vectastain avidin–biotin complex reagent for 1 hr (1:100; Vectastain Elite ABC kit, Vector Laboratories, Burlingame, USA, RRID: AB_2336827). c‐Fos expression was visualized using a commercially available peroxidase substrate (Vector VIP kit, Vector Laboratories, RRID: AB_2336848). The number of c‐Fos immunoreactive cells was counted manually using a Zeiss Axioskop 2 Plus microscope (Carl Zeiss Inc., Thornwood, USA) equipped with a Zeiss Axiocam 2 camera. To quantify expression in brainstem and hypothalamic nuclei, three representative sections were selected in accordance with the stereotaxic atlas constructed from our previous results (Chan et al., 2013; Chan et al., 2014). Specifically, the anterior/posterior coordinates (measured from λ) of the sections in which c‐Fos were counted were as follows: +5.92, +6.04, and +6.28 for the paraventricular nucleus of hypothalamus (PVH) and central nucleus of the amygdala (CeA); +5.32, +5.44, and + 5.66 for the Arc; +0.50, +0.62, and +0.74 for the medial vestibular nucleus (MVe); and −0.26, −0.14, and −0.02 for the area postrema (AP), nucleus tractus solitarius (NTS), and dorsal motor nucleus of the vagus (DMNV). ImageJ 1.5 (National Institutes of Health, USA, RRID: SCR_003070) was used to count all of the slides. The individual performing the counts was blind to the treatments received by individual animals.
2.9. Data acquisition and analysis
2.9.1. Behaviour
Emesis was characterized as rhythmic abdominal contractions that were either associated with p.o. expulsion of solid or liquid material from the gastrointestinal tract (i.e., vomiting) or not associated with passage of material (i.e., retching). An episode of retching and/or vomiting was considered separate when the animal changed its location inside the plethysmography chamber or when the interval between retches and/or vomits exceeded 2 s (Rudd, Ngan, & Wai, 1999). Emetic events changed the pressure waveforms in the chamber, which were analysed using a “burst analysis” technique (see Tu et al., 2017). The following behaviours were recorded using JWatcher 1.0 software (Macquarie University, Sydney, Australia): sniffing (drawing in a scent or air through the nasal cavity); exploring (sniffing while walking); face washing (scratching the face with forelimbs); chin on the floor (rubbing the floor with the chin); scratching (using hind limbs to scratch the body); licking (tongue protrusion and movement, occurring when lying flat, resting, and when actively moving around the chamber); and resting (conscious, but not moving). All behaviours were recorded as number of episodes, except resting, which was recorded as duration (min).
2.9.2. Radio telemetry
GMA data were initially analysed using Spike2 (Version 8.1, Cambridge Electronic Design, UK, RRID: SCR_000903) with methods previously developed by our laboratory (Percie du Sert et al., 2010). In brief, gastric slow waves were recorded at a sampling frequency of 1,000 Hz and were then filtered in several steps to a 0.03–0.5 Hz (2–30 cycles min−1) window and down‐sampled to 10.24 Hz to remove cardiac and respiratory signals and low‐frequency artefacts such as movement. Fast Fourier transforms (Hann window, 2048) were computed for data from successive 10‐min periods, and the following parameters were used to characterize the GMA: dominant frequency (DF), defined as the frequency bin with the highest power in the 2 to 24 cycles per minute (cpm) range; dominant power (DP), the highest power in the 2‐ to 24‐cpm range; and repartition of power in the bradygastric (2 to DF − 2 cpm), normal (DF − 2 to DF + 2 cpm), and tachygastric (DF + 2 to 24 cpm) ranges (i.e., bradygastria, normogastria, and tachygastria). All data collected by radio telemetry, including body temperature, were calculated as averages of 10‐min periods.
2.9.3. Respiration
Compensated whole‐body plethysmography (500‐05RevA, Data Sciences, Inc.) has been used in previous studies of respiratory functions implicated in emesis in S. murinus (Tu et al., 2017). In brief, the system consists of two transparent chambers, each equipped with a Validyne pressure transducer (600–900 mmHg), a temperature sensor (0–100°C), and a humidity sensor (0–100%). All channel signals from the two chambers were collected using an ACQ7700 Carrier and UniversalXE Signal Conditioner connected to a Micro 1401 data acquisition unit (Cambridge Electronic Design). Signals were acquired and analysed using Spike2 (Version 8.1, Cambridge Electronic Design) running on a PC desktop computer. It should be noted that body temperature is a prerequisite for calculating the respiratory tidal volume, and real‐time body temperature data from the telemetry transmitters were used in offline processing in Excel 2010 (v.14.0, Microsoft, USA, RRID: SCR_016137).
2.9.4. Analysis of emetic data using burst analysis
The methodology used to analyse the emetic data has been previously used in studies of emesis in Suncus murinus (Tu et al., 2017). In brief, six parameters were defined to enable automated burst analysis using Spike2: events per episode, mean inter‐event duration, mean retch/vomit frequency, episode duration, interval between episodes (the duration from the end of the last episode to the start of the next episode) and cycle between episodes (the duration from the onset of the last episode to the start of the next episode).
2.10. Data and statistical analyses
The data and statistical analysis comply with the recommendations of the British Journal of Pharmacology on experimental design and analysis in pharmacology (Curtis et al., 2018). All statistical analyses were performed using Prism version 7.0 (GraphPad, California, USA, RRID: SCR_002798). Differences in c‐Fos expression between treatments, all data obtained during the prescreening study, including animal behaviour and emesis, and all GMA and respiratory parameters were assessed using one‐way ANOVA followed by a Bonferroni test or Dunnett's multiple tests. Latency data were analysed using a Kruskal–Wallis test followed by Dunn's multiple comparison tests. The differences between animal behaviours, GMA parameters, and respiration patterns among the vehicle, HM01, and HM02 groups were assessed using two‐way ANOVA (factors: time and treatment) followed by Bonferroni tests. All data were expressed as the mean ± SEM. Differences were considered significant when P < .05.
2.11. Materials
HM01 (Figure 1a) and HM02 (Figure 1b) were from Helsinn SA Lugano, Switzerland and were dissolved in saline (0.9%, w/v).
Figure 1.

Chemical structure and potency of ghrelin agonist HM01 and HM02. (a and b) Chemical structure of HM01 and HM02; (c) effect of ghrelin and ghrelin agonists on phenylephrine‐induced contraction of the mesenteric artery; and (d) representative raw traces of ghrelin‐, HM01‐, and HM02‐induced relaxation. Data represent the mean ± SEM of six animals
2.12. Nomenclature of targets and ligand
Key protein targets and ligands in this article are hyperlinked to corresponding entries in http://www.guidetopharmacology.org, the common portal for data from the IUPHAR/BPS Guide to PHARMACOLOGY (Harding et al., 2018), and are permanently archived in the Concise Guide to PHARMACOLOGY 2019/20 (Alexander et al., 2019).
3. RESULTS
3.1. Effect of ghrelin, HM01, and HM02 on phenylephrine‐precontracted mesenteric arteries
The integrity of each ring preparation was tested using phenylephrine and ACh as the contractile‐ and relaxant (endothelium‐dependent) agents respectively. In the responding tissues, phenylephrine (10 μM) produced a maximal contraction of 6.9 ± 0.8 mN (pooled data, n = 18), which was relaxed by approximately 81.3% by 10‐μM ACh (pooled data, n = 18). A second challenge with phenylephrine (10 μM) induced a stable contractile tone of 6.6 ± 0.7 mN. Ghrelin, HM01, and HM02 concentration‐dependently relaxed the phenylephrine‐induced contraction by 57.7 ± 5.6%, 49.3 ± 6.6%, and 59.5 ± 7.0% respectively (Figure 1c). Ghrelin was slightly less potent than HM01 and HM02 in reducing phenylephrine‐induced contractions. The EC50 values for ghrelin, HM01, and HM02 were 4.4 ± 0.4, 2.5 ± 0.5, and 3.5 ± 0.4 nM, respectively (Figure 1c, n = 6). Representative raw traces of relaxation induced by ghrelin, HM01, and HM02 are shown in Figure 1d.
3.2. Dose response studies of HM01 and HM02 on motion‐induced emesis
Our previous reports showed that HM01 (10 mg·kg−1, p.o.) produced a maximal 77.7% reduction in the number of emetic episodes induced by a 10‐min provocative motion test at 10 mg·kg−1, p.o.; latency was not affected (Rudd et al., 2018). In the present study, using an identical testing paradigm, the vehicle‐treated animals exhibited 8.3 ± 1.9 episodes consisting of 42.3 ± 9.5 retches and vomits following a median latency of 1.6 min (quartiles, 1.3 and 4.7 min). HM02 at 30 mg·kg−1 reduced the number of episodes and number of vomits and retches by 86.5% (Figure S1B) and 85.7% (Figure S1C) respectively. HM02 did not affect the latency to first episode of retching and/or vomiting (Figure S1A).
3.3. Effect of HM01 and HM02 on food and water intake
The vehicle‐treated animals consumed 100.5 ± 2.1 g·kg−1 of food and 266.5 ± 10.9 ml·kg−1 of water per day (Figure 2b,d). Daily treatment with HM01 (10 mg·kg−1, p.o.) significantly increased the cumulative food intake from Day 3 until the end day of the 6‐day recording period, with a relative increase in mean daily food intake compared with the vehicle‐treated animals of 13.6% (Figure 2a,b). Conversely, HM02 (30 mg·kg−1, p.o.) did not affect cumulative food intake or mean daily food intake (Figure 2a,b). HM01 had no effect on water intake (Figure 2c,d). HM02 only caused a significant (12.7%) fall in cumulative water intake at Day 6 (Figure 2c).
Figure 2.

Effect of HM01 and HM02 on food and water intake in Suncus murinus. (a) Cumulative daily food intake; (b) mean daily food intake (average of Days 1–6); (c) cumulative water intake; and (d) mean daily water intake (average of Days 1–6). Animals were treated daily with vehicle (saline, 10 ml·kg−1, p.o.), HM01 (10 mg·kg−1, p.o.), or HM02 (30 mg·kg−1, p.o.) for six consecutive days, and food and water intake were measured daily shortly before treatments. Data represent the mean ± SEM of eight animals. * P < .05, significantly different from vehicle‐treated animals; one‐way ANOVA followed by Bonferroni tests
3.4. Behavioural observations
The shrews were initially prescreened for motion sensitivity, and all exhibited emesis. The median latency was 1.3 min (quartiles, 0.8 and 2.2 min) and 20.1 ± 1.0 emetic episodes occurred, comprising 5.6 ± 0.6 vomits and 138.3 ± 7.2 retches. Compared to baseline measurements (−1 hr), motion induced a reduction in the number of episodes of exploring (Table 1) and increased the number of episodes of scratching, licking, and chin on the floor (Table 1) in the 1‐hr observation period after motion. Other behaviours were unaffected.
Table 1.
Effect of provocative motion on spontaneous behaviours during prescreening studies in Suncus murinus
| Spontaneous behaviours before motion (60 min) | Spontaneous behaviours after motion (60 min) | |
|---|---|---|
| Exploring | 27.6 ± 3.5 | 5.5 ± 2.1* |
| Face washing | 2.6 ± 0.6 | 1.4 ± 0.4 |
| Chin on the floor | 6.0 ± 1.4 | 18.7 ± 4.8* |
| Scratching | 18.3 ± 2.4 | 42.9 ± 6.1* |
| Sniffing | 9.1 ± 1.6 | 4.5 ± 1.0 |
| Licking | 5.7 ± 0.9 | 18.0 ± 2.9* |
| Resting | 40.0 ± 1.4 | 31.9 ± 2.6 |
Note. Resting is calculated in minutes; other behaviours are calculated in episodes. Data represent the mean ± SEM of 36 animals.
P < .05, significantly different from baseline; paired t‐test.
3.5. Effect of provocative motion on GMA, body temperature, and respiratory pattern of S. murinus
During prescreening, the baseline DF was 14.9 ± 0.2 cpm with a DP of 5.2 ± 1.2 * 10−4 mv2: 37.8 ± 3.1% of power was in the bradygastric range, 37.0 ± 3.1% of power was in the normogastric range, and 15.3 ± 1.4% of power was in the tachygastric range. In the responding animals, motion caused a 7.0% increase in the percentage power of the bradygastric range (Table 2), and a 10.2% decrease the percentage power of the normogastric range (Table 2). A marked fall in body temperature was also observed during motion (−1.3 ± 0.11°C), which persisted until the end of the recovery period (−1.2 ± 0.11°C; Table 2). The animals exhibited a basal respiratory rate of 292.7 ± 15.3 bpm, a tidal volume of 0.39 ± 0.01 ml, concomitant with an inspiration time of 0.10 ± 0.00 s, and an inspiration flow of 0.61 ± 0.02 ml·s−1. There was an ~109‐bpm increase (37% increase) in respiration rate (Table 2) during motion. Compared to baseline, there was an increase in respiration rate of ~82 bpm and a reduction in tidal volume of ~0.06 ml (Table 2), concomitant with a 0.02‐s reduction in inspiration time (Table 2); no significant change in inspiratory flow was observed during the recovery period (Table 2).
Table 2.
Effect of provocative motion on gastric myoelectric activity, core body temperature, and respiratory pattern during prescreening studies
| Baseline | Motion | Recovery | |
|---|---|---|---|
| DF (cpm) | 14.92 ± 0.17 | 14.40 ± 0.19 | 14.96 ± 0.21 |
| DP (*10−4 mv2) | 5.15 ± 1.3 | 8.8 ± 2.7 | 9.1 ± 3.2 |
| Bradygastria (%) | 37.80 ± 3.12 | 44.79 ± 2.57* | 39.45 ± 2.77 |
| Normogastria (%) | 37.01 ± 3.54 | 26.91 ± 2.44* | 32.68 ± 2.52 |
| Tachygastria (%) | 15.30 ± 1.36 | 18.68 ± 1.49 | 17.66 ± 2.03 |
| Body temperature (°C) | 35.20 ± 0.12 | 33.88 ± 0.11* | 33.98 ± 0.14* |
| Respiration rate (bpm) | 292.70 ± 15.3 | 402.40 ± 11.98* | 374.20 ± 20.77* |
| Tidal volume (ml) | 0.39 ± 0.01 | — | 0.33 ± 0.01* |
| Inspiration time (s) | 0.10 ± 0.00 | — | 0.08 ± 0.00* |
| Inspiration flow (ml·s−1) | 0.61 ± 0.02 | — | 0.61 ± 0.03 |
Note. Data represent the mean ± SEM of 28–38 animals. Baseline refers to a 30‐min period immediately before provocation motion; recovery indicates 30 min immediately after provocation motion.
P < .05, significantly different from baseline; one‐way ANOVA followed by Bonferroni tests.
3.6. Effect of HM01 and HM02 on behaviour and motion‐induced emesis
Pretreatment with HM01 or HM02 did not modify any of the animal behaviours recorded during the 1 hr before the motion compared with the vehicle‐treated animals (Table 3). Provocative motion increased the number of episodes of scratching in the vehicle‐treated animals (Table 3) and caused a remarkable decrease in the number of episodes of sniffing in HM01‐ and HM02‐treated animals (Table 3). Moreover, relative to the vehicle‐treated animals, HM01 and HM02 caused a significant decrease in the number of episodes of scratching during the 1 hr after motion (Table 3). Profiles of the effects of HM01 and HM02 without provocative motion (the sham motion condition) on spontaneous behaviour are shown in Table S1.
Table 3.
. Effect of HM01 (10 mg·kg−1, p.o.) and HM02 (30 mg·kg−1, p.o.) on spontaneous behaviours in Suncus murinus
| Spontaneous behaviour before motion (60 min) | Spontaneous behaviour after motion (60 min) | |||||
|---|---|---|---|---|---|---|
| Vehicle + Motion | HM01 + Motion | HM02 + Motion | Vehicle + Motion | HM01 + Motion | HM02 + Motion | |
| Exploring | 14.2 ± 3.2 | 9.7 ± 2.4 | 10.7 ± 3.5 | 1.7 ± 0.7 | 1.8 ± 0.8 | 13.0 ± 8.2 |
| Face washing | 1.5 ± 0.6 | 0.0 ± 0.0 | 0.0 ± 0.0 | 2.0 ± 1.6 | 0.0 ± 0.0 | 0.8 ± 0.7 |
| Chin on the floor | 9.7 ± 3.2 | 6.8 ± 1.4 | 12.8 ± 7.5 | 6.7 ± 2.6 | 1.3 ± 0.7 | 2.3 ± 1.9 |
| Scratching | 16.7 ± 6.8 | 2.8 ± 1.9 | 4.5 ± 3.0 | 36.8 ± 14.3# | 5.7 ± 3.9* | 3.5 ± 2.7* |
| Sniffing | 22.2 ± 4.4 | 26.0 ± 3.7 | 30.8 ± 3.5 | 12.0 ± 5.0 | 9.2 ± 2.5# | 12.7 ± 3.7# |
| Licking | 7.7 ± 3.3 | 4.5 ± 3.1 | 2.8 ± 1.6 | 13.5 ± 5.1 | 4.6 ± 3.7 | 2.0 ± 0.9 |
| Resting | 42.0 ± 3.0 | 45.9 ± 2.2 | 43.5 ± 2.5 | 44.9 ± 4.4 | 53.4 ± 2.8 | 49.6 ± 4.2 |
Note. Resting is calculated in minutes; other behaviours are calculated in episodes. Data represent the mean ± SEM of six animals.
P < .05, for inter‐group comparison, significantly different from Vehicle + Motion group.
P < .05, significantly different, referring to intra‐group comparison; two‐way ANOVA followed by Bonferroni tests.
The vehicle‐treated animals had 16.0 ± 2.2 emetic episodes during provocative motion, consisting of 123.3 ± 23.8 vomits and retches (Figure 3a,c); the median latency to the first episode was 1.6 min (quartiles, 0.9 and 2.3 min; Figure 3b). HM01, but not HM02, significantly ameliorated motion‐induced emesis in terms of number of episodes (Figure 3a) and number of retches and vomits (Figure 3c). When compared with the number of episodes of emesis during prescreening, HM01 significantly reduced the number of episodes by 67.6 ± 8.5% (Figure 3d), while there was a tendency for HM02 to cause inhibition (43.8 ± 4.9% reduction) but that this was not statistically significant (Figure 3d). None of the treatments affected the latency to the first episode of retching or vomiting (Figure 3b).
Figure 3.
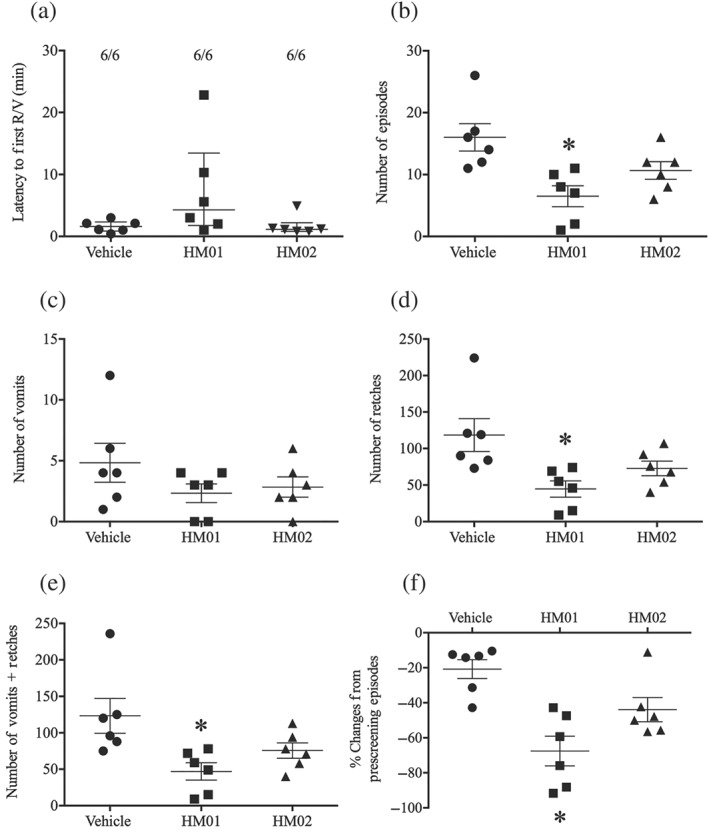
Effect of HM01 (10 mg·kg−1) and HM02 (30 mg·kg−1) on motion‐induced emesis in Suncus murinus. (a) Latency to the first episode; (b) number of episodes of emesis; (c) number of vomits; (d) number of retches; (e) number of vomits + retches; and (f) % change from prescreening episodes. Drug or vehicle was administered p.o. as a 60‐min pretreatment. Results represent the mean ± SEM of six animals. * P < .05, significantly different from vehicle‐treated animals; one‐way ANOVA followed by Bonferroni tests. Latency data to the first episode were assessed by a Kruskal–Wallis test followed by a Bonferroni tests. Individual animal latencies to the first episode of retching and/or vomiting and lines indicating medians with interquartile ranges are shown as are the number of animals exhibiting retching and/or vomiting out of the number of animals tested
3.7. Burst analysis of emetic data
No significant differences were found between groups in mean retch + vomit frequency, emetic episode duration, intervals between episodes, or cycles between episodes (Figure S2C–F). The vehicle, HM01, and HM02 groups exhibited 7.6 ± 0.3, 7.3 ± 0.3, and 7.1 ± 0.2 retches + vomits per emetic episode, respectively (Figure S2A), and the mean inter‐retch or inter‐vomit intervals were 0.18 ± 0.003, 0.18 ± 0.002, and 0.18 ± 0.003 s respectively (Figure S2B).
3.8. Effect of HM01 and HM02 on body temperature and GMA
Both HM01 and HM02 caused a progressive fall in body temperature that was evident after 20 min (1.36 ± 0.3°C reduction) and 40 min (1.41 ± 0.4°C reduction) of treatment respectively. The maximal falls in temperature in the presence of provocative motion were 4.6 ± 0.4°C, 4.2 ± 0.5°C, and 1.1 ± 0.3°C for HM01‐, HM02‐, and vehicle‐treated animals respectively. (Figure 4a). The reduction persisted during motion testing until the end of the recovery period (Figure 4a). The vehicle group did not experience an evident fall in body temperature during the pretreatment period. However, provocative motion induced a 1.8 ± 0.3°C decrease, which also persisted until the end of the recovery period (Figure 4a).
Figure 4.

Effect of HM01 (10 mg·kg−1) and HM02 (30 mg·kg−1) on gastric myoelectric activity (GMA) and body temperature. (a) Body temperature; (b) dominant frequency (DF); (c) dominant power (DP); (d) bradygastria %; (e) normogastria %; and (f) tachygastria %. Data represent the mean ± SEM of six animals. * P < .05, significantly different from vehicle‐treated animals; two‐way ANOVA followed by Bonferroni tests. Vertical lines indicate moments when drugs/saline was administered, and the motion was turned on and off. All data collected by radio telemetry were calculated by taking average of the data per 10 min
Compared with the vehicle‐treated animals, both the HM01 and HM02 groups exhibited a progressive reduction in DF that was evident after ~90 min. The maximal falls in DF were from approximately 15.0 cpm to 10.9 ± 0.9 and 8.9 ± 0.8 for HM01 and HM02, respectively, with the reduction persisting during provocative motion testing and during the recovery period (Figure 4b). Conversely, DP was not affected by HM01 or HM02 (Figure 4c). However, compared to the vehicle group, the animals treated with HM01 and HM02 had 45.3% and 38.7% increases in the percentage power of bradygastria, respectively, during the recovery period (Figure 4d). A 43.2% and 34.1% reduction in the percentage power of normogastria during the second half of the 1‐hr recovery period was observed in both the HM01 and HM02 groups (Figure 4e). The vehicle‐treated animals showed a tendency towards an increase in the percentage power of bradygastria, with a concomitant reduction in the percentage power of normogastria during motion compared to baseline, but this did not reach significance (Figure 4d,e). The percentage power of tachygastria was not affected by any of the treatments or by the motion stimulus (Figure 4f). The effect of HM01 and HM02 alone without provocative motion (the sham motion condition) on GMA and body temperature is shown in Figure S3.
3.9. Effect of HM01 and HM02 on respiratory pattern
The basal respiratory pattern was essentially the same as observed in the initial screening studies (reported above). The basal data prior to randomization were as follows: respiratory rate of 345 ± 31 bpm; tidal volume 0.40 ± 0.02 ml; inspiration time 0.09 ± 0.006 s; and inspiration flow 0.76 ± 0.05 ml·s−1. There were no significant differences in respiration rate, inspiration time, or flow among the groups during the 1‐hr pretreatment period (Figure 5a,c,d). However, compared with the vehicle group, the HM02‐treated animals had a lower tidal volume during the 1‐hr pretreatment period (Figure 5b). As to respiration rate, there were no significant differences among the groups when assessed before motion (vehicle vs. HM01 vs. HM02: 258.9 ± 24.1 vs. 224.7 ± 18.5 vs. 257.8 ± 25.1) and during motion (vehicle vs. HM01 vs. HM01: 360.9 ± 20.8 vs. 328.5 ± 41.6 vs. 426.6 ± 73.8; Figure 5a). There were no differences in tidal volume or inspiration time during the 1‐hr recovery period (Figure 5b,c). Provocative motion resulted in lower inspiration flow in the HM01‐ and HM02‐treated animals during the 1‐hr recovery period (Figure 5d). The effect on respiration patterns of HM01 and HM02 alone without provocative motion (the sham motion condition) is presented in Figure S4.
Figure 5.

Effect of HM01 (10 mg·kg−1) and HM02 (30 mg·kg−1) on respiratory activity. (a) Respiratory rate; (b) adjusted tidal volume; (c) inspiration time; and (d) inspiration flow. Data represent the mean ± SEM of six animals. * P < .05, significantly different from vehicle‐treated animals; two‐way ANOVA followed by Bonferroni tests. Vertical lines indicate moments when drugs/saline was administered, and the motion was turned on and off. All data collected by whole body plethysmography were calculated by taking average of the data per 2 min and eventually averaged into 10‐min segments for statistical analysis. Respiratory data, excepting respiration rate, could not be collected accurately during motion due to disruption of recordings caused by the shaking of the recording equipment, therefore were not analysed statistically
3.10. Effect of HM01 and HM02 on motion‐induced c‐Fos expression in the brain
Representative photomicrographs of c‐Fos staining in the brainstem and arcuate hypothalamic nucleus are shown in Figure 6. In vehicle‐treated animals that were not exposed to provocative motion (negative controls), the number of c‐Fos positive neurons was low. However, relative to the negative controls, the vehicle‐treated animals exposed to 30 min of provocative motion (positive controls) had large increases in c‐Fos positive neurons in the NTS (Figure 7b), DMNV (Figure 7c), MVe (Figure 7d), PVH (Figure 7e), and CeA (Figure 7f), but not in the AP (Figure 7a) or Arc (Figure 7g). Compared with the negative control, treatment with HM01 or HM02 without motion (the sham motion condition) induced significant increases in c‐Fos expression in the AP , NTS, DMNV and Arc (Figure 7a–c,g). However, only HM01 elicited c‐Fos expression in the PVH (162% increase; Figure 7e). Both HM01 and HM02 significantly antagonized the increases in c‐Fos expression in the MVe induced by provocative motion (Figure 7d).
Figure 6.

Representative photomicrographs illustrating c‐Fos expression (violet nuclear label) in the caudal brainstem (top panel) and hypothalamus (bottom panel) after administration of vehicle (saline, 2 ml·kg−1), HM01 (10 mg·kg−1), and HM02 (30 mg·kg−1). Vehicle + Motion: vehicle and motion stimulus; HM01 + Motion: HM01 and motion stimulus; HM02 + Motion: HM02 and motion stimulus; Vehicle: saline without provocative motion; HM01: HM01 without provocative motion; HM02: HM02 without provocative motion; 3V, the 3rd ventricle; AP, area postrema; Arc, arcuate hypothalamic nucleus; DMNV, dorsal motor nucleus of vagus; NTS, nucleus tractus solitarius. Scale bar: 100 μm
Figure 7.

Effect of HM01 (10 mg·kg−1) and HM02 (30 mg·kg−1) on motion‐induced c‐Fos expression in the brain of Suncus murinus. Data represent the mean ± SEM of six animals. (a) area postrema (AP); (b) nucleus tractus solitarius (NTS); (c) dorsal motor nucleus of vagus (DMNV); (d) medial vestibular nucleus (MVe); (e) paraventricular hypothalamic nucleus (PVH); (f) central amygdaloid nucleus (CeA); and (g) arcuate hypothalamic nucleus (Arc). * P < .05, significantly different from vehicle‐treated animals; # P < .05, significantly different from Vehicle + M group; one‐way ANOVA followed by Bonferroni tests
4. DISCUSSION
Previous studies have shown that pretreatment with a low concentration of https://www.guidetopharmacology.org/GRAC/LigandDisplayForward?ligandId=1458 (10−10 M) and ghrelin (10−10 to 10−7 M) induces gastric contraction in a concentration‐dependent manner using isolated stomach tissue (Mondal et al., 2013). However, these studies could not be replicated in our laboratory and therefore utilized precontracted mesenteric arteries to estimate the potency of HM01 and HM02 compared with ghrelin. In this study, the abilities of HM01 and the less brain‐penetrating ghrelin mimetic, HM02, were compared to relax isolated mesenteric arteries precontracted with phenylephrine and to stimulate feeding and reduce provocative motion‐induced emesis in S. murinus. On mesenteric arteries, HM01 and ghrelin were approximately equipotent (EC50 3.5–4.4 nM). HM02 was almost twice as potent (EC50 = 2.5 nM). The maximal relaxation responses seen with HM01 and ghrelin were 10% greater than for HM02.
HM01 at 10 mg·kg−1 stimulated intake of food but not water following a chronic dosing schedule. The same dose of HM01 reduced motion‐induced emesis by almost 70%. HM02 at 30 mg·kg−1 was inactive against motion‐induced emesis and failed to stimulate food intake, but it paradoxically reduced water intake. However, our conclusion in S. murinus must be taken with caution, as the relative rate of metabolism of HM01 and HM02 is unknown in this species. Our experimental evidence indicates that HM01 may have a direct effect on the emetic pathway. However, it is not possible to conform this from our experiments as we did not design experiments to confirm this absolutely. For example, we did not assay for an effect of HM01 to depolarize specific neurons, and our recordings that we obtained on GMA could be either direct or indirect, as slow waves may be modulated by direct actions or by altered autonomic output and/or circulating hormones/mediators.
We used an acute dosing protocol to assess anti‐emetic efficacy, and in this scenario, HM01 and HM02 did not increase food intake. Comparatively, chronic dosing was required to detect an increase of food intake. Mechanistically, it may be interesting in the future to know if the anti‐emetic potential of HM01 would increase on repeated dosing.
Our experiments were conducted using animals implanted with radio telemetry devices in whole‐body plethysmography chambers. This permitted the collection of a vast amount of physiological data. HM01 (10 mg·kg−1) and HM02 (30 mg·kg−1) did not affect basal exploratory behaviour. In this regard, their profile of action is superior to the anti‐emetic brain penetrating H1 receptor antagonist, https://www.guidetopharmacology.org/GRAC/LigandDisplayForward?ligandId=1227, which under similar testing conditions caused sedation exemplified by an increase in the time spent lying flat, along with reduced sniffing activity. However, in common with mepyramine, HM01 and HM02 both caused hypothermia and a decrease in DF that was accompanied by a decrease in the percentage power of normogastria and an increase in the percentage power of bradygastria. Conversely, in our previous study, the non‐brain penetrating antihistamine, cetirizine, did not reduce motion‐induced emesis and did not cause sedation, hypothermia, or changes in GMA (Tu et al., 2017). Taken together, these data suggest that reduced normogastria with a shift to bradygastria, with or without hypothermia, does not predict a capacity to reduce motion‐induced emesis. Burst analysis of emetic data showed that HM01 and HM02 did not affect the mean inter‐retch or inter‐vomit interval, supporting the observation that sedation is not a prerequisite for an anti‐emetic against motion sickness.
Although HM01 is reported to be more brain penetrating than HM02, stimulation of ghrelin receptors on the vagus in the periphery can induce c‐Fos in the brain (Zhang et al., 2003). Indeed, in other species, HM01 displays potent prokinetic actions by activating a gastric vagal cholinergic pathway via ghrelin receptor at both central and peripheral sites (Yuan, Wu, Pietra, & Tache, 2015). As the DMNV and nearby NTS receives vagal afferent terminals from the stomach, it is reasonable to expect large increases in the number of c‐Fos positive cells in these brain regions following the administration of either compound. Therefore, caution must be taken in our interpretation of the c‐Fos patterns, as our data do not necessarily reflect the direct interaction of HM01 and HM02 with ghrelin receptors behind the blood–brain barrier.
Nevertheless, predictably, both compounds induced a similar level of c‐Fos expression in the AP and the Arc, which are circumventricular organs (Siso, Jeffrey, & Gonzalez, 2010). They also induced comparable increases of c‐Fos expression in the NTS and MVe. One difference in the c‐Fos expression pattern of HM01 and HM02 was seen in the PVH, where HM01 induced significantly more activation than HM02. It is tempting to speculate that this difference can explain the differential effects on feeding and emesis, but the finding must be interpreted in the context of effects observed relative to the time at which c‐Fos was assayed, and the possibility that HM02 is a partial agonist of S. murinus ghrelin receptors must be considered. Why HM01 activated the PVH and other closely associated nuclei without causing increases in c‐Fos in the CeA also remains to be determined. The CeA is involved in mechanisms of food intake and is part of a higher level of circuitry in the forebrain implicated in both hedonic (pleasurable) feeding (Andrews & Rudd, 2015) and in nausea and emesis (Andrews & Sanger, 2014; Jobst, Enriori, & Cowley, 2004). Stimulation of ghrelin receptors in the amygdala in other species has been shown to reduce anxiety to facilitate feeding (Druce & Bloom, 2003).
In the present study, motion induced not only vomiting but also an increase in respiratory rate. This effect persisted during the recovery period. There was also an increase in scratching and sniffing behaviour during the recovery period. Motion‐induced changes in behaviour and respiration were associated with increases in c‐Fos activation in all brain areas examined except the AP and Arc. Only two other studies have used a 30‐min provocative motion stimulus in S. murinus in conjunction with c‐Fos immunohistochemistry (Ito et al., 2003; Ito et al., 2005). The present study was consistent in revealing a large increase in c‐Fos positive cells in the brainstem (i.e., the NTS and DMNV). However, motion induced large increases in c‐Fos in the PVH, CeA, and MVe were revealed by us.
Data across several species show that provocative motion induces c‐Fos expression in the CeA, PVH, and MVe, and there have been reports of increases in c‐Fos activation in the parabrachial nucleus and locus coeruleus; activation of these latter brain areas might indicate vestibular stress and/or motion‐induced physiological changes in blood flow, discomfort, malaise, and/or nausea (Balaban, Ogburn, Warshafsky, Ahmed, & Yates, 2014; Cai et al., 2010; Nakagawa et al., 2003; Tu et al., 2017). The vestibular nuclei receive all vestibular afferent inputs from the inner ear and have direct connections with the NTS and lateral tegmental field, which is likely to be why motion drives the outputs necessary for the physical process of emesis. The ascending pathways from the brainstem and vestibular nuclei travel rostrally, with the parabrachial nucleus serving as the main relay to the bed nucleus of the stria terminalis, PVH, CeA, and other areas of the forebrain (Yates, Catanzaro, Miller, & McCall, 2014).
Although a number of behaviours were recorded in the present studies, none of them alone can be ascribed specifically to the sensation of nausea. However, both HM01 and HM02 reduced the number of episodes of scratching during the recovery period. The relevance of this observation to mechanisms associated with nausea and emesis is presently unknown but it has been speculated that itching and/or scratching behaviour shares similarities with the mechanisms of emesis, and itching and/or scratching may be seen in several situations in which nausea occurs (Ostadhadi, Azimi, Lerner, & Dehpour, 2016). It is possible, therefore, that the ability of both HM01 and HM02 to reduce scratching behaviour reflects an ability to reduce nausea.
In conclusion, HM01 was more effective than HM02 in preventing motion‐induced emesis in S. murinus, suggesting that ghrelin receptors in the brain are critically involved in emesis control. The pattern of c‐Fos activation in the brainstem and hypothalamic regions following HM01 and HM02 treatment is consistent with known effects of ghrelin receptors stimulation. This is the first study to demonstrate that ghrelin mimetics can prevent motion‐induced emesis, without the adverse sedative profile of the anti‐emetic H1 receptor antagonists, although both HM01 and HM02 caused hypothermia. The fall in body temperature observed in S. murinus may be exaggerated and less relevant to humans as this species naturally has an ultradian homeostatic mechanism of 5–7°C fluctuations in temperature to balance metabolic needs (Ishii, Uchino, Kuwahara, Tsubone, & Ebukuro, 2002). The involvement of ghrelin receptors in emesis and/or nausea control suggests it is a promising target for the development of new anti‐motion sickness drugs.
CONFLICT OF INTEREST
The authors declare no conflicts of interest.
AUTHOR CONTRIBUTIONS
J.A.R. and L.T. conceptualized the study. L.T. performed the myograph experiment, animal surgery, recording, immunostaining and data analysis and drafted the manuscript. J.A.R., L.T., Z.L., F.L., C.G., E.L., and C.P. finalized the manuscript. All authors reviewed the final version of the manuscript and approved submission.
DECLARATION OF TRANSPARENCY AND SCIENTIFIC RIGOUR
This Declaration acknowledges that this paper adheres to the principles for transparent reporting and scientific rigour of preclinical research as stated in the BJP guidelines for https://bpspubs.onlinelibrary.wiley.com/doi/full/10.1111/bph.14207, https://bpspubs.onlinelibrary.wiley.com/doi/full/10.1111/bph.14208, and https://bpspubs.onlinelibrary.wiley.com/doi/full/10.1111/bph.14206, and as recommended by funding agencies, publishers and other organisations engaged with supporting research.
Supporting information
Table S1. Effect of HM01 (10 mg/kg, p.o.) and HM02 (30 mg/kg, p.o.) alone (sham motion condition) on spontaneous behaviours in Suncus murinus. Resting is calculated in mins, other behaviours are calculated in episodes. Data represents the mean ± s.e.m. of 6 animals. For inter‐group comparison, significant differences compared to Vehicle group are shown as *p < 0.05; #p < 0.05 was applied when referring to intra‐group comparison (two‐way ANOVA followed by Bonferroni tests).
Figure S1. Effect of HM02 (3–30 mg/kg, p.o.) on motion (1 Hz, 4 cm displacement, 10 min)‐induced emesis in Suncus murinus. A: Latency to the first episode; B: Number of episodes of emesis; C: Number of vomits; D: Number of retches; E: Number of vomits + retches; Individual latencies to the first episode of retching and/or vomiting, and lines indicating medians with interquartile ranges are shown, as are the number of animals exhibiting retching and/or vomiting out of the number of animals tested. The total number episodes and retches+vomits occurring during the observation period are shown as the mean ± s.e.m. Significant differences relative to the vehicle‐treated animals are indicated as *P < 0.05 (Kruskal‐Wallis test or one‐way ANOVA followed by appropriate post hoc testing as appropriate).
Figure S2. Analysis of emetic data using burst analysis. A: Events per episode/burst; B: Mean inter‐event duration; C: Mean retch/vomit frequency; D: Episodes duration; E: Interval between episodes; F: Cycle between episodes. Results represent the mean ± s.e.m. of all animals that had emesis (n = 6).
Figure S3. Effect of HM01 (10 mg/kg) and HM02 (30 mg/kg) alone (sham motion condition) on gastric myoelectric activity (GMA) and body temperature. A: Body temperature; B: Dominant frequency (DF); C: Dominant power (DP); D: Bradygastria %; E: Normogastria %; F: Tachygastria %. Data represents the mean ± s.e.m. of 6 animals. Significant differences compared to vehicle group are shown as *p < 0.05 (two‐way ANOVA followed by Bonferroni tests). Vertical lines indicate moments when drugs/saline was administered. All data collected by radiotelemetry were calculated by taking average of the data per 10 min.
Figure S4. Effect of HM01 (10 mg/kg) and HM02 (30 mg/kg) alone (sham motion condition) on respiratory activity. A: Respiratory rate; B: Adjusted tidal volume; C: Inspiration time; D: Inspiration flow. Data represents the mean ± s.e.m. of 6 animals. Significant differences compared to vehicle group are shown as *p < 0.05 (two‐way ANOVA followed by Bonferroni tests). Vertical lines indicate moments when drugs/saline was administered. All data collected by whole body plethysmography were calculated by taking average of the data per 2 min, and eventually averaged into 10 min segments for statistical analysis.
ACKNOWLEDGEMENTS
We thank Cambridge Electronic Design, especially Simon Gray, for providing the customized Spike2 scripts. We are also grateful for the technical assistance of Ethel Sau Kuen Ng on myograph studies.
Tu L, Lu Z, Ngan MP, et al. The brain‐penetrating, orally bioavailable, ghrelin receptor agonist HM01 ameliorates motion‐induced emesis in Suncus murinus (house musk shrew). Br J Pharmacol. 2020;177:1635–1650. 10.1111/bph.14924
REFERENCES
- Alexander, S. P. H. , Christopoulos, A. , Davenport, A. P. , Kelly, E. , Mathie, A. , Peters, J. A. , … CGTP Collaborators (2019). THE CONCISE GUIDE TO PHARMACOLOGY 2019/20: G protein‐coupled receptors. British Journal of Pharmacology, 176, S21–S141. 10.1111/bph.14748 [DOI] [PMC free article] [PubMed] [Google Scholar]
- Andrews, P. L. R. , & Rudd, J. A. (2015). The physiology and pharmacology of nausea and vomiting induced by anti‐cancer chemotherapy in humans In Navari R. (Ed.), Management of chemotherapy‐induced nausea and vomiting: New agents and new uses of current agents. London: Springer Health Care Publishers. [Google Scholar]
- Andrews, P. L. R. , & Sanger, G. J. (2014). Nausea and the quest for the perfect anti‐emetic. European Journal of Pharmacology, 722, 108–121. 10.1016/j.ejphar.2013.09.072 [DOI] [PubMed] [Google Scholar]
- Balaban, C. D. , Ogburn, S. W. , Warshafsky, S. G. , Ahmed, A. , & Yates, B. J. (2014). Identification of neural networks that contribute to motion sickness through principal components analysis of Fos labeling induced by galvanic vestibular stimulation. PLoS ONE, 9(1), 1‐14, e86730 10.1371/journal.pone.0086730 [DOI] [PMC free article] [PubMed] [Google Scholar]
- Bolognini, D. , Rock, E. M. , Cluny, N. L. , Cascio, M. G. , Limebeer, C. L. , Duncan, M. , … Pertwee, R. G. (2013). Cannabidiolic acid prevents vomiting in Suncus murinus and nausea‐induced behaviour in rats by enhancing 5‐HT1A receptor activation. British Journal of Pharmacology, 168(6), 1456–1470. 10.1111/bph.12043 [DOI] [PMC free article] [PubMed] [Google Scholar]
- Cai, Y. L. , Wang, J. Q. , Chen, X. M. , Li, H. X. , Li, M. , & Guo, J. S. (2010). Decreased Fos protein expression in rat caudal vestibular nucleus is associated with motion sickness habituation. Neuroscience Letters, 480(1), 87–91. 10.1016/j.neulet.2010.06.011 [DOI] [PubMed] [Google Scholar]
- Callaghan, B. , & Furness, J. B. (2014). Novel and conventional receptors for ghrelin, desacyl‐ghrelin, and pharmacologically related compounds. Pharmacological Reviews, 66(4), 984–1001. 10.1124/pr.113.008433 [DOI] [PubMed] [Google Scholar]
- Chan, S. W. , Lin, G. , Yew, D. T. W. , Yeung, C. K. , & Rudd, J. A. (2013). Separation of emetic and anorexic responses of exendin‐4, a GLP‐1 receptor agonist in Suncus murinus (house musk shrew). Neuropharmacology, 70, 141–147. 10.1016/j.neuropharm.2013.01.013 [DOI] [PubMed] [Google Scholar]
- Chan, S. W. , Lu, Z. , Lin, G. , Yew, D. T. W. , Yeung, C. K. , & Rudd, J. A. (2014). The differential antiemetic properties of GLP‐1 receptor antagonist, exendin (9–39) in Suncus murinus (house musk shrew). Neuropharmacology, 83, 71–78. 10.1016/j.neuropharm.2014.03.016 [DOI] [PubMed] [Google Scholar]
- Curtis, M. J. , Alexander, S. , Cirino, G. , Docherty, J. R. , George, C. H. , Giembycz, M. A. , … Ahluwalia, A. (2018). Experimental design and analysis and their reporting II: Updated and simplified guidance for authors and peer reviewers. British Journal of Pharmacology, 175(7), 987–993. 10.1111/bph.14153 [DOI] [PMC free article] [PubMed] [Google Scholar]
- Date, Y. , Murakami, N. , Toshinai, K. , Matsukura, S. , Niijima, A. , Matsuo, H. , … Nakazato, M. (2002). The role of the gastric afferent vagal nerve in ghrelin‐induced feeding and growth hormone secretion in rats. Gastroenterology, 123(4), 1120–1128. 10.1053/gast.2002.35954 [DOI] [PubMed] [Google Scholar]
- Druce, M. , & Bloom, S. R. (2003). Central regulators of food intake. Current Opinion in Clinical Nutrition and Metabolic Care, 6(4), 361–367. 10.1097/00075197-200307000-00002 [DOI] [PubMed] [Google Scholar]
- Farmer, A. D. , Ban, V. F. , Coen, S. J. , Sanger, G. J. , Barker, G. J. , Gresty, M. A. , … Aziz, Q. (2015). Visually induced nausea causes characteristic changes in cerebral, autonomic and endocrine function in humans. The Journal of Physiology, 593(5), 1183–1196. 10.1113/jphysiol.2014.284240 [DOI] [PMC free article] [PubMed] [Google Scholar]
- Golding, J. F. (2006). Motion sickness susceptibility. Autonomic Neuroscience‐Basic & Clinical, 129(1–2), 67–76. 10.1016/j.autneu.2006.07.019 [DOI] [PubMed] [Google Scholar]
- Golding, J. F. , & Gresty, M. A. (2015). Pathophysiology and treatment of motion sickness. Current Opinion in Neurology, 28(1), 83–88. 10.1097/WCO.0000000000000163 [DOI] [PubMed] [Google Scholar]
- Harding, S. D. , Sharman, J. L. , Faccenda, E. , Southan, C. , Pawson, A. J. , Ireland, S. , … NC‐IUPHAR (2018). The IUPHAR/BPS guide to PHARMACOLOGY in 2018: Updates and expansion to encompass the new guide to IMMUNOPHARMACOLOGY. Nucleic Acids Research, 46, D1091–D1106. 10.1093/nar/gkx1121 [DOI] [PMC free article] [PubMed] [Google Scholar]
- Ishida, Y. , Sakahara, S. , Tsutsui, C. , Kaiya, H. , Sakata, I. , Oda, S. , & Sakai, T. (2009). Identification of ghrelin in the house musk shrew (Suncus murinus): cDNA cloning, peptide purification and tissue distribution. Peptides, 30(5), 982–990. 10.1016/j.peptides.2009.01.006 [DOI] [PubMed] [Google Scholar]
- Ishii, K. , Uchino, M. , Kuwahara, M. , Tsubone, H. , & Ebukuro, S. (2002). Diurnal fluctuations of heart rate, body temperature and locomotor activity in the house musk shrew (Suncus murinus). Experimental Animals, 51(1), 57–62. 10.1538/expanim.51.57 [DOI] [PubMed] [Google Scholar]
- Ito, H. , Nishibayashi, M. , Kawabata, K. , Maeda, S. , Seki, M. , & Ebukuro, S. (2003). Induction of Fos protein in neurons in the medulla oblongata after motion‐ and X‐irradiation‐induced emesis in musk shrews (Suncus murinus). Autonomic Neuroscience, 107(1), 1–8. 10.1016/S1566-0702(03)00026-2 [DOI] [PubMed] [Google Scholar]
- Ito, H. , Nishibayashi, M. , Maeda, S. , Seki, M. , & Ebukuro, S. (2005). Emetic responses and neural activity in young musk shrews during the breast‐feeding/weaning period: Comparison between the high and low emetic response strains using a shaking stimulus. Experimental Animals, 54(4), 301–307. 10.1538/expanim.54.301 [DOI] [PubMed] [Google Scholar]
- Jobst, E. E. , Enriori, P. J. , & Cowley, M. A. (2004). The electrophysiology of feeding circuits. Trends in Endocrinology and Metabolism, 15(10), 488–499. 10.1016/j.tem.2004.10.007 [DOI] [PubMed] [Google Scholar]
- Karasawa, H. , Pietra, C. , Giuliano, C. , Garcia‐Rubio, S. , Xu, X. , Yakabi, S. , … Wang, L. (2014). New ghrelin agonist, HM01 alleviates constipation and L‐dopa‐delayed gastric emptying in 6‐hydroxydopamine rat model of Parkinson's disease. Neurogastroenterology and Motility, 26(12), 1771–1782. 10.1111/nmo.12459 [DOI] [PMC free article] [PubMed] [Google Scholar]
- Kilkenny, C. , Browne, W. , Cuthill, I. C. , Emerson, M. , & Altman, D. G. (2010). Animal research: Reporting in vivo experiments: The ARRIVE guidelines. British Journal of Pharmacology, 160, 1577–1579. [DOI] [PMC free article] [PubMed] [Google Scholar]
- Kitazawa, T. , De Smet, B. , Verbeke, K. , Depoortere, I. , & Peeters, T. L. (2005). Gastric motor effects of peptide and non‐peptide ghrelin agonists in mice in vivo and in vitro. Gut, 54(8), 1078–1084. 10.1136/gut.2005.065896 [DOI] [PMC free article] [PubMed] [Google Scholar]
- Kojima, M. , Hosoda, H. , Date, Y. , Nakazato, M. , Matsuo, H. , & Kangawa, K. (1999). Ghrelin is a growth‐hormone‐releasing acylated peptide from stomach. Nature, 402(6762), 656–660. 10.1038/45230 [DOI] [PubMed] [Google Scholar]
- Kojima, M. , & Kangawa, K. (2005). Ghrelin: Structure and function. Physiological Reviews, 85(2), 495–522. 10.1152/physrev.00012.2004 [DOI] [PubMed] [Google Scholar]
- Lackner, J. R. , & DiZio, P. (2006). Space motion sickness. Experimental Brain Research, 175(3), 377–399. 10.1007/s00221-006-0697-y [DOI] [PubMed] [Google Scholar]
- Mohammadi, E. , Pietra, C. , Giuliano, C. , Fugang, L. , & Greenwood‐Van Meerveld, B. (2019). A comparison of the central versus peripheral gastrointestinal prokinetic activity of two novel ghrelin mimetics. Journal of Pharmacology and Experimental Therapeutics, 368(1), 116–124. 10.1124/jpet.118.250738 [DOI] [PubMed] [Google Scholar]
- Mondal, A. , Aizawa, S. , Sakata, I. , Goswami, C. , Oda, S. , & Sakai, T. (2013). Mechanism of ghrelin‐induced gastric contractions in Suncus murinus (house musk shrew): Involvement of intrinsic primary afferent neurons. PLoS ONE, 8(4), 1‐10. 10.1371/journal.pone.0060365 [DOI] [PMC free article] [PubMed] [Google Scholar]
- Nakagawa, A. , Uno, A. , Horii, A. , Kitahara, T. , Kawamoto, M. , Uno, Y. , … Kubo, T. (2003). Fos induction in the amygdala by vestibular information during hypergravity stimulation. Brain Research, 986(1–2), 114–123. 10.1016/S0006-8993(03)03220-7 [DOI] [PubMed] [Google Scholar]
- Ostadhadi, S. , Azimi, E. , Lerner, E. A. , & Dehpour, A. R. (2016). Are itch and scratching the nausea and vomiting of skin? Experimental Dermatol Ogy, 25(5), 340–343. 10.1111/exd.12935 [DOI] [PMC free article] [PubMed] [Google Scholar]
- Percie du Sert, N. , Chu, K. M. , Wai, M. K. , Rudd, J. A. , & Andrews, P. L. (2010). Telemetry in a motion‐sickness model implicates the abdominal vagus in motion‐induced gastric dysrhythmia. Experimental Physiology, 95(7), 768–773. 10.1113/expphysiol.2009.052001 [DOI] [PubMed] [Google Scholar]
- Reason, J. (1978). Motion sickness adaptation: A neural mismatch model. Journal of the Royal Society of Medicine, 71(11), 819–829. [DOI] [PMC free article] [PubMed] [Google Scholar]
- Reason, J. T. , & Brand, J. J. (1975). Motion sickness. Academic press. [Google Scholar]
- Rudd, J. A. , Chan, S. W. , Ngan, M. P. , Tu, L. L. , Lu, Z. B. , Giuliano, C. , et al. (2018). Anti‐emetic action of the brain‐penetrating new ghrelin agonist, HM01, alone and in combination with the 5‐HT3 antagonist, palonosetron and with the NK1 antagonist, netupitant, against cisplatin‐ and motion‐induced emesis in Suncus murinus (house musk shrew). Frontiers in Pharmacology, 9, 1‐16. [DOI] [PMC free article] [PubMed] [Google Scholar]
- Rudd, J. A. , Ngan, M. P. , & Wai, M. K. (1999). Inhibition of emesis by tachykinin NK1 receptor antagonists in Suncus murinus (house musk shrew). European Journal of Pharmacology, 366(2–3), 243–252. 10.1016/s0014-2999(98)00920-0 [DOI] [PubMed] [Google Scholar]
- Rudd, J. A. , Ngan, M. P. , Wai, M. K. , King, A. G. , Witherington, J. , Andrews, P. L. , & Sanger, G. J. (2006). Anti‐emetic activity of ghrelin in ferrets exposed to the cytotoxic anti‐cancer agent cisplatin. Neuroscience Letters, 392(1–2), 79–83. 10.1016/j.neulet.2005.08.062 [DOI] [PubMed] [Google Scholar]
- Sanger, G. J. (2008). Motilin, ghrelin and related neuropeptides as targets for the treatment of GI diseases. Drug Discovery Today, 13(5–6), 234–239. 10.1016/j.drudis.2007.10.024 [DOI] [PubMed] [Google Scholar]
- Sanger, G. J. , Broad, J. , Callaghan, B. , & Furness, J. B. (2017). Ghrelin and motilin control systems in GI physiology and therapeutics. Handbook of Experimental Pharmacology, 239, 379–416. [DOI] [PubMed] [Google Scholar]
- Schmäl, F. (2013). Neuronal mechanisms and the treatment of motion sickness. Pharmacology, 91(3–4), 229–241. 10.1159/000350185 [DOI] [PubMed] [Google Scholar]
- Siso, S. , Jeffrey, M. , & Gonzalez, L. (2010). Sensory circumventricular organs in health and disease. Acta Neuropathologica, 120(6), 689–705. 10.1007/s00401-010-0743-5 [DOI] [PubMed] [Google Scholar]
- Spinks, A. , & Wasiak, J. (2011). Scopolamine (hyoscine) for preventing and treating motion sickness. Cochrane Database of Systematic Reviews, 6, 1‐25, CD002851. [DOI] [PMC free article] [PubMed] [Google Scholar]
- Suzuki, A. , Ishida, Y. , Aizawa, S. , Sakata, I. , Tsutsui, C. , Mondal, A. , … Sakai, T. (2012). Molecular identification of GHS‐R and GPR38 in Suncus murinus . Peptides, 36(1), 29–38. 10.1016/j.peptides.2012.04.019 [DOI] [PubMed] [Google Scholar]
- Tu, L. , Lu, Z. , Dieser, K. , Schmitt, C. , Chan, S. W. , Ngan, M. P. , … Rudd, J. A. (2017). Brain activation by H1 antihistamines challenges conventional view of their mechanism of action in motion sickness: A behavioral, c‐Fos and physiological study in Suncus murinus (house musk shrew). Frontiers in Physiology, 8(412), 1‐18. 10.3389/fphys.2017.00412 [DOI] [PMC free article] [PubMed] [Google Scholar]
- Ueno, S. , Matsuki, N. , & Saito, H. (1988). Suncus murinus as a new experimental model for motion sickness. Life Sciences, 43(5), 413–420. 10.1016/0024-3205(88)90520-6 [DOI] [PubMed] [Google Scholar]
- Yates, B. J. , Catanzaro, M. F. , Miller, D. J. , & McCall, A. A. (2014). Integration of vestibular and emetic gastrointestinal signals that produce nausea and vomiting: Potential contributions to motion sickness. Experimental Brain Research, 232(8), 2455–2469. 10.1007/s00221-014-3937-6 [DOI] [PMC free article] [PubMed] [Google Scholar]
- Yuan, P.‐Q. , Wu, S. S. , Pietra, C. , & Tache, Y. (2015). 959 Novel ghrelin agonist HM01 reverses postoperative gastric ileus (POGI) by its dual prokinetic and anti‐inflammatory actions through activation of vagal cholinergic pathway in rats. Gastroenterology, 148(4), S‐186–S‐187. 10.1016/S0016-5085(15)30622-3 [DOI] [Google Scholar]
- Zhang, W. , Lin, T. R. , Hu, Y. X. , Fan, Y. Y. , Zhao, L. L. , & Mulholland, M. W. (2003). Activation of c‐fos expression in the rat inferior olivary nucleus by ghrelin. Neuroscience Letters, 353(3), 157–160. 10.1016/j.neulet.2003.08.083 [DOI] [PubMed] [Google Scholar]
Associated Data
This section collects any data citations, data availability statements, or supplementary materials included in this article.
Supplementary Materials
Table S1. Effect of HM01 (10 mg/kg, p.o.) and HM02 (30 mg/kg, p.o.) alone (sham motion condition) on spontaneous behaviours in Suncus murinus. Resting is calculated in mins, other behaviours are calculated in episodes. Data represents the mean ± s.e.m. of 6 animals. For inter‐group comparison, significant differences compared to Vehicle group are shown as *p < 0.05; #p < 0.05 was applied when referring to intra‐group comparison (two‐way ANOVA followed by Bonferroni tests).
Figure S1. Effect of HM02 (3–30 mg/kg, p.o.) on motion (1 Hz, 4 cm displacement, 10 min)‐induced emesis in Suncus murinus. A: Latency to the first episode; B: Number of episodes of emesis; C: Number of vomits; D: Number of retches; E: Number of vomits + retches; Individual latencies to the first episode of retching and/or vomiting, and lines indicating medians with interquartile ranges are shown, as are the number of animals exhibiting retching and/or vomiting out of the number of animals tested. The total number episodes and retches+vomits occurring during the observation period are shown as the mean ± s.e.m. Significant differences relative to the vehicle‐treated animals are indicated as *P < 0.05 (Kruskal‐Wallis test or one‐way ANOVA followed by appropriate post hoc testing as appropriate).
Figure S2. Analysis of emetic data using burst analysis. A: Events per episode/burst; B: Mean inter‐event duration; C: Mean retch/vomit frequency; D: Episodes duration; E: Interval between episodes; F: Cycle between episodes. Results represent the mean ± s.e.m. of all animals that had emesis (n = 6).
Figure S3. Effect of HM01 (10 mg/kg) and HM02 (30 mg/kg) alone (sham motion condition) on gastric myoelectric activity (GMA) and body temperature. A: Body temperature; B: Dominant frequency (DF); C: Dominant power (DP); D: Bradygastria %; E: Normogastria %; F: Tachygastria %. Data represents the mean ± s.e.m. of 6 animals. Significant differences compared to vehicle group are shown as *p < 0.05 (two‐way ANOVA followed by Bonferroni tests). Vertical lines indicate moments when drugs/saline was administered. All data collected by radiotelemetry were calculated by taking average of the data per 10 min.
Figure S4. Effect of HM01 (10 mg/kg) and HM02 (30 mg/kg) alone (sham motion condition) on respiratory activity. A: Respiratory rate; B: Adjusted tidal volume; C: Inspiration time; D: Inspiration flow. Data represents the mean ± s.e.m. of 6 animals. Significant differences compared to vehicle group are shown as *p < 0.05 (two‐way ANOVA followed by Bonferroni tests). Vertical lines indicate moments when drugs/saline was administered. All data collected by whole body plethysmography were calculated by taking average of the data per 2 min, and eventually averaged into 10 min segments for statistical analysis.