

Abstract
Primary hepatic tumors mainly include hepatocellular carcinoma (HCC), which is one of the most frequent causes of cancer‐related deaths worldwide. Thus far, HCC prognosis has remained extremely poor given the lack of effective treatments. Numerous studies have described the roles played by microRNAs (miRNAs) in cancer progression and the potential of these small noncoding RNAs for diagnostic or therapeutic applications. The current consensus supports the idea that direct repression of a wide range of oncogenes by a single key miRNA could critically affect the malignant properties of cancer cells in a synergistic manner. In this study, we aimed to investigate the oncogenes controlled by miR‐493‐5p, a major tumor suppressor miRNA that inactivates miR‐483‐3p oncomir in hepatic cancer cells. Using global gene expression analysis, we highlighted a set of candidate genes potentially regulated by miR‐493‐5p. In particular, the canonical MYCN protooncogene (MYCN) appeared to be an attractive target of miR‐493‐5p given its significant inhibition through 3′‐UTR targeting in miR‐493‐5p‐rescued HCC cells. We showed that MYCN was overexpressed in liver cancer cell lines and clinical samples from HCC patients. Notably, MYCN expression levels were inversely correlated with miR‐493‐5p in tumor tissues. We confirmed that MYCN knockdown mimicked the anticancer effect of miR‐493‐5p by inhibiting HCC cell growth and invasion, whereas MYCN rescue hindered miR‐493‐5p activity. In summary, miR‐493‐5p is a pivotal miRNA that modulates various oncogenes after its reexpression in liver cancer cells, suggesting that tumor suppressor miRNAs with a large spectrum of action could provide valuable tools for miRNA replacement therapies.
Keywords: cancer therapy, hepatocellular carcinoma, microRNA, oncogene, tumor suppressor
Our study highlighted the MYCN protooncogene as a critical target of microRNA (miR)‐493‐5p tumor suppressor. We found that MYCN was overexpressed in hepatic cancer cells and that miR‐493‐5p negatively repressed MYCN at the posttranscriptional level. We confirmed that MYCN silencing mimicked the anticancer activity of miR‐493‐5p by inhibiting hepatic tumor cell growth and invasion.

Abbreviations
- ACR
acyclic retinoid
- CSC
cancer stem cell
- FNDC5
fibronectin type III domain containing 5
- GOLM1
Golgi membrane protein 1
- HBV
hepatitis B virus
- HCC
hepatocellular carcinoma
- HCV
hepatitis C virus
- IGF2
insulin‐like growth factor 2
- MEG3
maternally expressed 3
- miR
microRNA
- miRNA
microRNA
- MYCN
MYCN protooncogene
- qPCR
quantitative PCR
- SCN5A
sodium voltage‐gated channel α subunit 5
1. INTRODUCTION
Primary hepatic tumors represent the sixth most commonly diagnosed malignancy worldwide and the fourth cause of mortality from cancer.1 Liver cancer mainly includes HCC, which follows a typical development and progression scheme by affecting patients suffering from chronic liver disease, generally caused by HBV and/or HCV infection or excessive alcohol intake.2 Nonalcoholic fatty liver diseases are also becoming a dramatic cause of HCC in developed regions. Despite great advances in HCC treatments, this type of cancer remains associated with rapid recurrence after surgery and dramatically poor prognosis, which is essentially the consequence of high resistance to the existing therapy agents.3, 4 Consequently, alternative and innovative approaches are required for the therapeutic management of liver cancer patients.
MicroRNAs are small noncoding RNAs that direct posttranscriptional repression by complementary base pairing with the 3′‐UTR of mRNAs.5, 6 Various reports have described the key roles of miRNAs in the control of major biological processes and human diseases,7 including cancer.8 Depending on their targets, cancer‐related miRNAs act as oncogenes or tumor suppressors.9 Thus, alteration of tumor suppressor miRNAs can cause the upregulation of oncogenes normally repressed in nonneoplastic cells, increasing cell growth, invasion ability, or drug resistance. Conversely, aberrant overexpression of oncogenic miRNAs, also called oncomirs, can lead to the downregulation of specific genes critical for tumor suppression. Abnormal expression profiles of cancer‐related miRNAs have been significantly associated with the clinicopathological outcome of hepatic tumors.10 Furthermore, experimental works have shown that miRNA replacement therapy is promising to suppress HCC progression.11
An essential feature of miRNA biology relies on the pleiotropic properties of a single miRNA, which can theoretically exert wide control over a plethora of target mRNAs. For instance, our group and others have reported the pivotal tumor suppressor activity of miR‐148a‐3p in liver cancer cells through the regulation of multiple targets and oncogenes.12, 13, 14, 15, 16 More recently, we identified miR‐493‐5p as another major tumor suppressor miRNA, which is epigenetically silenced in HCC cells.17 Ectopic overexpression of miR‐493‐5p promoted an anticancer response by inhibiting hepatic cancer cell growth and invasion, in part, through the negative regulation of IGF2 and the IGF2‐derived intronic oncomir miR‐483‐3p. The present study aimed to identify and characterize key oncogenes affected by miR‐493‐5p. Using global gene expression analysis, a number of candidate targets were highlighted after reexpression of miR‐493‐5p. Herein, MYCN, which has been recently recognized as a biomarker of HCC recurrence and a valuable target for anti‐HCC treatments,18 was evidenced and appeared to be highly expressed in hepatic cancer cells and tumor tissues from liver cancer patients. Moreover, a significant inverse correlation between miR‐493‐5p and MYCN expression levels was established in clinical samples. Importantly, we confirmed that MYCN knockdown mimicked the tumor suppressor activity of miR‐493‐5p by decreasing HCC cell growth and invasion.
2. MATERIALS AND METHODS
2.1. Hepatic cancer cells, human hepatocytes, and clinical samples
Human HepG2 and Hep3B cells were purchased from the ATCC. Human Huh‐7 cells were purchased from the RIKEN BioResource Center. All cultured HCC cells were maintained in DMEM (Gibco) supplemented with penicillin (50 IU/mL; Gibco), streptomycin (50 µg/mL; Gibco), and 10% FBS (Thermo Fisher Scientific). Human cryopreserved hepatocytes were purchased from XenoTech and maintained in a medium composed of William’s Medium E (Gibco), L‐glutamine (2 mmol/L), penicillin (50 IU/mL), streptomycin (50 µg/mL), and 10% FBS supplemented with hepatic growth factor (25 ng/mL; PeproTech), insulin (5 µg/mL; Sigma), and hydrocortisone 21‐hemisuccinate (2 × 10⁻⁷ mol/L; Sigma). The clinical samples included 13 pairs of primary HCCs and their corresponding nontumor tissues (N = 26). Informed consent was obtained from all patients. None of the patients showed HBV or HCV infection (see Table S1 for clinical data). The exclusion criterion was an inadequate biopsy specimen with a length less than 2.5 cm. The mean biopsy length was 6.4 ± 3.8 cm. This work was approved by the National Cancer Center Institutional Review Board (#2017‐044).
2.2. Cell transfection
Human HCC cells were seeded at a density of 70 000 cells/cm2 in 35‐mm‐diameter culture dishes and transfected the next day using TransFectin lipid reagent (Bio‐Rad Laboratories). The cells were incubated with a transfection mix containing 100 nmol/L miRNA mimic or siRNA and 5 µL TransFectin in a 1.2 mL total volume of serum‐ and antibiotic‐free Opti‐MEM (Invitrogen) for 5 hours. For MYCN rescue experiments, the cells were incubated with 1.5 µg MYCN expression vector (plasmid #74163; Addgene) following the experimental procedure described above. The human miR‐493‐5p mimics (ID #MC10627, cat. #4464066) and negative control miRNA mimics (cat. #4464058) were purchased from Ambion. Human MYCN siRNAs (ID #s9133 and #s9135, siMYCN_A and siMYCN_B, respectively) were purchased from Ambion (cat. #4392420). The AllStars Negative Control siRNA (siCtrl) was from Qiagen (cat. #1027281).
2.3. Total RNA isolation
Both mRNA and miRNA were purified using a miRNeasy Mini Kit (Qiagen) according to the manufacturer’s protocol, and samples were treated with 1 mL DNase at 37°C for 30 minutes using a TURBO DNA‐free kit (Ambion). Total RNA was quantified using a NanoDrop 1000 spectrophotometer (Thermo Fisher Scientific), and the integrity of the RNA was evaluated with an Agilent 2100 Bioanalyzer (Agilent Technologies).
2.4. Gene expression microarray
For characterization of miR‐493‐5p targets, total RNAs were collected from Hep3B and HepG2 cells 72 hours after cell transfection using miR‐493‐5p and negative control miRNA mimics. Two distinct sets of data were obtained from experiments carried out at different times (http://www.ncbi.nlm.nih.gov/geo/query/acc.cgi?acc=GSE123313 and http://www.ncbi.nlm.nih.gov/geo/query/acc.cgi?acc=GSE125407, which were from our former17 and current study, respectively), using similar experimental conditions and cells with a comparable number of passages. RNA labeling and hybridization were undertaken using a human microRNA microarray kit (Protocol for Use with Agilent Gene Expression Oligo Microarrays version 5.7, Agilent Technologies). Microarray slides were scanned in an Agilent Technologies G2505C Microarray Scanner at 3 μm resolution. The raw data were processed using Feature Extraction Software version 10.7.3.1 from Agilent to analyze the array and calculate the intensities of the measured spots. We applied a more than 1.5‐fold change in signal intensity to identify significant differences in gene expression after miR‐493‐5p overexpression for each set of data. Genes with a greater than twofold change were extracted from the microarray (combined data from http://www.ncbi.nlm.nih.gov/geo/query/acc.cgi?acc=GSE123313 and http://www.ncbi.nlm.nih.gov/geo/query/acc.cgi?acc=GSE125407). Hierarchical clustering analyses were carried out using Pearson’s correlation. Heat maps were generated using the microarray data analysis tool Multi Experiment Viewer (http://mev.tm4.org). Gene set enrichment analysis was carried out using 2 distinct sets of data after miR‐493‐5p ectopic overexpression in HCC cells (http://software.broadinstitute.org/gsea).
2.5. mRNA and miRNA real‐time qPCR
To evaluate MYCN, FNDC5, and SCN5A expression levels, cDNAs were synthesized from 1 µg purified mRNA using SuperScript III Reverse Transcriptase (Invitrogen) according to the manufacturer’s recommendations. SYBR Green real‐time qPCR was carried out to evaluate the mRNA levels in each sample (Platinum SYBR Green qPCR SuperMix‐UDG; Invitrogen) using a Step One Plus Real‐time PCR System from Applied Biosystems. After initial denaturation at 95°C for 2 minutes, the thermal cycles were repeated 40 times as follows: 95°C for 15 seconds and 60°C for 30 seconds. The housekeeping gene GAPDH was used to normalize the cDNA levels. The sequences of the human primers used for gene amplification are shown in Table S2. For miRNA analyses, 100 ng total RNA was reverse‐transcribed using a TaqMan miRNA Reverse Transcription Kit from Applied Biosystems (cat. #4366597). The expression levels of mature miRNAs were determined using real‐time qPCR with TaqMan Universal PCR Master Mix (cat. #4324018; Applied Biosystems). The PCR conditions were 50°C for 2 minutes and 95°C for 10 minutes, followed by 40 cycles of 95°C for 15 seconds and 60°C for 1 minute. TaqMan probes from Applied Biosystems (cat. #4427975) were used to assess the expression of miR‐493‐5p (ID #001040), which was normalized to the endogenous level of RNU6B (ID #001093).
2.6. Immunoblotting
Total protein was extracted using Mammalian Protein Extraction Reagent (M‐PER; Thermo Fisher Scientific). For each sample, 10 µg protein was resolved by SDS‐PAGE (10%) and transferred to nitrocellulose membranes. The membranes were incubated overnight at 4°C with anti‐MYCN Ab from Santa Cruz Biotechnology (C‐19; cat. #sc‐791). Anti‐β‐tubulin Ab from Sigma (cat. #T4026) was used as a loading control. The antigen‐Ab complexes were visualized by chemiluminescence using ImmunoStar LD detection reagent from Wako (#290‐69904) and scanned with a Fujifilm LAS‐3000 imaging system. The bands were densitometrically analyzed using ImageJ software (version 1.50i; NIH).
2.7. 3′‐Untranslated region assay
Dual luciferase reporter plasmids were purchased from GeneCopoeia, where miR‐493‐5p binding sites #1 and #2 from the MYCN 3′‐UTR were cloned downstream of the firefly luciferase reporter gene into pEZX‐MT01 and pEZX‐MT06 vectors, respectively. Renilla luciferase activity driven by a CMV promoter was used for normalization. Simultaneous cell transfections with 3′‐UTR constructs (3 µg) and miR‐493‐5p mimics (100 nmol/L) were undertaken following the experimental procedure described above. Mutated MYCN vectors (sites #1 and #2) and control miRNA mimics were used as negative controls. HepG2 cells were collected after transfection, and protein was extracted using M‐PER (Thermo Fisher Scientific). The firefly and Renilla luciferase activities were assayed with a Dual‐Glo Luciferase Assay System (Promega), using a Synergy H4 Microplate Reader system (BioTek). The ratio of firefly : Renilla luminescence was calculated for each well and expressed as dual luciferase activity.
2.8. Cell growth assay
For the cell growth assessment, Hep3B cells were seeded at 10 000 cells per well in 96‐well plates 24 hours after transfection with MYCN siRNAs or miR‐493‐5p mimics and MYCN expression vector. Cell viability was measured at the indicated times by WST‐8 assay using a CCK‐8 (Dojindo). After cell culture medium was removed, 10 µL WST‐8 reagent and 100 µL fresh medium were added to each well. Cells were incubated at 37°C for 1 hour. The absorbance at 450 nm was measured using a Synergy H4 Microplate Reader system (BioTek).
2.9. Cell invasion assay
The invasion ability of Hep3B cells was assessed in 24‐well Biocoat Matrigel invasion chambers with an 8‐µm pore size (BD Biosciences) according to the manufacturer’s recommended protocol. Briefly, 48 hours following transfection with MYCN siRNAs or miR‐493‐5p mimics and MYCN expression vector, 50 000 cells were plated in the upper chamber with serum‐free medium. The bottom chamber contained 20% FBS as a chemoattractant. After incubation for 72 hours, cells that did not migrate through the membrane were removed using a cotton swab. Invasive cells on the lower surface of the membrane were fixed with methanol and stained using a Diff‐Quik staining kit (Sysmex). Cells were automatically counted using a BZ‐X700 microscope system (Keyence), and the average number of cells per field was calculated.
2.10. Statistical analysis
All experimental data are presented as the mean ± SD. Student’s t test was used to estimate statistical significance for most of the experiments. The equality of variances was tested using an F test, and a correction was applied in the case of unequal variance (Welch’s t test). All P values were 2‐tailed. The statistical significance of differences in MYCN and miR‐493‐5p expressions between HCC cell lines and normal hepatocytes (in vitro), and HCC tumors and their corresponding nontumor tissues (clinical samples) was assessed using a Mann‐Whitney U test. The MYCN and miR‐493‐5p expression correlation was assessed by calculating Spearman’s rank coefficient. The experimental data are representative of at least 3 independent experiments and were considered statistically significant at P < .05.
2.11. Accession numbers
Microarray datasets are deposited in the NCBI Gene Expression Omnibus (https://www.ncbi.nlm.nih.gov/geo/) under accession numbers http://www.ncbi.nlm.nih.gov/geo/query/acc.cgi?acc=GSE123313 and http://www.ncbi.nlm.nih.gov/geo/query/acc.cgi?acc=GSE125407.
3. RESULTS
3.1. MYCN, FNDC5, and SCN5A oncogenes are potential targets of miR‐493‐5p in hepatic cancer cells
To identify unknown critical targets by which miR‐493‐5p mediates its tumor suppressor activity in HCC cells, global gene expression was analyzed after miR‐493‐5p experimental reexpression in human HCC cells. Two microarray datasets were used for the analysis (http://www.ncbi.nlm.nih.gov/geo/query/acc.cgi?acc=GSE123313 and http://www.ncbi.nlm.nih.gov/geo/query/acc.cgi?acc=GSE125407, which were from our former study17 and current work, respectively). First, microarray expression profiles from the former and current studies showed 568 and 897 genes, respectively, which were downregulated by more than 1.5‐fold after miR‐495‐5p overexpression in Hep3B and HepG2 cells (Figure 1A). We extracted 154 genes from the data given their similar downregulation in both arrays (Figure 1B). Among these 154 candidate targets, 9 genes were consistently inhibited in both cell lines by more than twofold and included protein and nonprotein coding sequences (Figure 1C). However, two genes were excluded because their inhibition was not significant (P ≥ .05, t test) (Figure 1D). SCN5A, FNDC5, and MYCN appeared as attractive targets based on previous reports and their oncogenic properties. First, SCN5A protein, also known as Nav1.5, has been described as a driver of invasion in cases of aberrant expression in breast and colon cancer.19, 20 More interestingly, FNDC5 and MYCN have been specifically associated with liver cancer progression. Shi et al reported that FNDC5, a myokine also known as irisin, stimulated HepG2 cell proliferation and invasion by activating the PI3K/AKT pathway.21 Kojima’s group reported that MYCN levels could serve as a relevant prognostic factor for HCC given the strong association between MYCN gene expression and liver CSC markers.18
Figure 1.

Characterization of microRNA (miR)‐493‐5p potential targets in human hepatic cancer cells. A, Venn diagram summarizing the experimental approach used to identify miR‐493‐5p targets in hepatocellular carcinoma (HCC) cells. Diagrams depict the number of genes significantly downregulated (>1.5‐fold) after reexpression of miR‐493‐5p in Hep3B and HepG2 cells. Microarray data from http://www.ncbi.nlm.nih.gov/geo/query/acc.cgi?acc=GSE123313 and http://www.ncbi.nlm.nih.gov/geo/query/acc.cgi?acc=GSE125407 were used for the analysis. B, Venn diagram showing that 154 genes were commonly downregulated in both arrays. C, Expression profiles of miR‐493‐5p potential targets. Genes with a greater than twofold change (Log2) were extracted from the microarray. The scale bar encodes the logarithm of relative mRNA levels measured after experimental reexpression of miR‐493‐5p in HCC cells. D, Fold change (mean value) of the 9 genes downregulated after miR‐493‐5p overexpression. P values were calculated using a t test. Red dashed line delineates P values < .05
3.2. MYCN is overexpressed in hepatic cancer cells
To confirm the oncogenic feature of MYCN, FNDC5, and SCN5A in liver cancer, we first analyzed the expression levels of these 3 genes by real‐time qPCR in 3 different human HCC cell lines: Hep3B, HepG2, and Huh‐7. Control hepatocytes from 4 distinct donors were used as a control. MYCN was consistently overexpressed in the 3 cell lines (Figure 2). More precisely, HepG2 cells showed the lowest augmentation compared with normal hepatocytes (approximately fivefold), whereas MYCN mRNA levels were dramatically increased by 40‐fold and more than 5000‐fold in Hep3B and Huh‐7 cells, respectively. Conversely, the expression level of FNDC5 did not clearly increase. Indeed, although Hep3B cells showed robust overexpression, FNDC5 mRNA levels were inhibited in Huh‐7 cells and remained unchanged in HepG2 cells. Finally, SCNA5 was repressed in the 3 HCC cell lines. Consequently, we decided to further investigate the interaction between MYCN and miR‐493‐5p in hepatic cancer cells.
Figure 2.

MYCN, FNDC5, and SCN5A expression levels in hepatic tumor cells and human hepatocytes. Relative expression levels of MYCN, FNDC5, and SCN5A were determined by real‐time quantitative PCR (qPCR) in human hepatocellular carcinoma cell lines. Average expression levels measured in human hepatocytes from 4 different donors were used as a reference. The histograms show the mean ± SD. Statistical differences relative to control hepatocytes were reached at *P < .05 and ***P < .001 using a Mann‐Whitney U test. NS, not significant
3.3. MYCN overexpression is correlated with miR‐493‐5p silencing in hepatic tumor tissues from patients
Next, we tested whether miR‐493‐5p and MYCN expression levels could be measured and correlated in clinical samples from liver cancer patients. To this end, moderate to advanced HCC tumors (length > 2.5 cm) were selected for the study (Table S1), as we formerly reported that miR‐493‐5p epigenetic silencing positively correlated with tumor progression, notably in advanced HCC. Real‐time qPCR data showed that miR‐493‐5p expression levels were dramatically reduced in tumors compared with their adjacent surrounding nonneoplastic tissues (median, 0.075 and 0.743, respectively; P < .001, Mann‐Whitney U test) (Figure 3A). Conversely, MYCN was significantly overexpressed in HCC tissues (median, 2.500 and 0.333 in tumor and nontumor samples, respectively; P = .002, Mann‐Whitney U test) (Figure 3B). No significant correlations between MYCN expression and HCC tumor size were observed in clinical samples. However, an inverse correlation was confirmed between miR‐493‐5p and MYCN expression levels, with a Spearman’s coefficient of rank correlation rho value of −0.440 (P = .028) (Figure 3C).
Figure 3.

Measurement of microRNA (miR)‐493‐5p and MYCN expression levels in clinical samples from hepatocellular carcinoma (HCC) patients. A,B, Relative expression levels of (A) miR‐493‐5p and (B) MYCN in clinical samples. Patients showing moderate to advanced hepatic tumors (length > 2.5 cm) were selected for the study. The box plots illustrate differential gene expression in 13 primary HCC tumors (T) compared with the corresponding nontumor tissues (NT). Mann–Whitney U test was used to calculate P values. C, Scatter plots of Spearman’s correlation coefficient analysis between miR‐493‐5p and MYCN relative expression, measured by real‐time quantitative PCR in all clinical samples (T and NT, N = 26). Red and blue plots show T and NT tissues, respectively
3.4. MicroRNA‐493‐5p inhibits MYCN via 3′‐UTR targeting in liver cancer cells
To further investigate the potential interaction between miR‐493‐5p and the MYCN oncogene, MYCN expression was first evaluated at the mRNA and protein levels in response to miR‐493‐5p experimental reexpression in HCC cells. Importantly, the effective overexpression of miR‐493‐5p using miRNA mimics was confirmed given the prominent levels of miR‐493‐5p measured in transfected cells (Figure S1). Real‐time qPCR data showed that miR‐493‐5p mimics significantly altered MYCN expression, which was decreased by 80.3 ± 38.5%, 52.3 ± 5.0%, and 28.3 ± 5.4% in Hep3B, HepG2, and Huh‐7 cells, respectively (Figure 4A). Furthermore, immunoblotting confirmed that miR‐493‐5p forced expression was associated with a decrease in MYCN protein levels (Figure 4B).
Figure 4.
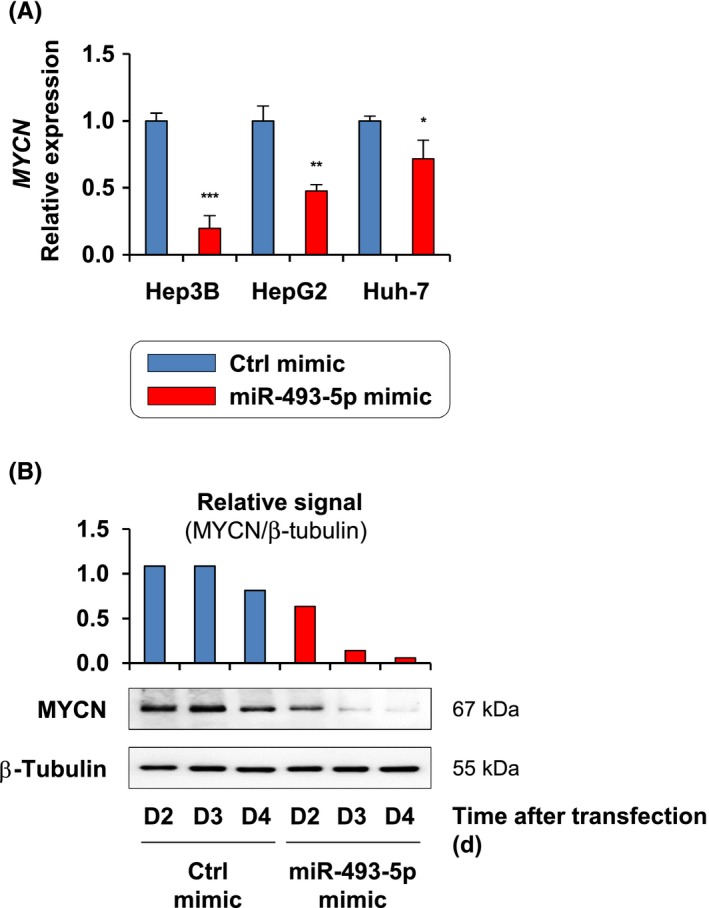
Analysis of MYCN mRNA and protein levels after microRNA (miR)‐493‐5p reexpression. A, Relative expression of MYCN following miR‐493‐5p rescue in hepatocellular carcinoma cells. Gene expression levels were measured 72 h after transfection with control (Ctrl) and miR‐493‐5p mimics. Histograms represent the mean ± SD. Significance was evaluated using a t test (n = 3). *P < .05, **P < .01, ***P < .001. B, MYCN protein levels determined by immunoblotting after miR‐493‐5p forced expression in Huh‐7 cells. Whole‐cell lysates were collected 48, 72, and 96 h after transfection. β‐Tubulin was used as a loading control
In silico analysis revealed that the MYCN 3′‐UTR contained 2 sequences that were partially complementary to miR‐493‐5p (Figure 5A). The identified binding sites, named sites #1 and #2, contained 6 and 5 nucleotide sequences, respectively, that might interact with miR‐493‐5p and potentially repress MYCN. Thus, 3′‐UTR assays were considered to validate this hypothesis, and HCC cells were transfected with miR‐493‐5p mimics and vectors that contained site #1 or site #2 sequence inserted downstream of a luciferase reporter. The 3′‐UTR assay showed that forced expression of miR‐493‐5p decreased luciferase activity from the value obtained with the control mimics, using both reporter vectors as follows: 16.8 ± 4.8% and 11.4 ± 4.6% for sites #1 and #2, respectively (P < .01 and P < .05, respectively; t test) (Figure 5B). Conversely, we did not observe inhibition of reporter activity in the cells transfected with construct vectors that contained a mutated sequence of miR‐493‐5p binding site #1 or #2. These results indicate the existence of a regulatory mechanism driven by miR‐493‐5p through direct targeting of 2 distinct regions in the MYCN 3′‐UTR.
Figure 5.

MYCN 3′‐UTR assay after ectopic overexpression of microRNA (miR)‐493‐5p. A, Depicted sequences indicate the complementarity between miR‐493‐5p and MYCN 3′‐UTR. Two potential binding sites were identified in the human MYCN 3′‐UTR (sites #1 and #2). B, Dual luciferase reporter assay was carried out after cotransfection of HepG2 cells with miR‐493‐5p mimics and the firefly Renilla luciferase construct containing MYCN 3′‐UTR site #1 or #2. Vectors containing a mutated sequence of MYCN 3′‐UTR (site #1 or #2) were used as negative controls. Luciferase activities were measured and the ratios of firefly : Renilla luciferase activities were determined. Histograms represent the mean ± SD. Significance was evaluated using a t test (n = 3). *P < .05, **P < .01. Ctrl, control; Mut, mutated; WT, wild type
3.5. MYCN knockdown mimics the tumor suppressor effect of miR‐493‐5p in hepatic tumor cells
To clarify the impact of the miR‐493‐5p/MYCN axis in liver cancer, we tested whether MYCN experimental silencing could mimic the tumor suppressor activity mediated by miR‐493‐5p overexpression in HCC cells. For this purpose, 2 distinct siRNAs were selected given their ability to inhibit MYCN expression (Figure S2). First, viability assays showed that HCC cell growth was significantly decreased in response to MYCN experimental repression compared with the control cells, which expressed higher levels of the oncogene (Figure 6A). More precisely, cancer cell growth activity was inhibited by 22.2 ± 1.0% and 23.3 ± 0.6% using siMYCN_A and siMYCN_B, respectively (P < .01, t test at day 4). Next, we analyzed the invasiveness of HCC cells with Transwell migration assays using Matrigel‐coated invasion chambers (Figure 6B). MYCN knockdown markedly altered cell invasion by 69.0 ± 13.3% and 74.4 ± 9.6% (siMYCN_A and siMYCN_B, respectively) compared with the control cells (P < .05, t test).
Figure 6.

Effect of MYCN knockdown and rescue on hepatic cancer cell growth and invasion. A, Hep3B cell growth assessment after MYCN silencing. Two distinct siRNAs were used to target MYCN (siMYCN_A and siMYCN_B). Scrambled siRNA was used as a negative control (siCtrl). Number of cells was estimated at the indicated times using a cell viability assay. B, Invasive abilities of Hep3B cells after MYCN knockdown. Cells that migrated through the Matrigel‐coated membrane were counted after 72 h. Photographs are representative of cell invasion for each condition. C, Cell viability. D, Invasion assay after MYCN and microRNA (miR)‐493‐5p overexpression in Hep3B cells (rescue experiment). MYCN expression vector did not contain MYCN mRNA 3′‐UTR. Cell viability was measured after 4 d. Validation of MYCN expression vector compared with the mock is shown in Figure S3. Data depicted in the figure show the mean ± SD. Significant differences were evaluated with a t test (n = 3). *P < .05, **P < .01, ***P < .001
Rescue experiments confirmed that overexpression of miR‐493‐5p‐resistant MYCN (without MYCN 3′‐UTR) restored HCC cell viability (Figure 6C) and invasion (Figure 6D) in Hep3B cells transfected with miR‐493‐5p mimics (Figure S3). Together, these results were fully consistent with the tumor suppressor activity of miR‐493‐5p in liver cancer cells, which has been previously reported by our group,17 and showed that MYCN repression contributed to miR‐493‐5p‐mediated HCC tumor inhibition. Gene set enrichment analysis also supported the anticancer activity of miR‐493‐5p after its reexpression in HCC cells (Figure 7A). Gene set enrichment analysis highlighted significant enrichment of gene sets related to cell cycle progression and proliferation in control HCC cells vs miR‐493‐5p‐rescued cells. In particular, the gene set for “cell division and cell cycle progression” included PLK4, CCNA2, and PLK1, which are critical for cell division (Figure 7B). Conversely, we confirmed that several pathways associated with cell junction and adhesion were enriched in miR‐493‐5p‐rescued cells vs control HCC cells (Figure 7A,C), which supported the antiinvasion properties of miR‐493‐5p.
Figure 7.

Assessment of microRNA (miR)‐493‐5p tumor suppressor activity by gene set enrichment analysis (GSEA). A, GSEA was carried out to evaluate the anticancer effect of miR‐493‐5p in Hep3B and HepG2 cells. Combined data from http://www.ncbi.nlm.nih.gov/geo/query/acc.cgi?acc=GSE125407 and http://www.ncbi.nlm.nih.gov/geo/query/acc.cgi?acc=GSE123313 were used for the analysis. Table shows the molecular signatures highlighting the antiproliferation and antiinvasion effect of miR‐493‐5p. B, Enrichment plot and heat map for the genes involved in cell division and cell cycle progression (G2/M) in hepatocellular carcinoma (HCC) control cells vs miR‐493‐5p‐rescued cells (Hallmark gene set_G2/M checkpoint; normalized enrichment score [NES] = 2.073; P < .001). C, Enrichment plot and heat map for genes involved in cell‐cell junction or cell‐ECM interaction in miR‐493‐5p‐rescued cells vs HCC control cells (GO biological process_cell junction organization; NES = 1.985; P < .001). See Tables S3 and S4 for Hallmark gene set_G2/M checkpoint and GO biological process_cell junction organization enriched genes, respectively
4. DISCUSSION
In the present work, we identified MYCN as a critical oncogene posttranscriptionally repressed by miR‐493‐5p. This finding strengthens the pivotal tumor suppressor feature of miR‐493‐5p previously described by our group in hepatic cancer cells. Although MYCN inhibition can explain part of the antitumor effect mediated by miR‐493‐5p reexpression, it also appears reasonable, based on our current knowledge, to consider that direct repression of other key oncogenes, such as IGF2 or miR‐483, by miR‐493‐5p could contribute to negatively control the malignant properties of hepatic tumor cells in a synergistic way. In silico analyses have strongly supported the idea that a single miRNA could potentially pair with multiple targets and modulate their expression. To date, 1917 miRNAs have been identified in humans (miRBase, release 22.1, October 2018). This count can be doubled considering both the 3′‐ and 5′‐ arms, which correspond to the 3p and 5p forms of mature miRNAs. However, computational studies have reported more than 45 000 miRNA target sites conserved within human 3′‐UTRs (approximately 60% of protein‐coding genes),22 which is far larger than all the miRNAs characterized so far and arguing for the pleiotropic activity of miRNAs.
In agreement with our observations, recent studies confirmed the critical antitumor effect of miR‐493‐5p through the modulation of distinct oncogenes in liver cancer (Table 1). Zhao and collaborators showed that overexpression of miR‐493‐5p suppressed hepatic tumor growth through cell cycle arrest and apoptosis by directly targeting GOLM1.23 Also known as GP73, GOLM1 is frequently upregulated in HCC tissues and serum from patients.24 Another study by Wang and coworkers also described the tumor suppressor role of miR‐493‐5p and its inhibition in liver cancer cells.25 Notably, this second work reported that miR‐493‐5p suppressed the migration of hepatic cancer cells by negatively regulating the expression of vesicle‐associated membrane protein 2 (VAMP2), an oncogenic protein. The tumor suppressor role of miR‐493‐5p has been described in other types of solid tumors.26, 27, 28, 29, 30 We previously characterized miR‐493‐5p anticancer activity and described a miRNA‐dependent regulatory mechanism between two distinct imprinted loci: (i) the MEG3‐miR‐493 locus, which was found to be epigenetically silenced by MEG3‐differentially regulated region hypermethylation in liver cancer cell lines and hepatic tumors from patients; and (ii) the IGF2‐miR‐483 locus, which was found to be overexpressed in hepatic cancer cells exhibiting IGF2 loss of imprinting.17 In addition, we reported the epigenetic silencing of miR‐148a and miR‐122, 2 other major tumor suppressor miRNAs, through CpG hypermethylation in HCC cells and tissues.16, 31 Similar to miR‐493‐5p, miR‐122 is a central tumor suppressor miRNA with a large spectrum of action, which can repress HCC progression by controlling the expression of various target genes involved in tumor growth, migration, and cell viability.32, 33, 34 Interestingly, several studies have supported the therapeutic value of demethylating agents for the reactivation of epigenetically controlled genes and miRNAs with antitumor effects.35, 36, 37
Table 1.
Validated therapeutic targets of microRNA (miR)‐493‐5p in hepatic cancer cells
| Target | Activity | Year | Authors | Reference |
|---|---|---|---|---|
| Oncogenes | ||||
| MYCN | Proliferation, invasion | 2019 | Yasukawa et al | This study |
| IGF2 | Tumor growth, invasion | 2019 | Gailhouste et al | 17 |
| VAMP2 | Invasion | 2018 | Wang et al | 25 |
| GOLM1 (GP73) | Cell cycle, survival | 2017 | Zhao et al | 23 |
| Oncomir | ||||
| miR‐483‐3p | Tumor growth, invasion | 2019 | Gailhouste et al | 17 |
The canonical oncogene MYCN is normally expressed in the migrating neural crest and encodes a phosphoprotein that belongs to the Myc network of transcriptional regulators, which play a role in governing cell growth, apoptosis, and differentiation.38 Amplification of the MYCN locus has been reported in 20–30% of neuroblastoma cases and is one of the strongest clinical predictors of poor prognosis.39, 40 Using transcriptome analysis, Kojima’s group recently identified MYCN as a target of ACR,18 a retinoid acid that exhibits anti‐HCC properties.41 Selectively, ACR induced death in the liver CSC subpopulation overexpressing MYCN. Previous investigations have found the interconnection between MYCN and miRNAs. For example, a study based on the modeling of miRNA‐mRNA interactions identified a regulatory network involving MYCN and the tumor suppressor miR‐204 that operated during neuroblastoma tumorigenesis.42 This work showed that miR‐204 directly bound MYCN mRNA and decreased its protein levels. Additionally, MYCN was able to bind the promoter of miR‐204 and inhibit the expression of the miRNA. Conversely, Ma and coworkers showed that MYCN activated the expression of miR‐9, an oncomir, which subsequently promoted metastasis by targeting the 3′‐UTR of cadherin 1 in breast cancer cells.43
In conclusion, our study shows that miR‐493‐5p mediates part of its tumor suppressor activity by negatively regulating the oncogene MYCN in hepatic cancer cells. In agreement with our previous investigations, these results support the pivotal anticancer role played by this miRNA through directly targeting multiple oncogenes. This work also suggests that further characterization of central tumor suppressor miRNAs with large spectra of actions could represent a valuable source of information for the development of future miRNA‐based therapies.
DISCLOSURE
The authors declare no competing interests.
Supporting information
ACKNOWLEDGMENTS
We thank A. Inoue for technical assistance. The authors are also grateful to Y. Naito for managing the collection of clinical samples. This work was supported by grants from the Ministry of Health, Labour, and Welfare of Japan, Japan Agency for Medical Research and Development, and RIKEN Incentive Research Projects.
Yasukawa K, Liew LC, Hagiwara K, et al. MicroRNA‐493‐5p‐mediated repression of the MYCN oncogene inhibits hepatic cancer cell growth and invasion. Cancer Sci. 2020;111:869–880. 10.1111/cas.14292
This article is dedicated to the memory of Dr Soichi Kojima, who suddenly passed away during the preparation of the manuscript.
Ken Yasukawa and Luc Gailhouste contributed equally.
REFERENCES
- 1. Bray F, Ferlay J, Soerjomataram I, Siegel RL, Torre LA, Jemal A. Global cancer statistics 2018: GLOBOCAN estimates of incidence and mortality worldwide for 36 cancers in 185 countries. CA Cancer J Clin. 2018;68:394‐424. [DOI] [PubMed] [Google Scholar]
- 2. El‐Serag HB. Hepatocellular carcinoma. N Engl J Med. 2011;365:1118‐1127. [DOI] [PubMed] [Google Scholar]
- 3. Forner A, Reig M, Bruix J. Hepatocellular carcinoma. Lancet. 2018;391:1301‐1314. [DOI] [PubMed] [Google Scholar]
- 4. Villanueva A, Llovet JM. Second‐line therapies in hepatocellular carcinoma: emergence of resistance to sorafenib. Clin Cancer Res. 2012;18:1824‐1826. [DOI] [PMC free article] [PubMed] [Google Scholar]
- 5. Gebert LFR, MacRae IJ. Regulation of microRNA function in animals. Nat Rev Mol Cell Biol. 2019;20:21‐37. [DOI] [PMC free article] [PubMed] [Google Scholar]
- 6. Bartel DP. MicroRNAs: target recognition and regulatory functions. Cell. 2009;136:215‐233. [DOI] [PMC free article] [PubMed] [Google Scholar]
- 7. Mendell JT, Olson EN. MicroRNAs in stress signaling and human disease. Cell. 2012;148:1172‐1187. [DOI] [PMC free article] [PubMed] [Google Scholar]
- 8. Calin GA, Croce CM. MicroRNA signatures in human cancers. Nat Rev Cancer. 2006;6:857‐866. [DOI] [PubMed] [Google Scholar]
- 9. Lujambio A, Lowe SW. The microcosmos of cancer. Nature. 2012;482:347‐355. [DOI] [PMC free article] [PubMed] [Google Scholar]
- 10. Gailhouste L, Ochiya T. Cancer‐related microRNAs and their role as tumor suppressors and oncogenes in hepatocellular carcinoma. Histol Histopathol. 2013;28:437‐451. [DOI] [PubMed] [Google Scholar]
- 11. Kota J, Chivukula RR, O'Donnell KA, et al. Therapeutic microRNA delivery suppresses tumorigenesis in a murine liver cancer model. Cell. 2009;137:1005‐1017. [DOI] [PMC free article] [PubMed] [Google Scholar]
- 12. Jung KH, Zhang J, Zhou C, et al. Differentiation therapy for hepatocellular carcinoma: Multifaceted effects of miR‐148a on tumor growth and phenotype and liver fibrosis. Hepatology. 2016;63:864‐879. [DOI] [PMC free article] [PubMed] [Google Scholar]
- 13. Li L, Liu Y, Guo Y, et al. Regulatory MiR‐148a‐ACVR1/BMP circuit defines a cancer stem cell‐like aggressive subtype of hepatocellular carcinoma. Hepatology. 2015;61:574‐584. [DOI] [PMC free article] [PubMed] [Google Scholar]
- 14. Zhang JP, Zeng C, Xu L, Gong J, Fang JH, Zhuang SM. MicroRNA‐148a suppresses the epithelial‐mesenchymal transition and metastasis of hepatoma cells by targeting Met/Snail signaling. Oncogene. 2014;33:4069‐4076. [DOI] [PubMed] [Google Scholar]
- 15. Xu X, Fan Z, Kang L, et al. Hepatitis B virus X protein represses miRNA‐148a to enhance tumorigenesis. J Clin Invest. 2013;123:630‐645. [DOI] [PMC free article] [PubMed] [Google Scholar]
- 16. Gailhouste L, Gomez‐Santos L, Hagiwara K, et al. miR‐148a plays a pivotal role in the liver by promoting the hepatospecific phenotype and suppressing the invasiveness of transformed cells. Hepatology. 2013;58:1153‐1165. [DOI] [PubMed] [Google Scholar]
- 17. Gailhouste L, Liew LC, Yasukawa K, et al. MEG3‐derived miR‐493‐5p overcomes the oncogenic feature of IGF2‐miR‐483 loss of imprinting in hepatic cancer cells. Cell Death Dis. 2019;10:553. [DOI] [PMC free article] [PubMed] [Google Scholar]
- 18. Qin XY, Suzuki H, Honda M, et al. Prevention of hepatocellular carcinoma by targeting MYCN‐positive liver cancer stem cells with acyclic retinoid. Proc Natl Acad Sci USA. 2018;115:4969‐4974. [DOI] [PMC free article] [PubMed] [Google Scholar]
- 19. Yang M, Kozminski DJ, Wold LA, et al. Therapeutic potential for phenytoin: targeting Na(v)1.5 sodium channels to reduce migration and invasion in metastatic breast cancer. Breast Cancer Res Treat. 2012;134:603‐615. [DOI] [PMC free article] [PubMed] [Google Scholar]
- 20. House CD, Vaske CJ, Schwartz AM, et al. Voltage‐gated Na+ channel SCN5A is a key regulator of a gene transcriptional network that controls colon cancer invasion. Cancer Res. 2010;70:6957‐6967. [DOI] [PMC free article] [PubMed] [Google Scholar]
- 21. Shi G, Tang N, Qiu J, et al. Irisin stimulates cell proliferation and invasion by targeting the PI3K/AKT pathway in human hepatocellular carcinoma. Biochem Biophys Res Commun. 2017;493:585‐591. [DOI] [PubMed] [Google Scholar]
- 22. Friedman RC, Farh KK, Burge CB, Bartel DP. Most mammalian mRNAs are conserved targets of microRNAs. Genome Res. 2009;19:92‐105. [DOI] [PMC free article] [PubMed] [Google Scholar]
- 23. Zhao J, Xu T, Wang F, Cai W, Chen L. miR‐493‐5p suppresses hepatocellular carcinoma cell proliferation through targeting GP73. Biomed Pharmacother. 2017;90:744‐751. [DOI] [PubMed] [Google Scholar]
- 24. Marrero JA, Romano PR, Nikolaeva O, et al. GP73, a resident Golgi glycoprotein, is a novel serum marker for hepatocellular carcinoma. J Hepatol. 2005;43:1007‐1012. [DOI] [PubMed] [Google Scholar]
- 25. Wang G, Fang X, Han M, Wang X, Huang Q. MicroRNA‐493‐5p promotes apoptosis and suppresses proliferation and invasion in liver cancer cells by targeting VAMP2. Int J Mol Med. 2018;41:1740‐1748. [DOI] [PubMed] [Google Scholar]
- 26. Zhang Z, Luo G, Yu C, Yu G, Jiang R, Shi X. MicroRNA‐493‐5p inhibits proliferation and metastasis of osteosarcoma cells by targeting Kruppel‐like factor 5. J Cell Physiol. 2019;234:13525‐13533. [DOI] [PubMed] [Google Scholar]
- 27. Meghani K, Fuchs W, Detappe A, et al. Multifaceted impact of microRNA 493–5p on genome‐stabilizing pathways induces platinum and PARP inhibitor resistance in BRCA2‐mutated carcinomas. Cell Rep. 2018;23:100‐111. [DOI] [PMC free article] [PubMed] [Google Scholar]
- 28. Gu Y, Zhang Z, Yin J, et al. Epigenetic silencing of miR‐493 increases the resistance to cisplatin in lung cancer by targeting tongue cancer resistance‐related protein 1(TCRP1). J Exp Clin Cancer Res. 2017;36:114. [DOI] [PMC free article] [PubMed] [Google Scholar]
- 29. Zhao L, Feng X, Song X, et al. miR‐493‐5p attenuates the invasiveness and tumorigenicity in human breast cancer by targeting FUT4. Oncol Rep. 2016;36:1007‐1015. [DOI] [PubMed] [Google Scholar]
- 30. Okamoto K, Ishiguro T, Midorikawa Y, et al. miR‐493 induction during carcinogenesis blocks metastatic settlement of colon cancer cells in liver. EMBO J. 2012;31:1752‐1763. [DOI] [PMC free article] [PubMed] [Google Scholar]
- 31. Gailhouste L, Liew LC, Yasukawa K, et al. Differentiation therapy by epigenetic reconditioning exerts antitumor effects on liver cancer cells. Mol Ther. 2018;26:1840‐1854. [DOI] [PMC free article] [PubMed] [Google Scholar]
- 32. Gailhouste L, Gomez‐Santos L, Ochiya T. Potential applications of miRNAs as diagnostic and prognostic markers in liver cancer. Front Biosci. 2013;18:199‐223. [DOI] [PubMed] [Google Scholar]
- 33. Girard M, Jacquemin E, Munnich A, Lyonnet S, Henrion‐Caude A. miR‐122, a paradigm for the role of microRNAs in the liver. J Hepatol. 2008;48:648‐656. [DOI] [PubMed] [Google Scholar]
- 34. Gramantieri L, Ferracin M, Fornari F, et al. Cyclin G1 is a target of miR‐122a, a microRNA frequently down‐regulated in human hepatocellular carcinoma. Cancer Res. 2007;67:6092‐6099. [DOI] [PubMed] [Google Scholar]
- 35. Gailhouste L, Liew LC, Hatada I, Nakagama H, Ochiya T. Epigenetic reprogramming using 5‐azacytidine promotes an anti‐cancer response in pancreatic adenocarcinoma cells. Cell Death Dis. 2018;9:468. [DOI] [PMC free article] [PubMed] [Google Scholar]
- 36. Gailhouste L, Liew LC, Yasukawa K, et al. Epigenetic reprogramming of human hepatoma cells: a low‐cost option for drug metabolism assessment. Cell Mol Gastroenterol Hepatol. 2017;5:454‐457. [DOI] [PMC free article] [PubMed] [Google Scholar]
- 37. Tsai HC, Li H, Van Neste L, et al. Transient low doses of DNA‐demethylating agents exert durable antitumor effects on hematological and epithelial tumor cells. Cancer Cell. 2012;21:430‐446. [DOI] [PMC free article] [PubMed] [Google Scholar]
- 38. Meyer N, Penn LZ. Reflecting on 25 years with MYC. Nat Rev Cancer. 2008;8:976‐990. [DOI] [PubMed] [Google Scholar]
- 39. Brodeur GM. Neuroblastoma: biological insights into a clinical enigma. Nat Rev Cancer. 2003;3:203‐216. [DOI] [PubMed] [Google Scholar]
- 40. Maris JM, Hogarty MD, Bagatell R, Cohn SL. Neuroblastoma. Lancet. 2007;369:2106‐2120. [DOI] [PubMed] [Google Scholar]
- 41. Muto Y, Moriwaki H, Ninomiya M, et al. Prevention of second primary tumors by an acyclic retinoid, polyprenoic acid, in patients with hepatocellular carcinoma. Hepatoma Prevention Study Group. N Engl J Med. 1996;334:1561‐1567. [DOI] [PubMed] [Google Scholar]
- 42. Ooi CY, Carter DR, Liu B, et al. Network modeling of microRNA‐mRNA interactions in neuroblastoma tumorigenesis identifies miR‐204 as a direct inhibitor of MYCN. Cancer Res. 2018;78:3122‐3134. [DOI] [PubMed] [Google Scholar]
- 43. Ma L, Young J, Prabhala H, et al. miR‐9, a MYC/MYCN‐activated microRNA, regulates E‐cadherin and cancer metastasis. Nat Cell Biol. 2010;12:247‐256. [DOI] [PMC free article] [PubMed] [Google Scholar]
Associated Data
This section collects any data citations, data availability statements, or supplementary materials included in this article.
Supplementary Materials