

Abstract
Upstream ORF (uORF) is a translational initiation element located in the 5′UTR of eukaryotic mRNAs. Studies have found that uORFs play an important regulatory role in many diseases. Based on The Cancer Genome Atlas database, the results of our experiments and previous research evidence, we investigated transcription factor AP‐4 (TFAP4) and its uORF, LIM and SH3 protein 1 (LASP1), long noncoding RNA 00520 (LINC00520), and microRNA (miR)‐520f‐3p as candidates involved in glioma malignancy, which is a poorly understood process. Both TFAP4‐66aa‐uORF and miR‐520f‐3p were downregulated, and TFAP4, LASP1, and LINC00520 were highly expressed in glioma tissues and cells. TFAP4‐66aa‐uORF or miR‐520f‐3p overexpression or TFAP4, LASP1, or LINC00520 knockdown inhibited glioma cell proliferation, migration, and invasion, but promoted apoptosis. TFAP4‐66aa‐uORF inhibited the translation of TFAP4 by binding to the TFAP4 mRNA. MicroRNA‐520f‐3p inhibited TFAP4 expression by binding to its 3′UTR. However, LINC00520 could promote the expression of TFAP4 by competitively binding to miR‐520f‐3p. In addition, TFAP4 transcriptionally activated LASP1 and LINC00520 expression by binding to their promoter regions, forming a positive feedback loop of TFAP4/LINC00520/miR‐520f‐3p. Our findings together indicated that TFAP4‐66aa‐uORF inhibited the TFAP4/LINC00520/miR‐520f‐3p feedback loop by directly inhibiting TFAP4 expression, subsequently leading to inhibition of glioma malignancy. This provides a basis for developing new therapeutic approaches for glioma treatment.
Keywords: glioma, long noncoding RNA, miR‐520f‐3p, transcription factor AP‐4, upstream open reading frame
This study used TFAP4‐66aa‐uORF as a starting point to reveal a new mechanism for regulating the malignant biological behavior of glioma cells, and also provides new strategies and new approaches for the treatment of gliomas.
Abbreviations
- AAP
arginine attenuating peptide
- CASP2
caspase‐2
- CDS
coding sequence region
- GAS5
growth arrest‐specific 5
- HA
human astrocyte
- LASP1
LIM and SH3 protein 1
- LGGT
low‐grade glioma tissue
- LINC
long noncoding RNA
- miR
microRNA
- NBT
normal brain tissue
- qRT‐PCR
quantitative real‐time PCR
- RIP
RNA immunoprecipitation
- RISC
RNA‐induced silencing complex
- TFAP4
transcription factor AP‐4
- uORF
upstream ORF
1. INTRODUCTION
Glioma is the most invasive intracranial tumor in the central nervous system.1, 2 The current treatment methods are surgery‐based with postoperative radiotherapy and chemotherapy, but the prognosis is still very poor.3, 4 An in‐depth knowledge of the molecular mechanism of the malignant biological behaviors of glioma could help improve the treatment of gliomas.
Upstream ORF is a translational initiation element located in the 5′UTR of eukaryotic mRNAs. The uORFs could encode proteins and usually start at the upstream start codon uAUG and terminate in an upstream terminator.5 The main function of uORF is to regulate gene expression during gene translation.6 There is evidence that uORF has a vital regulatory role in some diseases including cancer, endocrine and metabolic diseases, and neurological diseases.7, 8
Transcription factor AP‐4 is a member of the basic helix‐loop‐helix‐zipper family, which contains a basic DNA binding domain. Transcription factor AP‐4 can activate viral and cellular genes by binding to the CAGCTG of a symmetrical DNA sequence.9 Transcription factor AP‐4 could be a major regulator of neuroblastoma, and its knockdown can induce the differentiation of neuroblastoma.10 In addition, scrutiny of the GEPIA bioinformatics database revealed high expression of TFAP4 in LGGTs, and the survival curve based on its expression level in patients with LGG is shown in Figure S1. At present, the expression and function of TFAP4 in glioma remains unexplored.
LIM and SH3 protein 1 belongs to the subfamily of LIM proteins and the nebulin family of actin‐binding proteins. It is highly expressed in invasive breast cancer11 and colon cancer tissues, and promotes colon cancer cell proliferation.12
Long noncoding RNA has a length of more than 200 nucleotides and are mainly involved in gene transcription and posttranscriptional regulation.13, 14, 15 For example, LINC00667 is upregulated in glioma tissues and cells.16 Growth arrest‐specific 5 ncRNA is under‐expressed in glioma cells, and the overexpression of GAS5 inhibits the malignant behaviors of glioma cells.17 LINC00520, which is located on the human chromosome 14 arm, aggravates renal ischemia/reperfusion injury by activating the PI3K/AKT pathway.18 LINC00520 inhibits the PI3K/AKT pathway for epidermal growth factor receptor, subsequently inhibiting the formation of squamous cell carcinoma tumors in skin.19 However, the expression and function of LINC00520 in glioma cells is still unclear.
MicroRNAs, which are 20‐25 nucleotides in length, are involved in posttranscriptional regulation of gene expression in multicellular organisms. Mutations and disorders of miRNAs are often closely related to human tumors.20, 21 As examples, miR‐217 is underexpressed in glioma tissues and cells,22 miR‐4286 inhibits proliferation and migration of nonsmall‐cell carcinoma cells,23 and miR‐494 reduces the activity of CASP2 and inhibits the proliferation of nonsmall‐cell lung cancer.24 A study implicated miR‐520f‐3p as a potential tumor suppressor for breast cancer.25 However, the influence and mechanism of miR‐520f‐3p on the malignant biological behaviors of glioma cells are unknown.
The current study investigated the endogenous expression of TFAP4‐66aa‐uORF, TFAP4, LASP1, LINC00520, and miR‐520f‐3p in glioma tissues and cells, and examined the intermolecular regulatory relationship and mechanism of these molecules in cell biology. The purpose was to reveal developmental mechanisms of gliomas that can assist in the development of novel treatment strategies for gliomas.
2. MATERIALS AND METHODS
2.1. Tissue specimens
All human glioma specimens were obtained from patients undergoing surgery in the department of neurosurgery of Shengjing Hospital of China Medical University (Shenyang, China), from March 2015 to March 2018. All patients provided informed consent and the project was approved by the ethics committee of Shengjing Hospital of China Medical University. According to the WHO 2007 classification, we divided glioma specimens into 2 groups: grade I‐II (n = 12), and grade III‐IV (n = 12). Normal brain tissues, which were regarded as the negative control (n = 12), were collected from fresh autopsy materials donated by patients who died in traumatic events and were verified as without brain disease.
2.2. Cell culture
Human U87 and U251 glioma cell lines and HEK293 cells were bought from Shanghai Institutes for Biological Sciences Cell Resource Center. Primary normal HAs were purchased from the Sciencell Research Laboratories and cultivated according to the manufacturer under the indicated conditions. Also see Appendix S1.
2.3. Reverse transcription and qRT‐PCR
TRIzol reagent (Life Technologies) was used to extract total RNA, which consisted of human tissue samples and HA, U87, and U251 cells. More details are provided in Appendix S1. The primers are shown in Table S1.
2.4. Western blot analysis
Western blot assay was executed as previously reported.16 For more details, see Appendix S1.
2.5. Cell transfections
Cell transfections were undertaken as previously reported.16 More details are provided in Appendix S1. The transfection efficiency is indicated in Figure S2.
2.6. Cell Counting Kit‐8 assay
Cell Counting Kit‐8 assay was used to detect glioma cell proliferation. More details are provided in Appendix S1.
2.7. Cell Transwell assays
Cell Transwell assays were used to explore glioma cell migration and invasion. For more details, see Appendix S1.
2.8. Apoptosis analysis
Apoptosis was determined by Annexin V‐PE/7AAD staining (Southern Biotech) according to the manufacturer’s instructions (Appendix S1).
2.9. Reporter vector construction and luciferase reporter assays
Reporter vector construction and luciferase reporter assays was carried out as previously reported.16 More details are available in Appendix S1.
2.10. RNA immunoprecipitation assay
RNA immunoprecipitation assay was carried out as previously reported.16 For more details, see Appendix S1.
2.11. Chromatin immunoprecipitation assay
Chromatin immunoprecipitation assay was undertaken as previously reported.16 More details are available in Appendix S1. The primer sequences are shown in Table S2.
2.12. Microarray analysis
Microarray hybridization and data collection were undertaken with the help of KangChen Bio‐tech.
2.13. Tumor xenografts in nude mice
Four‐week‐old female athymic nude mice (BALB/C) were purchased from the National Laboratory Animal Center. Tumor xenografts in nude mice was undertaken as previously reported.16 Stably expressing U87 and U251 glioma cells were used for in vivo assays. All experiments with nude mice were carried out strictly in accordance with a protocol approved by the Administrative Panel on Laboratory Animal Care of the China Medical University. For more details, see Appendix S1.
2.14. Statistical analysis
Statistical analysis was undertaken using GraphPad Prism version 5.01 (GraphPad Software) with Student’s t test (2‐tailed) or 1‐way ANOVA. When P < .05, the differences were considered significant.
3. RESULTS
3.1. Overexpression of TFAP4‐66aa‐uORF inhibited malignancy of glioma cells
The expression of TFAP4‐66aa‐uORF in NBTs, LGGTs, high‐grade glioma tissues, HA cells, and U87 and U251 glioma cells were tested by western blot analysis. The results revealed that the expression of TFAP4‐66aa‐uORF in glioma tissues was lower than that in NBTs, and the expression decreased as the pathological grade level increased (Figure 1A). The expression in U87 and U251 glioma cells was significantly lower than that in HA cells (Figure 1B).
Figure 1.
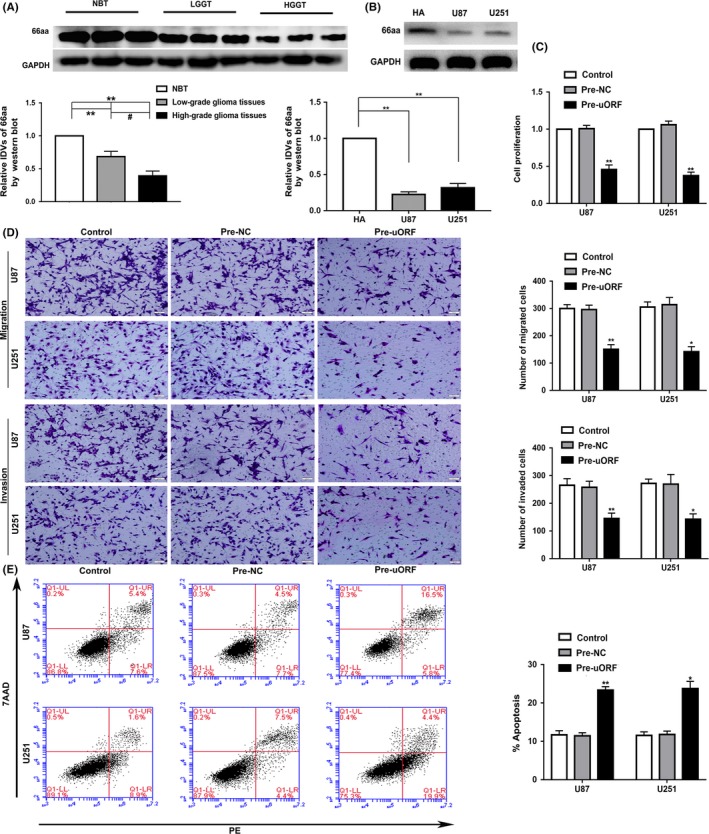
Endogenous expression and malignant biological behavior of transcription factor AP‐4 (TFAP4)‐66aa‐upstream ORF (uORF) in glioma. A, 66aa‐uORF protein level in normal brain tissues (NBTs) and glioma tissues of different grades. Integrated density values (IDVs) of the blot bands were statistically analyzed. Data are presented as the mean ± SD (n = 12). *P < .05, **P < .01, # P < .05. B, 66aa‐uORF protein level in human astrocytes (HA), and glioma cell lines (U87 and U251). Data are presented as the mean ± SD (n = 3). **P < .01. C‐E, CCK‐8 assay, Transwell assay, and flow cytometry analysis was used to detect the effects of TFAP4‐66aa‐uORF overexpression (pre‐uORF) on proliferation, migration, invasion and apoptosis. *P < .05 vs pre‐NC (negative control), **P < .01 vs pre‐NC. Scale bar = 50 μm. Data are presented as the mean ± SD (n = 3). HGGT, high‐grade glioma tissue; LGGT, low‐grade glioma tissue; PE, phycoerythrin
The U87 and U251 glioma cells were then transfected with overexpression plasmid of TFAP4‐66aa‐uORF. Compared with the pre‐NC group, the cell proliferation, migration, and invasion ability of the pre‐uORF group were significantly reduced, while the apoptosis rate was increased (Figure 1C‐E). Together, these results indicate that TFAP4‐66aa‐uORF expression can inhibit the malignant behaviors of glioma cells.
3.2. Expression of TFAP4 negatively regulated by TFAP4‐66aa‐uORF
The expression of TFAP4 was higher in glioma tissues than in NBTs, and increased with the pathological grade level (Figure 2A). Its expression in glioma cell lines was also significantly higher than in HA cells (Figure 2B). To explore the function of TFAP4 on glioma cells, TFAP4 overexpression and knockdown were transfected in glioma cells. As shown in Figure 2C‐E, the proliferation, migration, and invasion ability of the TFAP4(+) group were increased, and the apoptosis rate was decreased. In contrast, the cell proliferation, migration, and invasion ability of the TFAP4(−) group were decreased, and the apoptosis rate was increased.
Figure 2.
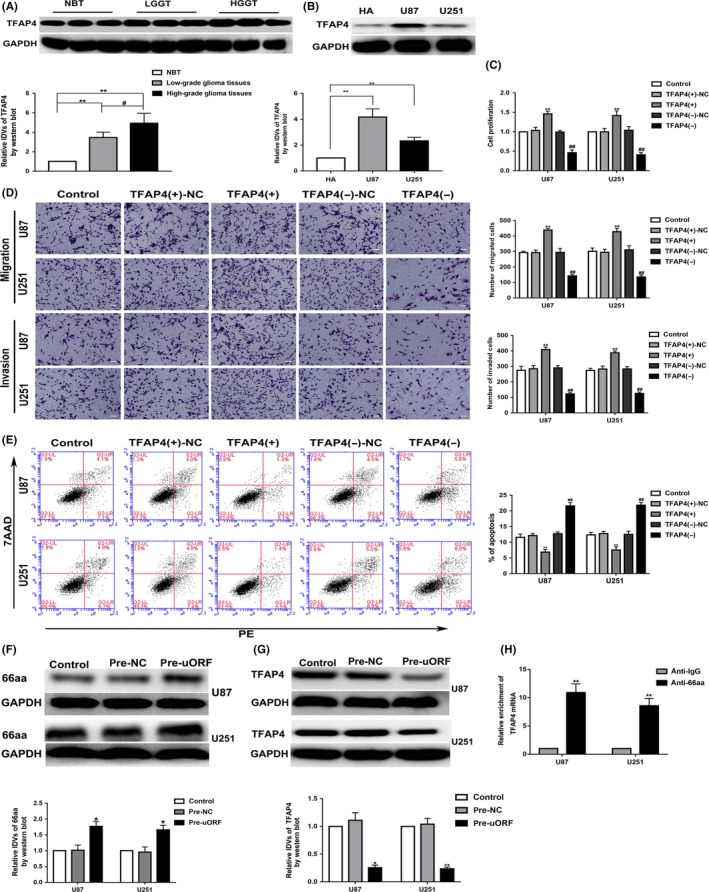
Transcription factor AP‐4 (TFAP4) expression and its effects on glioma. TFAP4‐66aa‐upstream ORF (uORF) inhibits the expression of TFAP4. A, TFAP4 protein level in normal brain tissue (NBT) and different grades glioma tissues. The integrated density values (IDVs) of the blot bands were statistically analyzed. Data are presented as the mean ± SD (n = 12). **P < .01, # P < .05. B, TFAP4 protein level in human astrocytes (HA), and glioma cell lines (U87 and U251). Data are presented as the mean ± SD (n = 3). **P < .01. C‐E, Effects of TFAP4 overexpression (TFAP4(+)) and knockdown (TFAP4(−)) on proliferation, migration, invasion, and apoptosis. Data are presented as the mean ± SD (n = 3). **P < .01 vs TFAP4(+)‐NC, ## P < 0.01 vs TFAP4(−)‐NC. F, Expression of TFAP4‐66aa was detected by western blot after TFAP4‐66aa‐uORF overexpression. *P < .05 vs pre‐NC (negative control) group. G, Expression of TFAP4 was detected by western blot after TFAP4‐66aa‐uORF overexpression. *P < .05 vs pre‐NC group; **P < .01 vs pre‐NC group. H, RIP confirmed that 66aa‐uORF bound to TFAP4 mRNA. Relative enrichment of TFAP4 was measured using qRT‐PCR. **P < .01 vs anti‐normal IgG group. Data are presented as the mean ± SD (n = 3). HGGT, high‐grade glioma tissue; LGGT, low‐grade glioma tissue; PE, phycoerythrin
Moreover, TFAP4‐66aa‐uORF was overexpressed in glioma cells, and the expression of TFAP4‐66aa in the pre‐uORF group was significantly increased (Figure 2F). Interestingly, we also found that the expression of TFAP4 was decreased in the pre‐uORF group (Figure 2G). The above results showed that the TFAP4‐66aa‐uORF could inhibit the expression of TFAP4. Consistent with this, the RIP assay showed that the enrichment of TFAP4 mRNA in the anti‐66aa group was significantly higher than that in the negative control anti‐IgG group (Figure 2H).
3.3. LASP1 and LINC00520 upregulated in glioma tissues and cells and acted as cancer‐promoting genes in glioma cells
The mRNA microarray revealed that several mRNAs were downregulated following knockdown of TFAP4 in glioma cells. Notably, LASP1 mRNA was significantly downregulated in glioma cells, which was confirmed by qRT‐PCR (Figure S1F,G). Hence, we hypothesized that LASP1 was likely to be involved in the TFAP4‐mediated regulation of glioma cells. The expression of LASP1 was upregulated in different grades of tissues and glioma cells (Figure 3A,B). To explore the effect of LASP1 on glioma cells, we examined the proliferation, migration, invasion, and apoptosis of the U87 and U251 glioma cells after LASP1 overexpression and knockdown. The results showed that the proliferation, migration, and invasion ability of the LASP1(+) group was significantly increased, whereas the apoptosis rate was reduced. Moreover, the proliferation, migration, and invasion ability of the LASP1(−) group was dramatically reduced, whereas apoptosis was increased (Figure 3C‐E).
Figure 3.
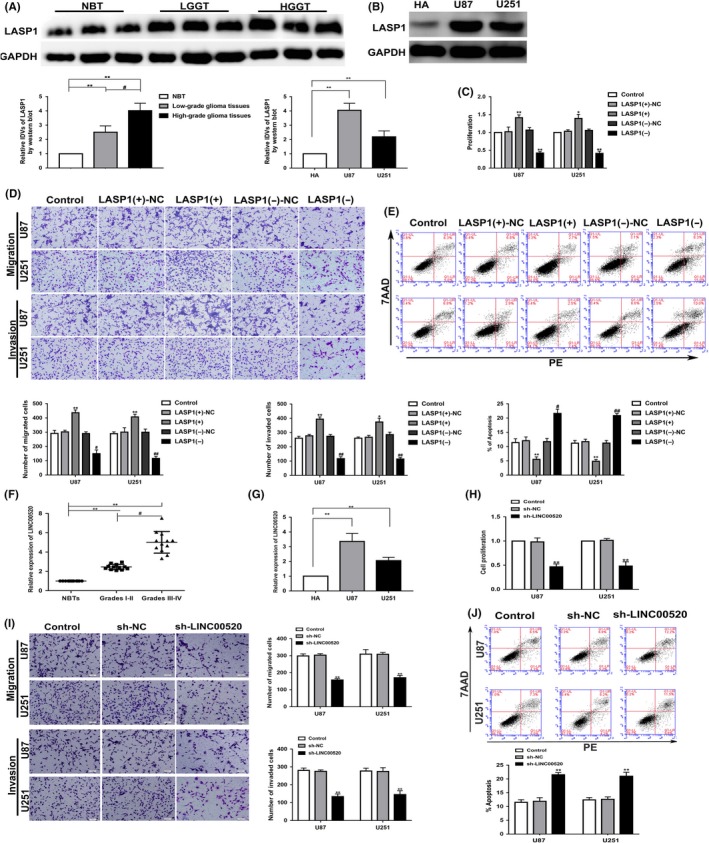
Expression and effects of LIM and SH3 protein 1 (LASP1) and long noncoding RNA (LINC)00520 in glioma. A, LASP1 protein level in normal brain tissue (NBT) and different grades of glioma tissues. Integrated density values (IDVs) of the blot bands were statistically analyzed. Data are presented as the mean ± SD (n = 12). **P < .01, # P < .05. B, LASP1 protein level in human astrocytes (HA), U87, and U251 glioma cells. Data are presented as the mean ± SD (n = 3). *P < .05, **P < .01. C‐E, Effects of LASP1 overexpression (LASP1(+)) and knockdown (LASP1(−)) on proliferation, migration, invasion, and apoptosis. Data are presented as the mean ± SD (n = 3). *P < .05 vs LASP1(+)‐NC, **P < .01 vs LASP1(+)‐NC, #P < .05 vs LASP1(−)‐NC, ##P < .05 vs LASP1(−)‐NC. F, NBTs and glioma tissues of different grades were analyzed for LINC00520 expression by quantitative real‐time (qRT)‐PCR. **P < .01, #P < .05. Data are presented as the mean ± SD (n = 12). G, LINC00520 expression was detected by qRT‐PCR in HA and glioma cell lines (U87 and U251). Data are presented as the mean ± SD (n = 3). **P < .01. H‐J, Effects of LINC00520 knockdown (sh‐LINC00520) on proliferation, migration, invasion, and apoptosis. **P < .01, vs sh‐NC (negative control). Scale bar = 50 μm. Data are presented as the mean ± SD (n = 3). HGGT, high‐grade glioma tissue; LGGT, low‐grade glioma tissue; PE, phycoerythrin
Using lncRNA microarrays, we found several lncRNAs to be downregulated, and LINC00520 was confirmed to be significantly downregulated in the glioma cells using qRT‐PCR (Figure S1H,I). Therefore, we hypothesized that LINC00520 might also be involved in the TFAP4‐mediated regulation of glioma cells. The expression of LINC00520 was observed to be upregulated in tissues and glioma cells (Figure 3F,G). Moreover, the proliferation, migration, and invasion ability of the glioma cells was decreased following silencing of LINC00520 (sh‐LINC00520 group), whereas the apoptosis rate was increased (Figure 3H‐J).
3.4. MicroRNA‐520f‐3p might be involved in LINC00520 knockdown‐mediated effects on malignant behavior of glioma cells
The miRNA microarray showed that miR‐520f‐3p was significantly upregulated in glioma cells treated with sh‐LINC00520 (Figure S1J,K). The expression of miR‐520f‐3p was further detected by qRT‐PCR, which confirmed that the expression of miR‐520f‐3p in glioma tissues and glioma cells was downregulated (Figure 4A,B). To investigate the function of miR‐520f‐3p in glioma cells, the biological behaviors of the glioma cells were examined after inhibiting or promoting the expression of miR‐520f‐3p. The proliferation, migration, and invasion of the Agomir‐520f‐3p group was decreased, while the apoptosis rate was increased. In contrast, the proliferation, migration, and invasion of the Antagomir‐520f‐3p group were increased, while the apoptosis rate was decreased (Figure 4C‐E).
Figure 4.
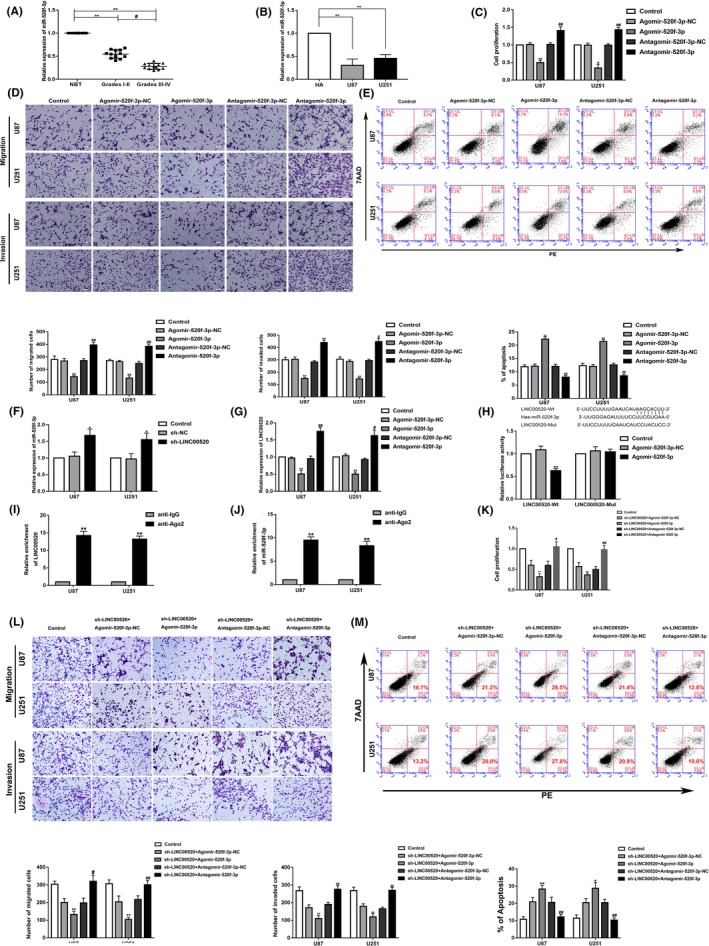
MicroRNA (miR)‐520f‐3p exerted tumor‐suppressive functions in glioma. miR‐520f‐3p mediated the tumor‐suppressive effects of long noncoding RNA (LINC)00520 knockdown on glioma cells. A, Normal brain tissue (NBT) and glioma tissues of different grades were analyzed for miR‐520f‐3p expression by quantitative real‐time (qRT)‐PCR. Data are presented as the mean ± SD (n = 12). **P < .01, #P < .05. B, miR‐520f‐3p expression was detected by qRT‐PCR in human astrocytes (HA) and U87 and U251 glioma cells. Data are presented as the mean ± SD (n = 3). **P < .01. C‐E, Effects of Agomir‐520f‐3p and Antagomir‐520f‐3p on proliferation, migration, invasion, and apoptosis. **P < .01 vs Agomir‐520f‐3p‐NC, #P < .05 vs Antagomir‐520f‐3p‐NC, ##P < .01 vs Antagomir‐520f‐3p‐NC. Scale bar = 50 μm. Data are presented as the mean ± SD (n = 3). F, Expression of miR‐520f‐3p was detected by qRT‐PCR after LINC00520 knockdown. *P < .05 vs sh‐NC (negative control) group. G, Expression of LINC00520 was detected by qRT‐PCR after miR‐520f‐3p overexpression or knockdown. Data are presented as the mean ± SD (n = 3). **P < .01 vs Agomir‐520f‐3p group, #P < .05 vs Antagomir‐520f‐3p group, ##P < .01 vs Antagomir‐520f‐3p group. H, Predicted miR‐520f‐3p binding sites in the LINC00520 sequence (LINC00520‐Wt) and the designed mutant sequence of miR‐520f‐3p binding site (LINC00520‐Mut) are indicated. Relative luciferase activity was carried out after cells were transfected with LINC00520‐Wt or LINC00520‐Mut. Data are presented as the mean ± SD (n = 5). **P < .01 vs Antagomir‐520f‐3p‐NC group, **P < .01 vs Antagomir‐520f‐3p‐NC group. I, J, RNA immunoprecipitation confirmed that LINC00520 and miR‐520f‐3p were in the RNA‐induced silencing complex. K‐M, Effects of LINC00520 and miR‐520F‐3p on proliferation, migration, invasion, and apoptosis. *P < .05 vs sh‐LINC00520+Agomir‐520f‐3p‐NC, **P < .01 vs sh‐LINC00520 + Agomir‐520f‐3p‐NC, #P < 0.05 vs sh‐LINC00520+Antagomir‐520f‐3p‐NC, ##P < 0.01 vs sh‐LINC00520+Antagomir‐520f‐3p‐NC. Scale bar = 50 μm. Data are presented as the mean ± SD (n = 3)
Next, the expression of miR‐520f‐3p was determined following LINC00520 knockdown, and its expression was found to be increased in the sh‐LINC00520 group (Figure 4F). However, the expression of LINC00520 in the Agomir‐520f‐3p group was significantly decreased, whereas that in the Antagomir‐520f‐3p group was significantly increased (Figure 4G).
Using the bioinformatics database DIANA, the potential binding site between LINC00520 and miR‐520f‐3p was predicted. Dual luciferase reporter system assay showed that the relative luciferase activity of LINC00520‐Wt in the Agomir‐520f‐3p group was significantly lower than in the Agomir‐520f‐3p‐NC group, whereas the relative luciferase activity of LINC00520‐Mut did not significantly change in the Agomir‐520f‐3p‐NC or Agomir‐520f‐3p groups (Figure 4H).
To further clarify whether LINC00520 and miR‐520f‐3p could coexist in the RISC, we undertook RIP assays. As shown in Figure 4I,J, the expression of LINC00520 and miR‐520f‐3p in the anti‐Ago2 group was significantly increased.
The effects of LINC00520 and miR‐520f‐3p on the biological behaviors of glioma cells showed that, compared with sh‐LINC00520+Agomir‐520f‐3p‐NC group, the proliferation, migration, and invasion ability of sh‐LINC00520+Agomir‐520f‐3p group were decreased, but the apoptosis was increased. Whereas, in the sh‐LINC00520+Antagomir‐520f‐3p group, the result indicated that Antagomir‐520f‐3p could reversed the inhibitory effects of sh‐LINC00520 on the biological behavior of glioma cells (Figure 4K‐M). In summary, these results clarified that Antagomir‐520f‐3p could reverse the inhibitory effects of sh‐LINC00520 on the biological behaviors of glioma cells.
3.5. MicroRNA‐520f‐3p inhibited TFAP4 expression by directly binding its 3′UTR, thereby inhibiting LASP1 expression and the biological behavior of glioma cells
We overexpressed or knocked down miR‐520f‐3p in glioma cells and evaluated the mRNA and protein expression of TFAP4. The results showed that the expression of TFAP4 in the Agomir‐520f‐3p group was significantly reduced, whereas that in the Antagomir‐520f‐3p group was significantly increased (Figure 5A,B). It was predicted that the TFAP4 3′UTR harbored a direct binding site of miR‐520f‐3p based on the bioinformatics database TargetScan. Dual luciferase reporter system assays indicated significantly reduced luciferase activity in the TFAP4‐Wt+Agomir‐520f‐3p group (Figure 5C). These data suggest that miR‐520f‐3p could inhibit the transcription of TFAP4 by directly binding its 3′UTR.
Figure 5.
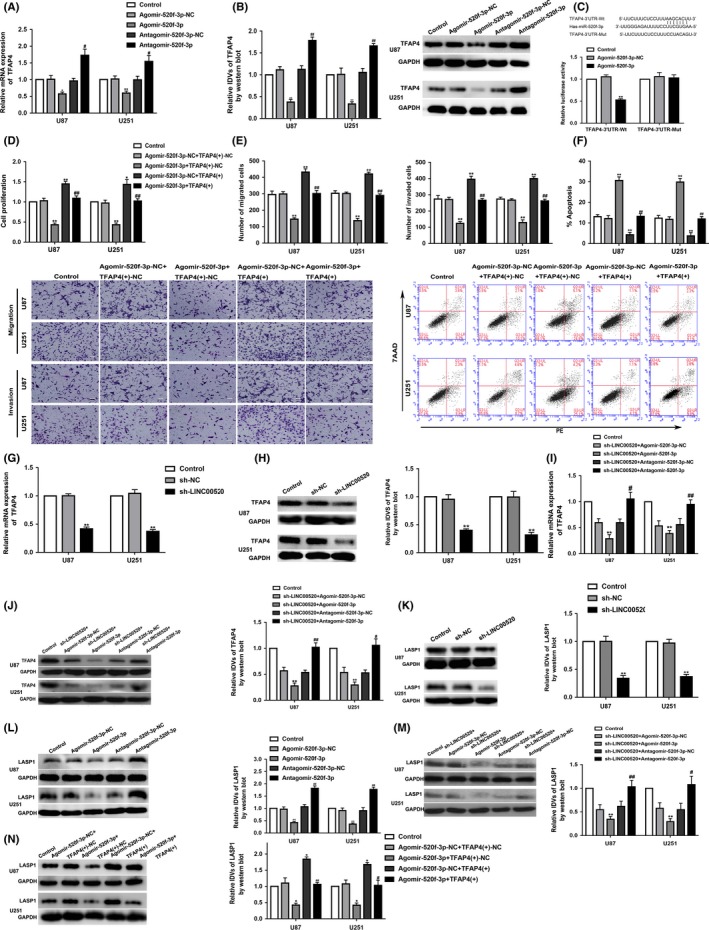
Long noncoding RNA (LINC)00520 and microRNA (miR)‐520f‐3p regulated the expression of transcription factor AP‐4 (TFAP4). LINC00520 regulated the expression of LIM and SH3 protein 1 (LASP1) by TFAP4. A, B, mRNA and protein level expression of TFAP4 after miR‐520f‐3p overexpression and knockdown. Integrated density values (IDVs) of the blot bands were statistically analyzed. Data are presented as the mean ± SD (n = 3). *P < .05 vs Agomir‐520f‐3p‐NC (negative control) group, **P < .01 vs Agomir‐520f‐3p‐NC group, #P < .05 vs Antagomir‐520f‐3p‐NC group, ##P < .01 vs Antagomir‐520f‐3p‐NC group. C, Predicted miR‐520f‐3p binding sites in the TFAP4 sequence (TFAP4‐3′UTR‐Wt) and the designed mutant sequence of miR‐520f‐3p binding site (TFAP4‐3′UTR‐Mut) are indicated. Relative luciferase activity was evaluated after cells were transfected with TFAP4‐3′UTR‐Wt or TFAP4‐3′UTR‐Mut. Data are presented as the mean ± SD (n = 5). **P < .01 vs Antagomir‐520f‐3p‐NC group. D‐F, Effects of miR‐520f‐3p and TFAP4 on proliferation, migration, invasion, and apoptosis. *P < .01 vs Agomir‐520f‐3p‐NC+TFAP4(+)‐NC, **P < .01 vs Agomir‐520f‐3p‐NC+TFAP4(+)‐NC, ##P < .01 vs Agomir‐520f‐3p+TFAP4(+)‐NC. Scale bar = 50 μm. Data are presented as the mean ± SD (n = 3). G, H, mRNA and protein level expression of TFAP4 after LINC00520 knockdown. Data are presented as the mean ± SD (n = 3). **P < .01 vs sh‐NC group. I, J, Expression of TFAP4 was detected by LINC00520 and miR‐520f‐3p on quantitative real‐time PCR and western blot analysis. Data are presented as the mean ± SD (n = 3). **P < .01 vs sh‐LINC00520+Agomir‐520f‐3p‐NC group, #P < .05 vs sh‐LINC00520+Antagomir‐520f‐3p‐NC group, ##P < .01 vs sh‐LINC00520+Antagomir‐520f‐3p‐NC group. K, Expression of LASP1 was detected by western blot after LINC00520 knockdown. Data are presented as the mean ± SD (n = 3). **P < .01 vs sh‐NC group. L, Expression of LASP1 was detected by western blot after miR‐520f‐3p overexpression and knockdown. Data are presented as the mean ± SD (n = 3). **P < .01 vs Agomir‐520f‐3p‐NC group, ##P < .01 vs Antagomir‐520f‐3p‐NC group. M, Expression of LASP1 was detected by LINC00520 and miR‐520f‐3p on western blot. Data are presented as the mean ± SD (n = 3). **P < .01 vs sh‐LINC00520+Agomir‐520f‐3p‐NC group, #P < .05 vs sh‐LINC00520+Antagomir‐520f‐3p‐NC group, ##P < .01 vs sh‐LINC00520+Antagomir‐520f‐3p‐NC group. N, Expression of LASP1 was detected by LINC00520 and miR‐520f‐3p on western blot. Data are presented as the mean ± SD (n = 3). *P < .05 vs Agomir‐520f‐3p‐NC+TFAP4(+)‐NC, #P <.05 vs Agomir‐520f‐3p +TFAP4(+)‐NC, ##P < .01 vs Agomir‐520f‐3p+TFAP4(+)‐NC
To investigate whether TFAP4 could reverse the tumor‐suppressive effects of miR‐520f‐3p on glioma cells, these cells were cotransfected with TFAP4 and miR‐520f‐3p and their biological behaviors were evaluated. As shown in Figure 5D‐F, the proliferation, migration, and invasion of the Agomir‐520f‐3p+TFAP4(+)‐NC group were decreased, whereas the apoptosis rate was increased. Moreover, the proliferation, migration, and invasion of glioma cells in Agomir‐520f‐3p‐NC+TFAP4(+) group were enhanced, but the apoptosis was reduced. However, rescue effects on proliferation, migration, invasion, and apoptosis were observed in the Agomir‐520f‐3p+TFAP4(+) group. Together, these data clarified that TFAP4(+) could reverse the inhibitory effects of Agomir‐520f‐3p on the biological behaviors of glioma cells.
Quantitative real‐time PCR and western blot results showed that TFAP4 mRNA and protein levels were significantly reduced when LINC00520 was knocked down (Figure 5G,H). We next tested the TFAP4 mRNA and protein levels in cotransfected sh‐LINC00520 and Agomir‐520f‐3p or Antagomir‐520f‐3p cells; the results showed that the expression of TFAP4 in the cotransfected sh‐LINC00520 and Agomir‐520f‐3p group was significantly reduced. However, Antagomir‐520f‐3p could reverse the inhibition of TFAP4 expression levels caused by LINC00520 knockdown alone (Figure 5I,J). Taken together, these results indicated that LINC00520 regulated the mRNA and protein expression levels of TFAP4 through miR‐520f‐3p.
Interestingly, we also found that LASP1 protein level was reduced in the LINC00520 knockdown group (Figure 5K). Furthermore, LASP1 protein expression was decreased by overexpression of miR‐520f‐3p, whereas miR‐520f‐3p knockdown increased LASP1 protein expression (Figure 5L). The expression of LASP1 protein level was significantly inhibited by cotransfection of sh‐LINC00520 and Agomir‐520f‐3p, and Antagomir‐520f‐3p could notably reverse the decrease in LASP1 protein levels caused by LINC00520 knockdown alone (Figure 5M). The overexpression of TFAP4 reversed the decrease in LASP1 protein induced by overexpression of miR‐520f‐3p alone (Figure 5N). The above data indicated that LINC00520 might regulate the expression of LASP1 through TFAP4 to regulate the malignant biological behaviors of glioma cells.
3.6. Transcription factor AP‐4 transcriptionally activated LINC00520 and LASP1 expression by directly binding their promoter regions
The results showed that the mRNA and protein levels of LASP1 were evidently increased in the TFAP4(+) group, but decreased in the TFAP4(−) group (Figure 6A,B). Potential binding sites in the promoter region of LASP1 were found using the biological information database software JASPAR. The ChIP assay was used to validate the prediction. As shown in Figure 6C, 3 putative TFAP4 binding sites in the LASP1 promoter region were identified. The data revealed that TFAP4 directly bound to binding site 1 of the LASP1 promoter region. Likely, the expression level of LINC00520 was significantly increased in the TFAP4(+) group and was significantly decreased in the TFAP4(−) group (Figure 6D). Four binding sites were predicated for TFAP4 in the promoter region of LINC00520 from the bioinformatics database (JASPAR). As shown in Figure 6E, the data revealed that TFAP4 directly bound to binding site 4 of the LINC00520 promoter region.
Figure 6.
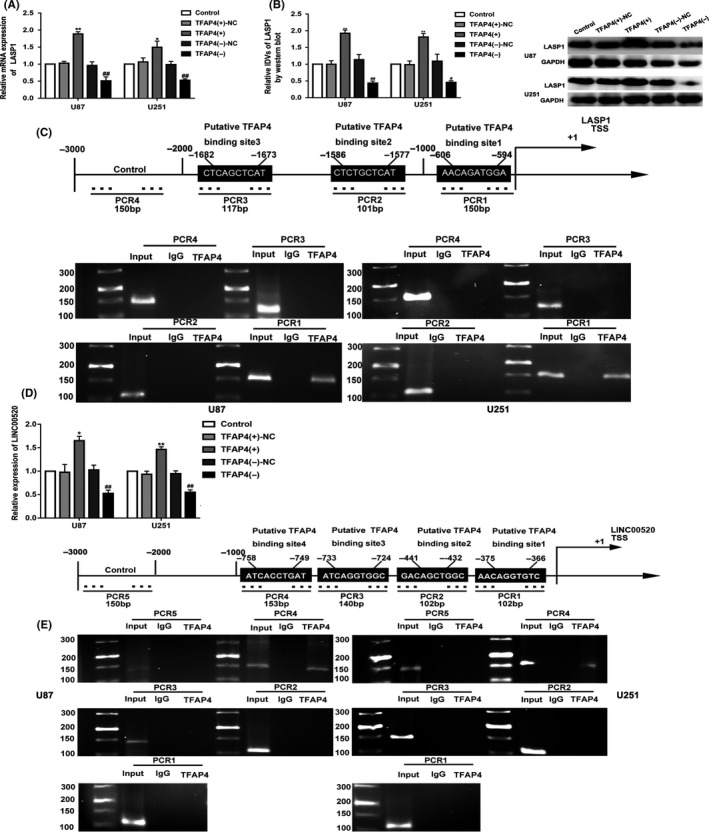
Transcription factor AP‐4 (TFAP4) bound to the promoters of LIM and SH3 protein 1 (LASP1) and long noncoding RNA (LINC)00520 in U87 and U251 cells. A, B, mRNA and protein level expression of LASP1 after TFAP4 overexpression and knockdown. Integrated density values (IDVs) of the blot bands were statistically analyzed. Data are presented as the mean ± SD (n = 3). *P < .05 vs TFAP4(+)‐NC group, **P < .01 vs TFAP4(+)‐NC group, #P < .05 vs TFAP4(−)‐NC group, ##P < .01 vs TFAP4(−)‐NC group. C, TFAP4 bound to the promoter of LASP1 was detected by ChIP assay. D, Expression of LINC00520 was detected by quantitative real‐time PCR after TFAP4 overexpression and knockdown. Data are presented as the mean ± SD (n = 3). *P < .05 vs TFAP4(+)‐NC group, **P < .01 vs TFAP4(+)‐NC group, ##P < .01 vs TFAP4(−)‐NC group. E, TFAP4 bound to the promoter of LINC00520 was detected by ChIP assay
3.7. Combination of LINC00520 knockdown, TFAP4 knockdown, and TFAP4‐66aa‐uORF overexpression inhibited tumor growth and prolonged survival
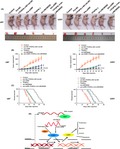
The function of LINC00520, TFAP4, and TFAP4‐66aa‐uORF was further determined using a s.c. tumor model and an orthotopic transplantation model. As shown in Figure 7A,B, TFAP4‐66aa‐uORF overexpression, TFAP4 knockdown, LINC00520 inhibition, and the combination of the 3 resulted in smaller tumors compared with the control group. In addition, minimal tumors were observed in the combination of TFAP4‐66aa‐uORF overexpression, TFAP4 knockdown, and LINC00520 inhibition group. As shown in Figure 7C, survival analysis indicated that mice in the pre‐uORF, TFAP4(−), sh‐LINC00520, and pre‐uORF+TFAP4(−)+sh‐LINC00520 groups showed longer survival time than the control mice. The mice in the pre‐uORF+TFAP4(−)+sh‐LINC00520 group displayed the longest survival time.
Figure 7.
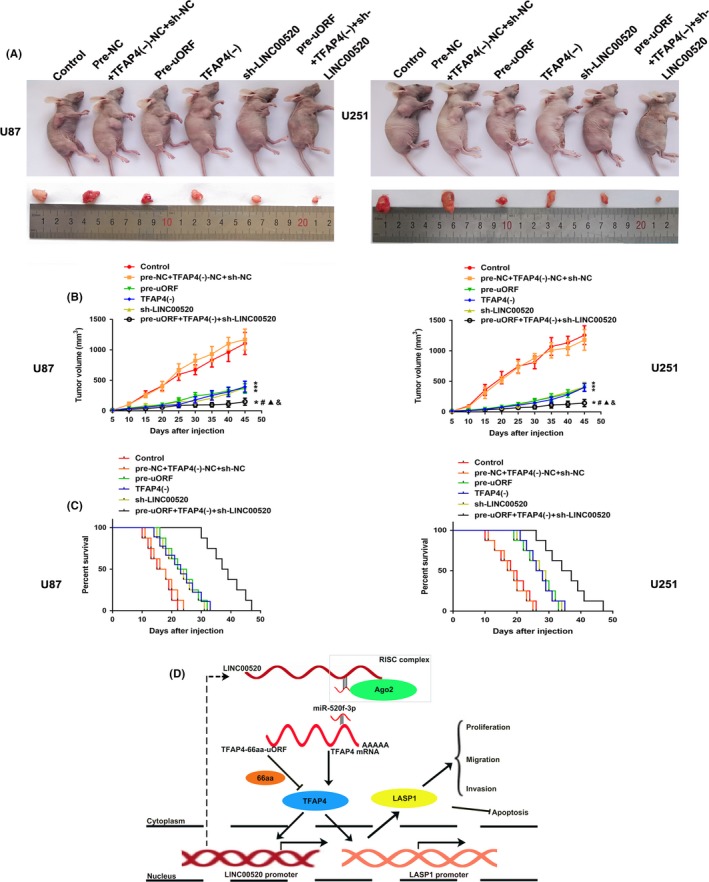
Tumor xenograft studies. A, Nude mice carrying tumors from respective groups are shown. Sample tumors from respective groups are shown. B, Tumor growth curves. C, Survival curves from representative nude mice injected into the right striatum (n = 8). D, Schematic illustration of interactions between transcription factor AP‐4 (TFAP4)‐66aa‐upstream ORF (uORF), TFAP4, LIM and SH3 protein 1 (LASP1), long noncoding RNA (LINC)00520, and microRNA (miR)‐520f‐3p in glioma. NC, negative control; RISC, RNA‐induced silencing complex
4. DISCUSSION
Upstream ORF is ubiquitous as a regulatory element in eukaryotic mRNA. Its primary function is to regulate the translation of the mRNA CDS region.26, 27 A recent study reported the dysregulation of uORF in tumors and its important regulatory role in tumorigenesis.28 In this study, TFAP4‐66aa‐uORF was downregulated in glioma tissues and in glioma cells. Overexpression of TFAP4‐66aa‐uORF inhibited the malignant biological behavior of glioma cells. The results clarify the role of TFAP4‐66aa‐uORF as a tumor suppressor gene in gliomas. A similar study identified NR2C2‐47aa‐uORF as a tumor suppressor gene in gliomas.29 Additionally, TFAP4 was highly expressed in glioma tissues and in U87 and U251 glioma cells, and knockdown of TFAP4 inhibited the malignant biological behavior of glioma cells. These results support the function of TFAP4 as an oncogene in gliomas. High expression of TFAP4 promotes the development of liver cancer and colorectal cancer.30, 31 It is also upregulated in estrogen receptor‐positive ovarian cancer cells.32
Upstream ORF could inhibit the translation initiation rate of downstream CDS regions by retaining or dissociating ribosomes from mRNA. A short ribosome‐encoded peptide interacts with the ribosome to induce the arrest of the ribosome located on the initiation codons of uORFs to the terminator, which affects the translation of downstream CDS.33 Two studies reported that the presence of uORFs of 25 codons in the 5′UTR region of CPA1 mRNA, which encodes a fungal AAP that regulates ribosome function. Ribosomal retention of AAP at the stop codon, which is induced by increasing arginine, inhibits the translation of CPA1.34, 35 In this study, a vector of 66aa was generated upstream of the start codon of the 5′UTR of TFAP4 mRNA using the ORF Finder bioinformatics database. When TFAP4‐66aa‐uORF was overexpressed, TFAP4‐66aa expression was increased, while the protein level of TFAP4 was decreased. The RIP assay findings confirmed the interaction between TFAP4‐66aa and TFAP4 mRNA. The collective results suggest that TFAP4‐66aa‐uORF might inhibit the translation of TFAP4 mRNA by its encoded TFAP4‐66aa. A similar study found that the uORF could be used as a translational inhibitor of CEBPA mRNA.36 Upstream ORF can reduce the expression of NR2C2 in glioma by inhibiting the translation of NR2C2 mRNA.29
In this study, LASP1 was highly expressed in glioma tissues and in glioma cells. Knockdown of LASP1 significantly inhibited the malignant biologicals behavior of glioma cells. These findings confirmed that LASP1 might act as a cancer‐promoting gene in gliomas. LASP1 is highly expressed in different kinds of tumors as an adhesive protein, and in U87 and LN229 glioma cells.37 The LASP1 gene promotes the proliferation of oral squamous cell carcinoma cells.38 It is also highly expressed in breast cancer tissues and cells, and downregulation of LASP1 inhibits proliferation, migration, and invasion of breast cancer cells.39 LASP1 functions as an oncogene in liver cancer and promotes the occurrence and development of hepatoma cells.40
Increasing evidence indicates that lncRNAs have important regulatory roles in tumorigenesis.41, 42 The present study confirmed the high expression of LINC00520 in glioma tissues and in glioma cells, and LINC00520 promoted the malignant biological behaviors of glioma cells. A similar study described the expression of LINC00520 in nasopharyngeal carcinoma, and the relationship between LINC00520 overexpression and the proliferation of nasopharyngeal carcinoma cells.43 LINC00520 also acts as a tumor promoting factor in renal cell carcinoma, and promotes the development of renal cell carcinoma.44 Therefore, LINC00520 could be an oncogene in glioma, nasopharyngeal carcinoma, and renal cell carcinoma.
MicroRNAs are involved in the important regulation of a variety of tumors, such as promoting the mRNA degradation of target genes and inhibiting translational regulation of genes.45 Presently, miR‐520f‐3p was expressed in low levels in glioma tissues and cells, and inhibited the malignant biological behavior of glioma cells. Similarly, miR‐520f‐3p is regarded as a potential tumor suppressor in breast cancer.25 MicroRNAs usually bind to the 3′UTR region of target gene mRNA to inhibit its translation. In this study, a dual luciferase reporter system gene assay indicated that miR‐520f‐3p bound to the 3′UTR region of TFAP4 mRNA. The mRNA and protein expression levels of TFAP4 were decreased when miR‐520f‐3p was overexpressed. A similar study reported the targeting of miR‐326 to the 3′UTR region of MAPK1 mRNA, and determined that the overexpression of miR‐326 could reduce MAPK1 mRNA and protein, inhibiting the occurrence and development of cervical cancer.46 MicroRNA‐145 targets the 3′UTR region of REV3L mRNA, and the mRNA and protein expression levels of REV3L are significantly downregulated when miR‐145 is overexpressed in esophageal squamous cell carcinoma.47
Long noncoding RNAs act as competitive endogenous RNAs of miRNA and inhibit the negative regulation of miRNA on target genes. Presently, LINC00520 and miR‐520f‐3p displayed opposite effects on the biological behavior of glioma cells. AAGCACUU was determined to be the binding sequence of LINC00520 and miR‐520f‐3p based on the DIANA bioinformatics database, and results of a dual luciferase assay validated the binding of LINC00520 and miR‐520f‐3p.
In addition, knockdown of miR‐520f‐3p reversed the inhibitory effect of LINC00520 knockdown on the malignant biological behaviors of glioma cells. The collective findings indicate that LINC00520 might act as a competing endogenous RNA with miR‐520f‐3p in the binding to the 3′UTR of TFAP4, to promote the malignant biological behaviors of glioma cells. A similar study documented that SOX2OT can attenuate the binding of miR‐194‐5p to SOX3 3′UTR by competitively binding to miR‐194‐5p, thus accelerating the development of glioma.48 Another study reported that UCA1 can attenuate the inhibitory effect of miR‐582 on CREB1 by competitively binding to miR‐582 to promote the occurrence and development of osteosarcoma.49 HMMR‐AS1 is able to attenuate its inhibitory effect on SIRT6 by competitively binding to miR‐138, accelerating the development and progression of lung adenocarcinoma.50
We also observed the upregulation of the mRNA and protein expression levels of LASP1 by TFAP4 overexpression. The ChIP assay confirmed the prediction of the JASPAR bioinformatics database that TFAP4 bound to the promoter region of LASP1. These results indicated that TFAP4 transcriptionally activated the expression of LASP1 by binding to its promoter region. Similarly, LINC00520 expression was increased when TFAP4 was overexpressed. It was also confirmed that TFAP4 promoted the transcription of LINC00520 by binding to its promoter region according to the prediction of the JASPAR bioinformatics database and ChIP assay. A positive feedback loop of TFAP4/LINC00520/miR‐520f‐3p was formed to promote the malignant biological behavior of glioma. A similar study found that SOX5 directly binds to the promoter region of SNHG12 to form a positive feedback loop of SOX5/miR‐195/SNHG12, which regulates the malignant biological behavior of glioma cells.51 Others reported the direct binding of ZNF143 to the FAM224A promoter region to form a positive feedback loop of ZNF143/FAM224A/miR‐590‐3p, which regulates the malignant biological behaviors of glioma cells.52
Finally, the nude mouse xenograft experiment showed that TFAP4‐66aa‐uORF overexpression, TFAP4 knockdown, and LINC00520 knockdown alone or together could significantly inhibit the xenograft volume and prolong the survival time of nude mice, with the combination of these 3 phenomena minimizing tumor development and resulting in the longest survival time. The findings suggest the potential therapeutic value of the combination of TFAP4‐66aa‐uORF overexpression, LINC00520 knockdown, and TFAP4 knockdown.
In summary, low expression of TFAP4‐66aa‐uORF facilitated TFAP4 expression by attenuating the inhibitory effect of TFAP4‐66aa on TFAP4 translation. High expression of LINC00520 elevated the expression of TFAP4 by competing with miR‐520f‐3p bound to the 3′UTR region of TFAP4 mRNA. Transcription factor AP‐4 activated the transcription of LINC00520 and LASP1 by directly binding to its promoter region, forming a TFAP4/LINC00520/miR‐520f‐3p feedback loop to regulate the malignant biological behaviors of glioma cells. Our findings implicate TFAP4‐66aa‐uORF in a novel mechanism to regulate the malignant biological behavior of glioma cells, and could inform the development of new strategies and approaches for the treatment of gliomas.
DISCLOSURE
All authors read the manuscript and declare that there is no competition conflict of interest.
Supporting information
ACKNOWLEDGMENTS
This work is supported by grants from the Natural Science Foundation of China (81872073, 81672511, 81872503, 81573010), Liaoning Science and Technology Plan Project (No. 2017225020), Project of Key Laboratory of Neuro‐oncology in Liaoning Province (112‐2400017005), special developmental project guided by the central government of Liaoning Province (No. 2017011553‐301), and outstanding scientific fund of Shengjing Hospital (No. 201802). We thank Editage for English language polish.
Wang Y, Yang C, Liu X, et al. Transcription factor AP‐4 (TFAP4)‐upstream ORF coding 66 aa inhibits the malignant behaviors of glioma cells by suppressing the TFAP4/long noncoding RNA 00520/microRNA‐520f‐3p feedback loop. Cancer Sci. 2020;111:891–906. 10.1111/cas.14308
REFERENCES
- 1. Liu Z, Lu C, Hu H, et al. LINC00909 promotes tumor progression in human glioma through regulation of miR‐194/MUC1‐C axis. Biomed Pharmacother. 2019;116:108965. [DOI] [PubMed] [Google Scholar]
- 2. Li X, Xue Y, Liu X, et al. ZRANB2/SNHG20/FOXK1 Axis regulates vasculogenic mimicry formation in glioma. J Exp Clin Cancer Res. 2019;38(1):68. [DOI] [PMC free article] [PubMed] [Google Scholar]
- 3. Yu H, Xue Y, Wang P, et al. Knockdown of long non‐coding RNA XIST increases blood‐tumor barrier permeability and inhibits glioma angiogenesis by targeting miR‐137. Oncogenesis. 2017;6(3):e303. [DOI] [PMC free article] [PubMed] [Google Scholar]
- 4. Guo J, Cai H, Liu X, et al. Long non‐coding RNA LINC00339 stimulates glioma vasculogenic mimicry formation by regulating the miR‐539‐5p/TWIST1/MMPs Axis. Mol Ther Nucleic Acids. 2018;10:170‐186. [DOI] [PMC free article] [PubMed] [Google Scholar]
- 5. Iacono M, Mignone F, Pesole G. uAUG and uORFs in human and rodent 5'untranslated mRNAs. Gene. 2005;349:97‐105. [DOI] [PubMed] [Google Scholar]
- 6. Donze O, Spahr PF. Role of the open reading frames of Rous sarcoma virus leader RNA in translation and genome packaging. EMBO J. 1992;11(10):3747‐3757. [DOI] [PMC free article] [PubMed] [Google Scholar]
- 7. Rose TM, Bruce AG, Barcy S, et al. Quantitative RNAseq analysis of Ugandan KS tumors reveals KSHV gene expression dominated by transcription from the LTd downstream latency promoter. PLoS Pathog. 2018;14(12):e1007441. [DOI] [PMC free article] [PubMed] [Google Scholar]
- 8. Salomons GS, Buitenhuis CK, Martinez Munoz C, et al. Mutational analysis of Bax and Bcl‐2 in childhood acute lymphoblastic leukaemia. Int J Cancer. 1998;79(3):273‐277. [DOI] [PubMed] [Google Scholar]
- 9. Hu YF, Luscher B, Admon A, Mermod N, Tjian R. Transcription factor AP‐4 contains multiple dimerization domains that regulate dimer specificity. Genes Dev. 1990;4(10):1741‐1752. [DOI] [PubMed] [Google Scholar]
- 10. Boboila S, Lopez G, Yu J, et al. Transcription factor activating protein 4 is synthetically lethal and a master regulator of MYCN‐amplified neuroblastoma. Oncogene. 2018;37(40):5451‐5465. [DOI] [PMC free article] [PubMed] [Google Scholar]
- 11. Howard CM, Bearss N, Subramaniyan B, et al. The CXCR4‐LASP1‐eIF4F axis promotes translation of oncogenic proteins in triple‐negative breast cancer cells. Front Oncol. 2019;9:284. [DOI] [PMC free article] [PubMed] [Google Scholar]
- 12. Zhao H, Liu B, Li J. LIM and SH3 protein 1 knockdown suppresses proliferation and metastasis of colorectal carcinoma cells via inhibition of the mitogen‐activated protein kinase signaling pathway. Oncol Lett. 2018;15(5):6839‐6844. [DOI] [PMC free article] [PubMed] [Google Scholar]
- 13. Tam C, Wong JH, Tsui SKW, Zuo T, Chan TF, Ng TB. LncRNAs with miRNAs in regulation of gastric, liver, and colorectal cancers: updates in recent years. Appl Microbiol Biotechnol. 2019;103(12):4649‐4677. [DOI] [PubMed] [Google Scholar]
- 14. Tsai MC, Spitale RC, Chang HY. Long intergenic noncoding RNAs: new links in cancer progression. Can Res. 2011;71(1):3‐7. [DOI] [PMC free article] [PubMed] [Google Scholar]
- 15. Wang KC, Chang HY. Molecular mechanisms of long noncoding RNAs. Mol Cell. 2011;43(6):904‐914. [DOI] [PMC free article] [PubMed] [Google Scholar]
- 16. Wang D, Zheng J, Liu X, et al. Knockdown of USF1 inhibits the vasculogenic mimicry of glioma cells via stimulating SNHG16/miR‐212‐3p and linc00667/miR‐429 axis. Mol Ther Nucleic Acids. 2019;14:465‐482. [DOI] [PMC free article] [PubMed] [Google Scholar] [Retracted]
- 17. Li G, Cai Y, Wang C, Huang M, Chen J. LncRNA GAS5 regulates the proliferation, migration, invasion and apoptosis of brain glioma cells through targeting GSTM3 expression. The effect of LncRNA GAS5 on glioma cells. J Neurooncol. 2019;143(3):525‐536. [DOI] [PubMed] [Google Scholar]
- 18. Tian X, Ji Y, Liang Y, Zhang J, Guan L, Wang C. LINC00520 targeting miR‐27b‐3p regulates OSMR expression level to promote acute kidney injury development through the PI3K/AKT signaling pathway. J Cell Physiol. 2019;234(8):14221‐14233. [DOI] [PubMed] [Google Scholar]
- 19. Mei XL, Zhong S. Long noncoding RNA LINC00520 prevents the progression of cutaneous squamous cell carcinoma through the inactivation of the PI3K/Akt signaling pathway by downregulating EGFR. Chin Med J. 2019;132(4):454‐465. [DOI] [PMC free article] [PubMed] [Google Scholar]
- 20. Chen M, Zhang Y, Li A, Li Z, Liu W, Chen Z. Bipartite heterogeneous network method based on co‐neighbor for MiRNA‐disease association prediction. Front Genet. 2019;10:385. [DOI] [PMC free article] [PubMed] [Google Scholar]
- 21. Zeng X, Wang W, Deng G, Bing J, Zou Q. Prediction of potential disease‐associated microRNAs by using neural networks. Mol Ther Nucleic Acids. 2019;16:566‐575. [DOI] [PMC free article] [PubMed] [Google Scholar]
- 22. Zheng J, Liu X, Xue Y, et al. TTBK2 circular RNA promotes glioma malignancy by regulating miR‐217/HNF1beta/Derlin‐1 pathway. J Hematol Oncol. 2017;10(1):52. [DOI] [PMC free article] [PubMed] [Google Scholar]
- 23. Ling C, Wang X, Zhu J, et al. MicroRNA‐4286 promotes cell proliferation, migration, and invasion via PTEN regulation of the PI3K/Akt pathway in non‐small cell lung cancer. Cancer Med. 2019;8(7):3520‐3531. [DOI] [PMC free article] [PubMed] [Google Scholar]
- 24. Zhang Q, Li Y, Zhao M, et al. MiR‐494 acts as a tumor promoter by targeting CASP2 in non‐small cell lung cancer. Sci Rep. 2019;9(1):3008. [DOI] [PMC free article] [PubMed] [Google Scholar]
- 25. Meshkat M, Mesrian Tanha H, Ghaedi K, Meshkat M. Association of a potential functional mir‐520f rs75598818 G>A polymorphism with breast cancer. J Genet. 2018;97(5):1307‐1313. [PubMed] [Google Scholar]
- 26. Ye Y, Liang Y, Yu Q, et al. Analysis of human upstream open reading frames and impact on gene expression. Hum Genet. 2015;134(6):605‐612. [DOI] [PubMed] [Google Scholar]
- 27. Ruiz‐Orera J, Alba MM. Translation of small open reading frames: roles in regulation and evolutionary innovation. Trends Genet. 2019;35(3):186‐198. [DOI] [PubMed] [Google Scholar]
- 28. Hardy S, Kostantin E, Wang SJ, et al. Magnesium‐sensitive upstream ORF controls PRL phosphatase expression to mediate energy metabolism. Proc Natl Acad Sci USA. 2019;116(8):2925‐2934. [DOI] [PMC free article] [PubMed] [Google Scholar]
- 29. Fan Z, Zheng J, Xue Y, et al. NR2C2‐uORF targeting UCA1‐miR‐627‐5p‐NR2C2 feedback loop to regulate the malignant behaviors of glioma cells. Cell Death Dis. 2018;9(12):1165. [DOI] [PMC free article] [PubMed] [Google Scholar]
- 30. Song J, Xie C, Jiang L, et al. Transcription factor AP‐4 promotes tumorigenic capability and activates the Wnt/beta‐catenin pathway in hepatocellular carcinoma. Theranostics. 2018;8(13):3571‐3583. [DOI] [PMC free article] [PubMed] [Google Scholar]
- 31. Ma W, Liu B, Li J, et al. MicroRNA‐302c represses epithelial‐mesenchymal transition and metastasis by targeting transcription factor AP‐4 in colorectal cancer. Biomed Pharmacother. 2018;105:670‐676. [DOI] [PubMed] [Google Scholar]
- 32. Walker G, MacLeod K, Williams AR, Cameron DA, Smyth JF, Langdon SP. Estrogen‐regulated gene expression predicts response to endocrine therapy in patients with ovarian cancer. Gynecol Oncol. 2007;106(3):461‐468. [DOI] [PubMed] [Google Scholar]
- 33. Zhang H, Si X, Ji X, et al. Genome editing of upstream open reading frames enables translational control in plants. Nat Biotechnol. 2018;36(9):894‐898. [DOI] [PubMed] [Google Scholar]
- 34. Werner M, Feller A, Messenguy F, Pierard A. The leader peptide of yeast gene CPA1 is essential for the translational repression of its expression. Cell. 1987;49(6):805‐813. [DOI] [PubMed] [Google Scholar]
- 35. Wu C, Wei J, Lin PJ, et al. Arginine changes the conformation of the arginine attenuator peptide relative to the ribosome tunnel. J Mol Biol. 2012;416(4):518‐533. [DOI] [PMC free article] [PubMed] [Google Scholar]
- 36. Perrotti D, Cesi V, Trotta R, et al. BCR‐ABL suppresses C/EBPalpha expression through inhibitory action of hnRNP E2. Nat Genet. 2002;30(1):48‐58. [DOI] [PubMed] [Google Scholar]
- 37. Liu Y, Gao Y, Li D, et al. LASP1 promotes glioma cell proliferation and migration and is negatively regulated by miR‐377‐3p. Biomed Pharmacother. 2018;108:845‐851. [DOI] [PubMed] [Google Scholar]
- 38. Song X, Jin Y, Yan M, Zhang Y, Chen B. MicroRNA‐342‐3p functions as a tumor suppressor by targeting LIM and SH3 protein 1 in oral squamous cell carcinoma. Oncol Lett. 2019;17(1):688‐696. [DOI] [PMC free article] [PubMed] [Google Scholar]
- 39. Sui Y, Zhang X, Yang H, Wei W, Wang M. MicroRNA‐133a acts as a tumour suppressor in breast cancer through targeting LASP1. Oncol Rep. 2018;39(2):473‐482. [DOI] [PMC free article] [PubMed] [Google Scholar] [Retracted]
- 40. Hu S, Ran Y, Chen W, Zhang Y, Xu Y. MicroRNA‐326 inhibits cell proliferation and invasion, activating apoptosis in hepatocellular carcinoma by directly targeting LIM and SH3 protein 1. Oncol Rep. 2017;38(3):1569‐1578. [DOI] [PubMed] [Google Scholar]
- 41. D'Angelo D, Mussnich P, Sepe R, et al. RPSAP52 lncRNA is overexpressed in pituitary tumors and promotes cell proliferation by acting as miRNA sponge for HMGA proteins. J Mol Med. 2019;97(7):1019‐1032. [DOI] [PubMed] [Google Scholar]
- 42. Jia X, Shi L, Wang X, et al. KLF5 regulated lncRNA RP1 promotes the growth and metastasis of breast cancer via repressing p27kip1 translation. Cell Death Dis. 2019;10(5):373. [DOI] [PMC free article] [PubMed] [Google Scholar] [Retracted]
- 43. Xie T, Pi G, Yang B, et al. Long non‐coding RNA 520 is a negative prognostic biomarker and exhibits pro‐oncogenic function in nasopharyngeal carcinoma carcinogenesis through regulation of miR‐26b‐3p/USP39 axis. Gene. 2019;707:44‐52. [DOI] [PubMed] [Google Scholar]
- 44. Chen B, Wang C, Zhang J, Zhou Y, Hu W, Guo T. New insights into long noncoding RNAs and pseudogenes in prognosis of renal cell carcinoma. Cancer Cell Int. 2018;18:157. [DOI] [PMC free article] [PubMed] [Google Scholar]
- 45. Ma L, Zhou L, Quan S, Xu H, Yang J, Niu J. Integrated analysis of mRNA‐seq and miRNA‐seq in calyx abscission zone of Korla fragrant pear involved in calyx persistence. BMC Plant Biol. 2019;19(1):192. [DOI] [PMC free article] [PubMed] [Google Scholar]
- 46. Jiang H, Liang M, Jiang Y, et al. The lncRNA TDRG1 promotes cell proliferation, migration and invasion by targeting miR‐326 to regulate MAPK1 expression in cervical cancer. Cancer Cell Int. 2019;19:152. [DOI] [PMC free article] [PubMed] [Google Scholar]
- 47. Chen Q, Hou J, Wu Z, Zhao J, Ma D. miR‐145 Regulates the sensitivity of esophageal squamous cell carcinoma cells to 5‐FU via targeting REV3L. Pathol Res Pract. 2019;215:152427. [DOI] [PubMed] [Google Scholar]
- 48. Su R, Cao S, Ma J, et al. Knockdown of SOX2OT inhibits the malignant biological behaviors of glioblastoma stem cells via up‐regulating the expression of miR‐194‐5p and miR‐122. Mol Cancer. 2017;16(1):171. [DOI] [PMC free article] [PubMed] [Google Scholar]
- 49. Ma H, Su R, Feng H, Guo Y, Su G. Long noncoding RNA UCA1 promotes osteosarcoma metastasis through CREB1‐mediated epithelial‐mesenchymancRl transition and activating PI3K/AKT/mTOR pathway. J Bone Oncol. 2019;16:100228. [DOI] [PMC free article] [PubMed] [Google Scholar]
- 50. Cai Y, Sheng Z, Chen Y, Wang J. LNA HMMR‐AS1 promotes proliferation and metastasis of lung adenocarcinoma by regulating MiR‐138/sirt6 axis. Aging. 2019;11(10):3041‐3054. [DOI] [PMC free article] [PubMed] [Google Scholar]
- 51. Liu X, Zheng J, Xue Y, et al. Inhibition of TDP43‐mediated SNHG12‐miR‐195‐SOX5 feedback loop impeded malignant biological behaviors of glioma cells. Mol Ther Nucleic Acids. 2018;10:142‐158. [DOI] [PMC free article] [PubMed] [Google Scholar]
- 52. Song Y, Shao L, Xue Y, et al. Inhibition of the aberrant A1CF‐FAM224A‐miR‐590‐3p‐ZNF143 positive feedback loop attenuated malignant biological behaviors of glioma cells. J Exp Clin Cancer Res. 2019;38(1):248. [DOI] [PMC free article] [PubMed] [Google Scholar]
Associated Data
This section collects any data citations, data availability statements, or supplementary materials included in this article.
Supplementary Materials