

Abstract
Bacterial translation initiation entails the tightly regulated joining of the 50S ribosomal subunit to an initiator transfer RNA (fMet-tRNAfMet)-containing 30S ribosomal initiation complex (IC) to form a 70S IC that subsequently matures into a 70S elongation-competent complex (70S EC). Rapid and accurate 70S IC formation is promoted by 30S IC-bound initiation factors (IFs), which must dissociate before the resulting 70S EC can begin translation elongation1. Although comparison of 30S2–5 and 70S4,6–8 IC structures have revealed that the ribosome, IFs, and fMet-tRNAfMet can acquire different conformations in these complexes, the timing of conformational changes during 70S IC formation, structures of any intermediates formed during these rearrangements, and contributions that these dynamics might make to the mechanism and regulation of initiation remain unknown. Moreover, the absence of a 70S EC structure obtained directly from a 70S IC formed via an IF-catalyzed initiation reaction has precluded an understanding of ribosome, IF, and fMet-tRNAfMet rearrangements that occur upon maturation of a 70S IC into a 70S EC. Using time-resolved cryogenic electron microscopy (TR cryo-EM)9 we report the first, near-atomic-resolution view of how a time-ordered series of conformational changes drive and regulate subunit joining, IF dissociation, and fMet-tRNAfMet positioning during 70S EC formation. Our results demonstrate the power of TR cryo-EM to determine how a time-ordered series of conformational changes contribute to the mechanism and regulation of one of the most fundamental processes in biology.
Translation initiation is a fundamental step in gene expression that is essential for the overall fitness and viability of cells. In bacteria, the dynamic initiation reaction is kinetically controlled by three IFs (IF1, the guanosine triphosphatase IF2, and IF3), which collaborate to ensure accurate selection of fMet-tRNAfMet and its pairing with the mRNA start codon10–13. Canonical initiation begins with assembly of the 30S IC, followed by IF2-catalyzed joining of the 50S subunit to the 30S IC to form a 70S IC and maturation of the 70S IC into a 70S EC1,14,15. Given the essential nature of this process, structural intermediates formed during initiation in bacteria represent promising targets for the development of next-generation antibiotics16–18.
Ensemble rapid kinetic and single-molecule studies have led to the identification and characterization of several intermediate steps during the late stages of initiation. These studies have shown that subunit joining triggers rapid GTP hydrolysis by IF21,14,19–21, dissociation of the IFs1,12,19, transition of the ribosomal subunits into their non-rotated inter-subunit orientation22,23, and accommodation of fMet-tRNAfMet into the peptidyl-tRNA binding (P) site of the peptidyl transferase center (PTC)24. In addition, structures of various 30S2–5,18 and 70S ICs4,6–8 obtained by cryo-EM have revealed intermediate ICs that vary in the conformation of the ribosome, IFs, and fMet-tRNAfMet. Nonetheless, notable discrepancies in the inter-subunit orientation of the ribosome and position of fMet-tRNAfMet in several of the available 70S IC structures have made it difficult to arrive at a consensus structural model for initiation4,6–8. Furthermore, the 70S ICs represented by the available structures were formed using a 70S ribosome and an IF2 bound to a non-hydrolyzable GTP analog (e.g., GDPNP) that results in a biochemically trapped 70S IC, rather than by mixing the 50S subunit with a 30S IC that carries a native, GTP-bound IF2 and results in the formation of a 70S IC, which subsequently matures into a 70S EC. Consequently, the available 70S IC structures do not provide information about how the various structural intermediates that have been observed evolve over the course of the initiation reaction. Therefore, these structural studies have been unable to distinguish on-pathway intermediates formed during canonical initiation from spurious, off-pathway intermediates.
To circumvent this problem, and to capture transient, on-pathway intermediates that are created during canonical translation initiation, we have employed mixing-spraying TR cryo-EM9,25–27. Previously, we have used this method to study the association of vacant 30S- and 50S subunits to form 70S ribosomes25, and to visualize transient structural intermediates formed during the ribosome recycling process26. Having demonstrated that passage through the microfluidic device does not damage the 30S IC (Methods and Extended Figure 1a and 1b), here we have used mixing-spraying TR cryo-EM to investigate the IF-catalyzed joining of the 30S IC with the 50S subunit to form a transient 70S IC that matures into a 70S EC. Using this approach, we have visualized, in real time and with near-atomic spatial resolution, the conformational rearrangements of the 30S and 70S ICs that promote and control subunit joining, IF dissociation, and fMet-tRNAfMet positioning during 70S EC formation.
Ensemble rapid kinetic studies suggest that transient intermediates formed during initiation are populated on the sub-second timescale10,12,14,19–21. Using published rate constants19,, we developed a kinetic model and analyzed how the populations of the expected structural species were predicted to vary as a function of time during subunit joining reactions in which 50S subunits were mixed with 30S ICs (Supplementary Methods and Extended Figure 1c). The analysis predicts that the size of the population of 70S ICs carrying a GTP- or GDP•Pi-bound IF2 is maximized at ~150 ms and that joining of the 50S subunit to the 30S IC to form a mature 70S EC is ~65% complete within 600 ms. Using a set of microfluidic chips designed27 to provide reaction times of ~20 ms, ~80 ms, ~200 ms, and ~600 ms in our mixing-spraying TR cryo-EM apparatus (Extended Figure 2), we therefore mixed 50S subunits with 30S ICs and collected images at each time point. At each time point, two-dimensional (2D) classification of the images yielded 30S subunit-like, 50S subunit-like, and 70S ribosome-like particle classes. Subsequently, the particles from the ~20 ms, ~80 ms, ~200 ms, and ~600 ms time points were combined into two datasets. The first dataset, containing the 30S subunit-like particles, was subjected to 3D classification. The second dataset, containing 50S subunit-like and 70S-ribosome like particles, was subjected to a combination of 3D classification and 2D classification to sort out compositional and conformational heterogeneity (Methods and Extended Figure 3). This classification scheme yielded the structures of five distinct classes: (1) a complex containing the 30S subunit, mRNA and fMet-tRNAfMet, but lacking IF1 and IF2; (2) the 30S IC; (3) the 50S subunit; (4) the 70S IC; and (5) the 70S EC. Execution of an independent, masked classification strategy failed to find any additional rare and/or low-population intermediate conformations of the 70S IC or 70S EC, confirming that our classification scheme did not miss any such states (Methods and Extended Figure 4).
Notably, the sizes of populations of the 50S subunit, 70S IC, and 70S EC (Table 1) obtained from our classification strategy qualitatively follow the predicted kinetics (Figure 1a and Extended Figure 1c), with the population of the 50S subunit decreasing as the population of the 70S EC increases from ~20 ms to ~600 ms (Extended Figure 1c). Moreover, the particle populations reported in Figure 1a and Extended Figure 1c and the structures of the corresponding particle classes are robust to the inclusion of up to 20% ‘noise particles’ falsely picked from the background (Supplementary Methods, Supplementary Tables 1 and 2, and Extended Figure 5).
Table 1.
Populations of the 50S subunit, 70S IC, and 70S EC obtained after 3D classification. Standard deviations were obtained by repeating the 3D classification procedure three times for each time point.
| 50S (%) | 70S IC (%) | 70S EC (%) | |
|---|---|---|---|
| 20 ms | 58.0 ± 0.7 | 35 ± 0.8 | 7.1 ± 0.8 |
| 80 ms | 36.0 ± 3.4 | 43.4 ± 1.7 | 20.6 ± 1.7 |
| 200 ms | 30.8 ± 5.6 | 12.7 ± 3.4 | 56.4 ± 3.4 |
| 600 ms | 28.4 ± 2.1 | 8.1 ± 2.0 | 63.6 ± 2.0 |
Figure 1: Structural and time-resolved population analyses of the 50S subunit, 70S IC, and 70S EC.
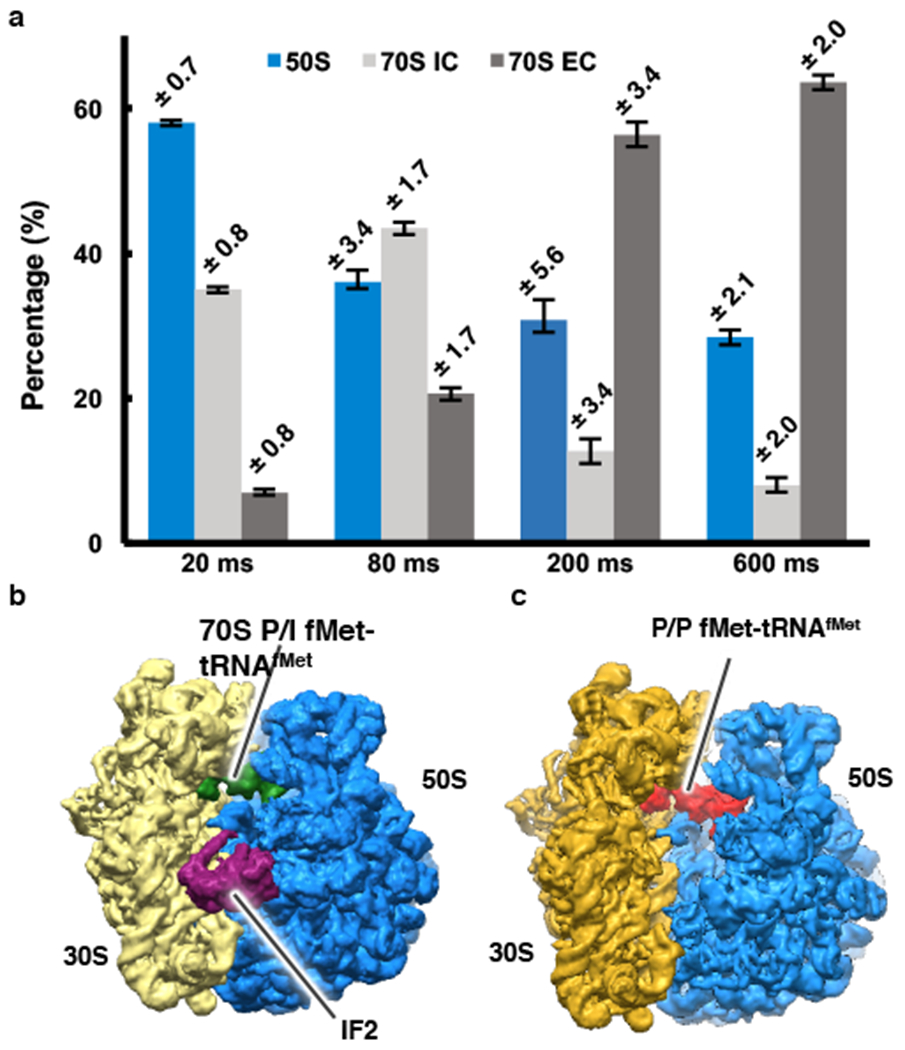
(a) The populations of the 50S subunit, 70S IC, and 70S EC at the 20 ms, 80 ms, 200 ms, and 600 ms time points as obtained by 3D classification of the imaged particles. The error bars represent standard deviations obtained by repeating the 3D classification procedure three times for each time point. (b-c) The cryo-EM reconstruction (i.e. cryo-EM-derived Coulomb potential maps30) of the (b) 70S IC and (c) 70S EC.
Among the five particle classes that we obtained, we selected the 30S IC, 70S IC, and 70S EC for further structural analysis (Figures 1b, 1c, and Figure 2a). The 70S IC structure reported here is obtained by mixing the 50S subunit with a 30S IC carrying a native, GTP-bound IF2, and the 70S EC structure is obtained directly from a 70S IC formed via an IF-catalyzed initiation reaction. The resolutions of the 30S IC, 70S IC, and 70S EC were estimated to be 4.2 Å, 4.0 Å, and 3.9 Å, respectively, according to a resolution-estimating protocol that avoids overfitting and uses the Fourier shell correlation (FSC) with the FSC=0.143 criterion28 (Extended Figure 6). Molecular Dynamics Flexible Fitting (MDFF)29 was then used to generate structural models of the 30S IC and 70S IC, while rigid-body fitting of previously published structures of the 30S and 50S subunits (PDB IDs: 2AVY and 2AW4, respectively) was used to generate a structural model of the 70S EC (Methods).
Figure 2: Ribosome, IF, and fMet-tRNAfMet dynamics during 70S IC formation.
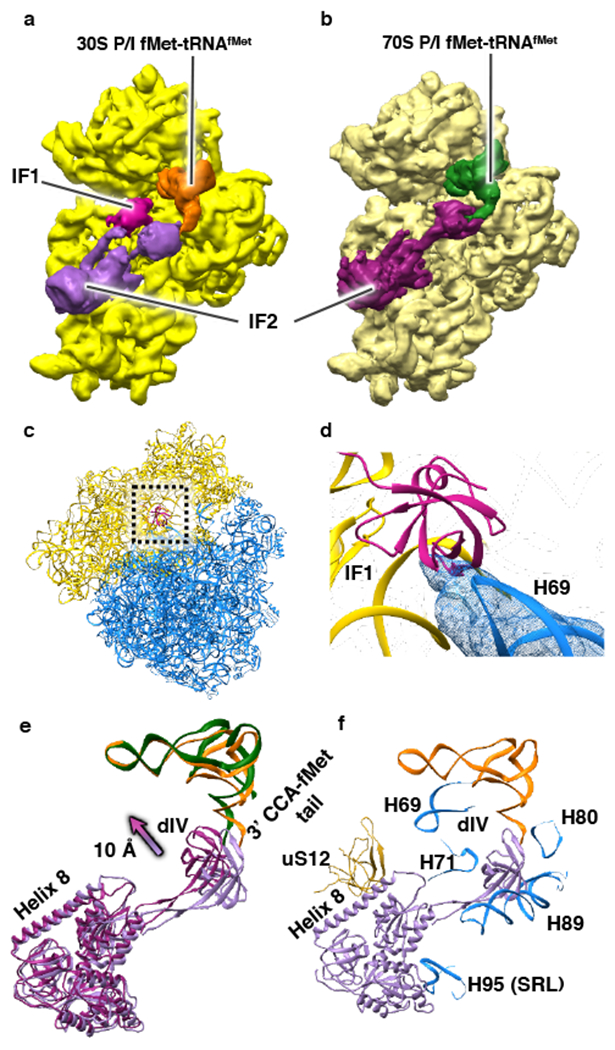
(a-b) Cryo-EM reconstructions viewed from the inter-subunit faces of (a) the 30S IC (with the 30S subunit shown in yellow) and (b) the 30S subunit (pale yellow), IF2, and fMet-tRNAfMet from the 70S IC. (c) Superposition of the 30S subunits of the 30S IC and the 70S IC and analysis of the conformations of the 30S subunit and IF1 (shown in magenta) from the 30S IC and the 50S subunit from the 70S IC. The analysis reveals that rapid dissociation of IF1 upon 50S subunit joining to the 30S IC relieves a potential steric clash between IF1 and the 50S subunit that would take place during 70S IC formation. (d) A magnified view of the superposition shown in panel (c) highlights the potential steric clash between turn 1 of IF1 and H69 of the 50S subunit. (e) Superposition of the 30S subunits from the 30S IC and the 70S IC, and comparative analysis of the conformations of IF2 and fMet-tRNAfMet from the 30S IC (light purple and orange, respectively) and IF2 and fMet-tRNAfMet from the 70S IC (dark purple and green, respectively). The analysis reveals that dIV of IF2 moves toward the inter-subunit face of the 30S subunit by ~10 Å and, as it rearranges from its 30S P/I to its 70S P/I configuration, the central domain and 3’ CCA-fMet tail of fMet-tRNAfMet move slightly towards tRNA exit (E) site of the 30S subunit upon 50S subunit joining to the 30S IC and formation of the 70S IC. (f) Superposition of the 30S subunits from the 30S IC and the 70S IC and analysis of the conformations of IF2 from the 30S IC and uS12 (shown in pale yellow) of the 30S subunit of the 70S IC and H69, H71, H80, H89, and H95 (the sarcin-ricin loop (SRL)) (shown in blue) of the 50S subunit of the 70S IC that interact with IF2. The analysis reveals that the IF2 rearrangements shown in panel (e) relieve a potential steric clash between dIV of IF2 and H89 that would take place during 70S IC formation.
Analysis of the 70S ICs that are formed within the first ~20-80 ms after mixing 50S subunits with 30S ICs shows that all inter-subunit bridges are formed. Moreover, we find that IF1 has also dissociated from these 70S ICs (compare Figures 2a and 2b). This observation is significant because IF1 occupies a binding site between the cleft of 16S ribosomal RNA (rRNA) helix (h) 44, h18, and ribosomal protein uS12 on the 30S subunit that enables turn 1 of IF1, comprised of residues 18–21, to establish contacts with the minor groove of h44. Consequently, dissociation of IF1 relieves a strong steric clash that would otherwise exist between turn 1 of IF1 and 23S rRNA helix (H) 69 of the 50S subunit (Figure 2c and 2d). Because inter-subunit bridge B2a is formed by an interaction between h44 and H69, dissociation of IF1 early during subunit joining enables this critically important inter-subunit bridge to be established rapidly during initial 70S IC formation.
By the time ~80 ms has elapsed, the population of the 70S IC has reached its maximum and, by ~200 ms, IF2 has dissociated from a significant fraction of this 70S IC population, resulting in the formation of mature 70S ECs, a process that continues through the 600 msec time point and beyond. Interestingly, the 70S IC that is captured in this study by mixing 50S subunits with 30S ICs carrying native, GTP-bound IF2 is in a semi-rotated inter-subunit orientation that is very similar to the orientation observed in the 70S IC reported by Allen and coworkers6 and the orientation of the major population of the 70S IC reported by Sprink and coworkers (i.e., 70S-IC II)8. 70S IC-bound IF2 establishes three sets of interactions with the ribosome. Specifically, helix 8 of IF2 interacts with the inter-subunit surface of uS12 in the 30S subunit; domain IV (dIV) of IF2 interacts with H69, H71, H89, and the loop-containing residues 77–85 of ribosomal protein uL16 of the 50S subunit; and dI of IF2 interacts with the sarcin-ricin loop (H95) of the 50S subunit (Extended Figure 7). Because the semi-rotated inter-subunit orientation of the 70S ribosome uniquely facilitates the simultaneous formation of these three sets of IF2-ribosome interactions, IF2 selectively stabilizes the 70S IC in this orientation.
Comparative analysis of the 30S- and 70S ICs reveals subunit joining-dependent conformational changes of IF2 that facilitate formation of the 70S IC. Relative to its position on the 30S IC, dIV of IF2 is stabilized in a position that is ~10 Å closer to the 30S subunit, a structural transition that eliminates a potential steric clash with H89 (Figure 2e and 2f). Furthermore, the relatively early dissociation of IF1 during 70S IC formation increases the conformational freedom of helix 8 of IF2, allowing it to acquire a position that is closer to the 50S subunit (Figure 2e). Based on previous ensemble rapid kinetic studies14,19–21 demonstrating that the rate of GTP hydrolysis is relatively fast and nearly indistinguishable from the rate of initial subunit association, and that the rate of Pi release is slower than the rate of IF2 dissociation, we propose that we have uniquely captured the native, GDP•Pi-form of IF2 on the 70S IC. This proposal is supported by a structural analysis demonstrating that GDP•Pi more precisely models the Coulomb potential map30 of the guanosine nucleotide bound to IF2 in the 70S IC than GTP does (Extended Figure 8). The similarity between the conformation of the GDP•Pi-form of IF2 captured here and the non-hydrolyzable GTP analog-form of IF2 reported in all of the other 70S IC structures that have been published4,6–8 suggests that when IF2 hydrolyzes GTP, it does not immediately undergo a conformational change. This indicates that the transition from the 70S IC to the 70S EC is largely regulated by the release of Pi from IF2 and/or the subsequently rapid release of the GDP-form of IF2 from the 70S IC.
As the 70S IC matures into a 70S EC, dissociation of IF2 disrupts the IF2-ribosome interactions that stabilize the semi-rotated inter-subunit orientation of the 70S IC. Disruption of these IF2-ribosome interactions therefore triggers the reverse rotation of the 30S subunit by ~3° (Figure 3a), which allows the 70S ribosome within the 70S EC to occupy the non-rotated inter-subunit orientation. Dissociation of IF2 also disrupts the contact between dIV of IF2 and fMet-tRNAfMet, an event that, simultaneously with the reverse rotation of the 30S subunit (at least at our time resolution), enables the central domain and 3’ CCA-fMet tail of fMet-tRNAfMet to move by ~28 Å and ~22 Å, respectively, from the 70S P/I configuration of fMet-tRNAfMet that is observed in the 70S IC to the P/P configuration of fMet-tRNAfMet that is observed in the 70S EC (Figure 3b, 3c, and 3d). This rearrangment of fMet-tRNAfMet is accompanied by an ‘untangling’ of the 3’ CCA-fMet tail that allows the fMet moiety to acquire its peptidyl transfer-competent position within the P site of the PTC (Figure 3c and 3d). Given the simultaneous nature of these conformational changes, at least at our time resolution, we propose that the transition of the 70S ribosome into its non-rotated inter-subunit orientation is coupled to the rerrangement of fMet-tRNAfMet into its P/P configuration in the 70S EC, along with the untangling of the 3’ CCA-fMet tail and positioning of the fMet moiety into the PTC.
Figure 3: Ribosome and fMet-tRNAfMet dynamics during maturation of the 70S IC into a 70S EC.
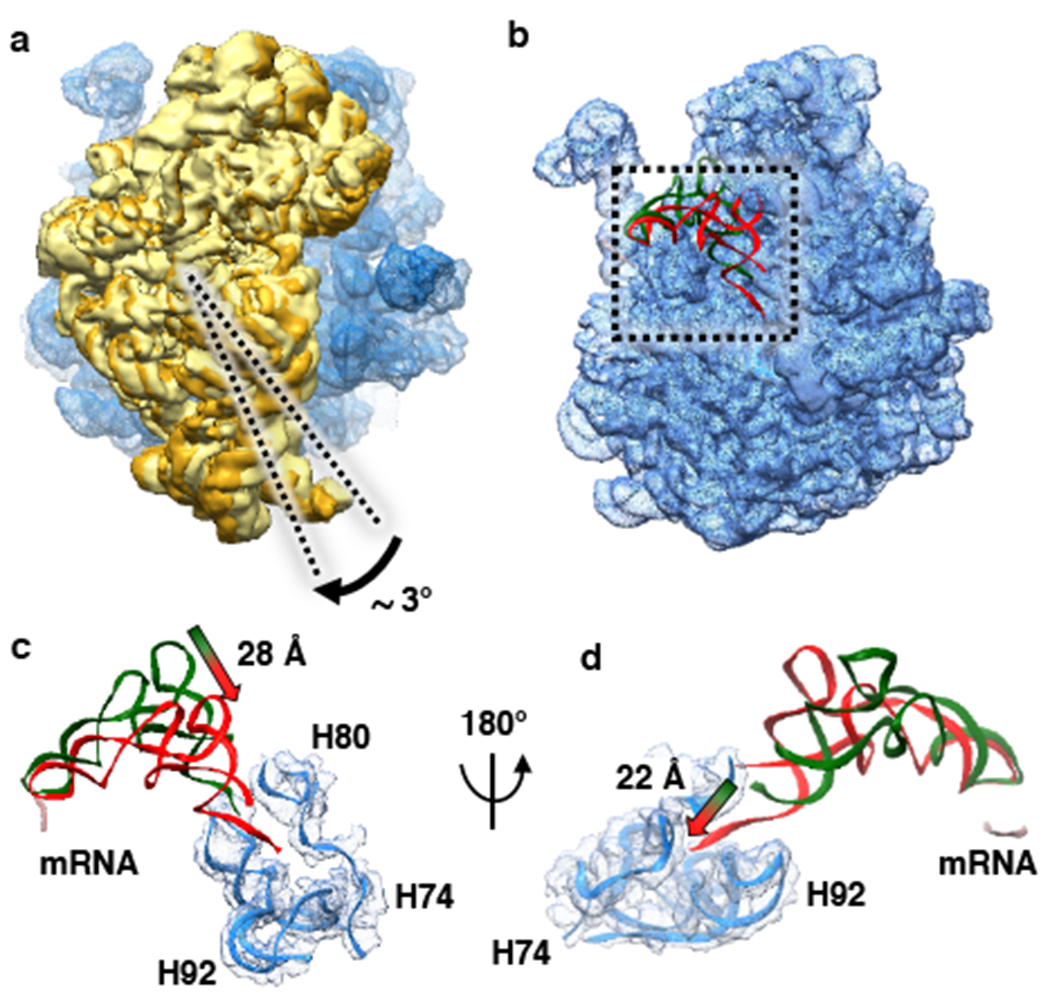
(a) Superposition of the 50S subunits from the 70S IC and 70S EC and comparative analysis of the conformations of the 30S subunit from the 70S IC (pale yellow) and the 30S subunit from the 70S EC (golden yellow). The analysis reveals that the ribosomal subunits from the 70S IC that is initially formed upon 50S subunit joining to the 30S IC transiently acquire a semi-rotated inter-subunit orientation and subsequently undergo an ~3°clockwise rotation, when viewed from the solution side of the 30S subunit, into the non-rotated inter-subunit conformation upon maturation of the 70S IC into a 70S EC. (b) Superposition of the 50S subunits from the 70S IC and 70S EC and comparative analysis of the conformations of fMet-tRNAfMet in the 70S P/I configuration from the 70S IC (green) and fMet-tRNAfMet in the P/P configuration from the 70S EC (red). The start codon of the mRNA is shown in pale pink. The analysis reveals the conformational rearrangements of fMet-tRNAfMet that take place as the 70S IC matures into a 70S EC. (c) A magnified view of the superposition shown in panel (b) reveals that the central domain of fMet-tRNAfMet moves by ~28 Å towards the P site. (d) A 180° rotation of the superposition shown in panel (c) highlights the untangling of the 3’ CCA fMet tail of the fMet-tRNAfMet and its ~22 Å movement into the PTC.
In this report, we have shown how mixing-spraying TR cryo-EM is able to capture physiologically relevant, short-lived, structural intermediates in a biomolecular reaction and have used this approach to elucidate the molecular mechanism of bacterial translation. Based on our collective observations, we propose a structure-based model for the late steps of bacterial translation initiation (Figure 4). Notably, we did not observe formation of the minor population of the 70S IC reported by Sprink and coworkers (i.e., 70S-IC I)8, suggesting that this conformation of the 70S IC might represent an off-pathway intermediate that is formed only when the 70S IC is trapped when using the GDPNP-form of IF2 and/or prepared using a steady-state approach. In contrast, because the conformation of the 70S IC that we observe here was obtained using the native, GTP-bound form of IF2 under pre-steady-state conditions, we can be certain that it represents an intermediate that is formed on the initiation reaction pathway. Mixing-spraying TR cryo-EM is a new and powerful structural biology technique that we expect will be employed to follow the formation and maturation of reaction intermediates and elucidate the molecular mechanisms of fundamental biomolecular reactions such as DNA replication, transcription, pre-mRNA processing and splicing, and mRNA and protein degradation.
Figure 4: Structure-based kinetic model for late steps in bacterial translation initiation.
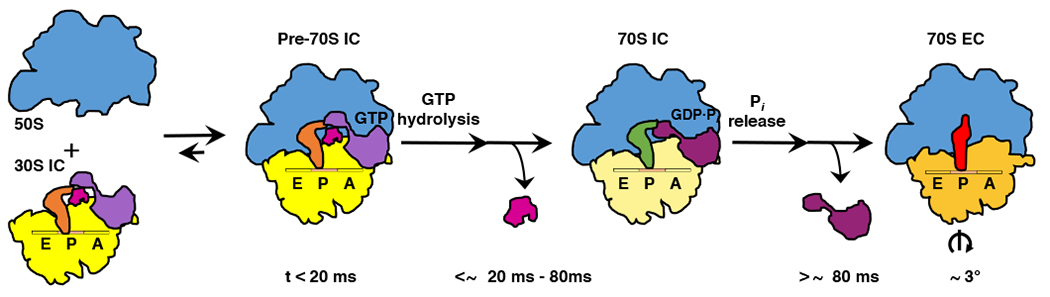
Cartoon depicting the timing of structural and molecular events during late steps in bacterial translation initiation. Within the first ~20 ms after mixing 50S subunits and 30S ICs, 50S subunits (blue) reversibly join to the majority of 30S ICs (yellow) to form transient Pre-70S ICs. Conversion of the majority of these Pre-70S ICs into 70S ICs takes place within ~20–80 ms after mixing of 50S subunits and 30S ICs and begins with the rapid hydrolysis of GTP on IF2 (light purple). GTP hydrolysis is followed by the dissociation of IF1 (magenta), repositioning of dIV of IF2 (dark purple), and formation of IF2-ribosome interactions and inter-subunit bridges that stabilize the ribosome in its semi-rotated inter-subunit orientation and the fMet-tRNAfMet in its 70S P/I configuration. Within the next several hundred milliseconds, the majority of 70S ICs mature into 70S ECs in a process that begins with release of Pi from IF2 and dissociation of the GDP-form of IF2 from the 70S IC, events that enable rotation of the ribosomal subunits into their non-rotated inter-subunit orientation, rearrangement of fMet-tRNAfMet into its P/P configuration, untangling of the 3’ CCA-fMet tail of fMet-tRNAfMet, and relocation of the fMet moiety of fMet-tRNAfMet into the PTC in preparation for formation of the first peptide bond upon delivery of the first aminoacyl-tRNA into the ribosomal aminoacyl-tRNA binding (A) site.
METHODS
Preparation, purification, and validation of IC components and the 30S IC
30S and 50S subunits were purified from the MRE600 Escherichia coli strain as previously described, with minor modifications31. Tight-coupled 70S ribosomes were isolated by ultracentrifugation of crude ribosomes through a 10–40% sucrose density gradient prepared in Ribosome Storage Buffer (10 mM tris(hydroxymethyl)aminomethane acetate (Tris-OAc) (pH4 °C = 7.5), 60 mM ammonium chloride (NH4Cl), 7.5 mM magnesium chloride (MgCl2), 0.5 mM ethylenediaminetetraacetic acid (EDTA), 6 mM 2-mercaptoethanol (BME). To maximize the purity of our tight-coupled 70S ribosomes and minimize contaminatination by free 50S subunits, a second round of ultracentrifugation through a 10–40% sucrose density gradient prepared in Ribosome Storage Buffer was added to our standard ribosome purification protocol. Highly pure, tight-coupled, 70S ribosomes were buffer-exchanged into Ribosome Dissociation Buffer (10 mM Tris-OAc (pH4 °C = 7.5), 60 mM NH4Cl, 1 mM MgCl2, 0.5 mM EDTA, 6 mM BME) using a centrifugal filtration device (Amicon Ultra, Millipore) with a 100 KDa molecular weight cut-off (MWCO) to promote the dissociation of ribosomes into 30S and 50S subunits. 30S and 50S subunits were isolated from the dissociated tight-coupled 70S ribosomes by ultracentrifugation through a 10–40% sucrose density gradient prepared in Ribosome Dissociation Buffer. To ensure high purity, 30S and 50S subunits isolated from the first gradient were subjected to a second round of ultracentrifugation through a 10–40% sucrose density gradient prepared in Ribosome Dissociation Buffer. Highly purified 30S and 50S subunits were concentrated and buffer-exchanged into Ribosome Storage Buffer using a centrifugal filtration device with a 100 KDa MWCO. After determining the concentration of the 30S and 50S subunits, small aliquots were prepared, flash frozen in liquid nitrogen, and stored at −80 °C.
The purity of our 30S and 50S subunits was confirmed by negative staining electron microscopy (EM). Briefly, one aliquot of the highly purified 30S subunits was diluted to 50 nM with Tris-Polymix Buffer (50 mM Tris-OAc (pHRT = 7.5), 100 mM potassium chloride (KCl), 5 mM ammonium acetate (NH4OAc), 0.5 mM calcium acetate (CaOAc2), 5 mM magnesium acetate (MgOAc2), 0.1 mM EDTA, 6 mM BME, 5 mM putrescine dihydrochloride, and 1 mM spermidine, free base). Subsequently, 3 μl of this 50 nM 30S subunit solution was applied to a carbon-coated EM grid for 30 s. Any excess sample solution was wicked away from the EM grid using filter paper, thereby generating a thin layer of sample solution on the EM grid. Following this, 3 μl of a 2% solution of uranium acetate in water was applied to the EM grid and the EM grid was incubated for 30 s at room temperature. Excess sample solution was wicked away from the EM grid using filter paper, once again generating a thin layer of sample solution on the EM grid. This uranium acetate, negative staining procedure was repeated two more times and, subsequently, the negatively stained 30S subunits were imaged using a 200 kV F20 cryogenic transmission electron microscope (TEM; FEI). Visual inspection of the images that were obtained revealed a highly uniform set of particles exhibiting the characteristically elongated shape of the 30S subunit, thereby demonstrating the purity of the 30S subunits. Analogous procedures were followed to load, negatively stain, and image the highly purified 50S subunits, with visual inspection of the images revealing a highly uniform set of particles exhibiting the characteristic ‘crown view’ of the 50S subunit, thereby demonstrating the purity of the 50S subunits.
IF1 and the γ-isoform of IF2 containing tobacco etch virus (TEV) protease-cleavable, N-terminal, hexa-histidine (6×His) tags were overexpressed in BL21(DE3) cells and purified as described previously32. Briefly, 6×His-tagged IFs were purified by nickel nitrilotriacetic acid (Ni2+-NTA) affinity chromatography using a batch-binding and elution protocol. After elution of the 6×His-tagged IFs, the 6×His-tags were removed by adding TEV protease to the purified IFs and dialyzing-incubating the mixture overnight (~12 hr) at 4 °C against TEV Cleavage Buffer (20 mM tris(hydroxymethyl)aminomethane hydrochloride (Tris-HCl) (pH4°C = 7.5), 200 mM NaCl, 0.1% Triton X-100, and 2 mM BME). IF1 was further purified on a HiLoad 16/60 Superdex 75 prep grade gel filtration column (GE Biosciences), and IF2 was further purified on a HiTrap SP HP cation-exchange column (GE Biosciences). The purified IFs were concentrated and buffer exchanged into 2× Translation Factor Buffer (20 mM Tris-OAc (pH4°C = 7.5), 100 mM KCl, 20 mM MgOAc2, 10 mM BME) using a centrifugal filtration device (Amicon Ultra, Millipore) with either a 3.5 KDa (IF1) or a 10 KDa (IF2) MWCO. Concentrated IFs were diluted with one volume of 100% glycerol and stored at –20 °C. Prior to using in 30S IC assembly reactions, the IFs were buffer exchanged into Tris-Polymix Buffer using either a Micro Bio-Spin 6 (IF1) or 30 (IF2) gel filtration spin column (Bio-Rad).
tRNAfMet (MP Biomedicals) was aminoacylated and formylated as described previously32. The yield of fMet-tRNAfMet, which was assessed by hydrophobic interaction chromatography (HIC) on a TSKgel Phenyl-5PW column (Tosoh Bioscience) as described previously32, was ~90%. The mRNA used in the 30S IC assembly reaction was chemically synthesized (Thermo Fisher) and is a non-biotinylated variant of the bacteriophage T4 gene product (gp) 32 mRNA that we have used extensively in our single-molecule fluorescence studies of initiation15,31,33,34. The sequence of this mRNA is 5’-CAACCUAAAACUUACACAAAUUAAAAAGGAAAUAGACAU GUUCAAAGUCGAAA AAUCUACUGCU-3’.
The 30S IC was assembled by combining 3.6 μM each of IF1, IF2, and fMet-tRNAfMet, 4.8 μM of mRNA, 1 mM GTP, and 2.4 μM of 30S subunits in our optimized Tris-Polymix Buffer32. The final volume of the 30S IC assembly reaction was 100 μl. IF2, which has been previously shown to protect fMet-tRNAfMet from deacylation35 was added to the 30S IC assembly reaction prior to fMet-tRNAfMet. To ensure that the 30S IC assembly reaction proceeded in a native, unbiased manner, the 30S subunits were added last. Previous ensemble rapid kinetic- and single-molecule studies have shown that IF3 dissociates prior to36, or shortly after12,15,19,34,37,38, subunit joining. Notably, several of these studies have shown that IF3 regulates the subunit joining reaction by rendering it reversible, establishing a 30S IC + 50S ⇄ 70S IC dynamic equilibrium in which destabilization of the 70S IC inhibits maturation of the 70S IC into a 70S EC13–15,19,37. Thus, in order to ensure formation of a stable 70S IC that could productively mature into a 70S EC, IF3 was not included in the 30S IC investigated here. Assembly reactions were incubated at 37 °C for 10 minutes, chilled on ice for 5 minutes, flash frozen in liquid nitrogen and stored at −80 °C.
To assess whether the 30S IC was stable enough to maintain its integrity during mixing-spraying TR cryo-EM, 2.4 μM of 30S IC in Tris-Polymix Buffer and an equal volume of Tris-Polymix Buffer lacking 50S subunits were injected into the microfluidic chip designed to give the longest reaction time (~600 ms), mixed, and sprayed onto an EM grid as the grid was plunge-frozen in liquid ethane. The grid was subsequently stored in liquid nitrogen, all as described above. When ready, the plunge-frozen grid was imaged with the 300 kV Tecnai Polara F30 TEM (FEI), as described above. Subsequently, 2D classification was used to select 30S subunit-like particles. The selected particles were then subjected to 3D classification, which showed that ~75% of the 30S subunit-like particles were 30S ICs and ~25% of the 30S subunit-like particles were 30S subunits carrying a P-site fMet-tRNAfMet (or, more likely, a mixture of fMet-tRNAfMet and deacylated tRNAfMet) in its ‘30S P/I’ configuration (Extended Figure 1a and 1b). The results of this experiment demonstrate that the majority of the 30S IC remains intact during injection and mixing in the microfluidic chip and spraying onto the EM grid.
Preparation of EM grids and mixing-spraying TR cryo-EM
Quantifoil gold R1.2/1.3 grids39 with 300 mesh size were subjected to glow discharge in H2 and O2 for 25 s using a Solarus 950 plasma cleaning system (Gatan) set to a power of 25 W. For each of the four time points, 1.2 μM of 50S subunit in Tris-Polymix Buffer and 2.4 μM of 30S IC in Tris-Polymix Buffer were injected into the corresponding microfluidic chip at a rate of 3 μl s−1 such that they could be mixed and sprayed onto a glow-discharged grid as previously described25. The final concentration of the 50S subunit and the 30S IC after rapid mixing in our microfluidic chip was 0.6 μM and 1.2 μM, respectively. As the mixture was sprayed onto the grid, the grid was plunge-frozen in liquid ethane. The grid was stored in liquid nitrogen until it was ready to be imaged.
Cryo-EM data collection
Plunge-frozen grids were imaged with a 300 kV Tecnai Polara F30 TEM (FEI). The images were recorded within a defocus range of 1–3 μm on a K2 direct detector camera (Gatan) operating in counting mode with an effective magnification of 29,000× at 1.66 Å pixel−1. Images were composed of 40 frames that were exposed for a total of 12 seconds, corresponding to a total dose of 35 e− per Å2.
Cryo-EM data processing
A flow-chart of the data processing procedure detailed here is given in Extended Figure 3. Micrographs were first screened at each time point, then 468, 605, 445, and 363 micrographs were selected at 20 ms, 80 ms, 200 ms, and 600 ms, respectively. The beam-induced motion of the sample captured by the images was corrected using the MotionCor2 software program40. The contrast transfer function (CTF) of each micrograph was estimated using the CTFFIND4 software program41. Imaged particles were picked using the Autopicker algorithm included in the RELION 2.0 software program42. These particles were first extracted using 2x binning of the images and subjected to 2D classification to separate 30S subunit-like, 50S subunit-like, and 70S ribosome-like particles from ice-like and/or debris-like particles picked by the Autopicker algorithm. Exclusion of ice-like and debris-like particles resulted in totals of 79,204, 109,775, 59,350, and 66,979 30S subunit-like, 50S subunit-like, or 70S ribosome-like particles at 20 ms, 80 ms, 200 ms, and 600 ms, respectively. All particles classified as 30S subunit-like were pooled together into a set of 170,864 particles, and all particles classified as 50S subunit-like or 70S ribosome-like were pooled together into a set of 144,504 particles. The reason the 50S subunit-like and 70S ribosome-like particles were pooled together is that some of the 70S ribosome-like particles have the appearance of 50S subunit-like particles in particular viewing directions, so separation of these particles must be deferred to the next step.
The set of 170,864 30S subunit-like particles was subjected to a round of 3D classification, from which we obtained two major subclasses. The first subclass encompassed 86,367 30S ICs and the second encompassed 17,686 30S subunits carrying only a P-site fMet-tRNAfMet (or, more likely, a mixture of fMet-tRNAfMet and deacylated tRNAfMet) in the P/I configuration. The subclass containing the 30S ICs was further refined without binning the images. The resolution of the refined 30S IC was estimated to be 4.2 Å using a resolution-estimating protocol that avoids overfitting and uses the FSC with the FSC=0.143 criterion28.
The set of 144,504 combined 50S subunit-like and 70S ribosome-like particles was subjected to 3D classification, from which we obtained two major subclasses. The first subclass encompassed 50S subunits and the second encompassed 70S ribosome-like particles. We found it necessary to subject this second subclass to a second round of 2D classification because of evidence of residual compositional heterogeneity. In this step, some 50S subunits were still found, and separated from 80,138 remaining 70S ribosome-like particles. The 50S subunits obtained from this second round of 2D classification were combined with the 50S subunits from the first round of 3D classification for a total of 50,918 50S subunits.
The whole process of two rounds of 2D classification and 3D classification was repeated three times to estimate the errors associated with classifying the set of particles into 50S subunit and 70S ribosome-like particle populations (Table 1). At this point in the analysis, each 50S subunit and 70S ribosome-like particle was traced back to the time point from which it originated to determine the 50S subunit and 70S ribosome-like particle populations at each time point.
The 70S ribosome-like subclass with 80,138 particles was then subjected to a round of 3D classification from which we obtained two major subclasses. The first subclass encompassed 34,096 70S ICs and the second encompassed 46,042 70S ECs. Again, this third round of 3D classification was repeated three times in order to estimate the errors associated with classifying the set of particles into 70S IC and 70S EC populations (Table 1). The subclasses containing the 70S ICs and 70S ECs were then further refined without binning the images. The Fourier amplitudes of the refined cryo-EM maps were sharpened using the ‘postprocess’ command in RELION. The resolutions of the 70S IC and 70S EC maps were estimated to be 4.0 Å and 3.9 Å, respectively, using a resolution-estimating protocol that avoids overfitting and uses the FSC with the FSC=0.143 criterion28.
The percentage of particles in the 50S subunit-, 70S IC-, and 70S EC particle classes at each time point was calculated by summing up the number of particles in each particle class at each time point and subsequently calculating the fraction of particles in each particle class with respect to the total number of particles at each time point. To compare the percentages of particles in the 50S subunit-, 70S IC-, and 70S EC particle classes obtained here with the concentrations of 50S subunits, 70S ICs, and 70S ECs predicted by the kinetic modeling, the percentages obtained here were used to calculate the concentration of each particle class, assuming the total concentration of particles in the kinetic modeling was limited to 0.6 μM (i.e., the limiting concentration of 50S subunits used in the kinetic modeling) (Extended Figure 1c).
Additional 3D classification to find low-population intermediate conformations from the 70S particle dataset.
We employed masked 3D classification scheme on a dataset of 80,138 70S ribosome particles to search for rare conformations of 70S IC and 70S EC. In the masked 3D classification scheme a mask was designed covering densities of IF1, IF2, P/P-configured P-site tRNA, and P/E-configured P-site tRNA (Extended Figure 4a–c). The dataset of 80,138 70S particles was subjected to 3D refinement to assign angular positions, and particle alignment was turned off during the masked classification scheme. Three types of classes were obtained. The first type of classes encompasses 44% of the particles with density for IF2 and tRNA in the P/I position, and the second type of classes encompasses 48% with density for tRNA in the P/P position. The third type of classes encompasses ~8% without any density in the masked region. The 3D refinement of the first, second and third types of classes yielded cryo-EM maps of 70S IC, 70S EC and low-resolution 70S EC, respectively (Extended Figure 4d).
Modeling of the 30S IC, 70S IC, and 70S EC structures
We obtained near-atomic resolution models of the 30S IC and 70S IC by employing the Molecular Dynamics Flexible Fitting (MDFF) method29 (Extended Figure 9) and using an atomic, cryo-EM-derived model of a 70S IC (PDB ID: 3JCJ) as the initial starting model. Similarly, we obtained an initial, near-atomic resolution model of the 70S EC using rigid-body fitting within the UCSF Chimera software program43 and atomic-resolution models of 70S ribosomes in the non-rotated inter-subunit orientation and lacking any tRNA or mRNA ligands (PDB IDs: 2AVY and 2AW4). This initial, near-atomic-resolution model of the 70S EC was further refined by subjecting it to the ‘jiggle fit’ algorithm within the COOT software program44 to obtain the final atomic coordinates.
DATA AVAILABILITY
The cryo-EM reconstruction maps were deposited in the EMDB server under the accession codes EMD-0643 (30S IC), EMD-0662 (70S IC), and EMD-0661 (70S EC). The structural models obtained by MDFF were deposited in the PDB server under accession codes 6O7K (30S IC) and 6O9K (70S IC). The structural model obtained by rigid-body fitting was deposited in the PDB server under accession code 6O9J (70S EC).
CODE AVAILABILITY
A pseudocode describing the control actions of the software synchronizing TR cryo-EM apparatus will be made available upon request.
Extended Data
Extended Figure 1.
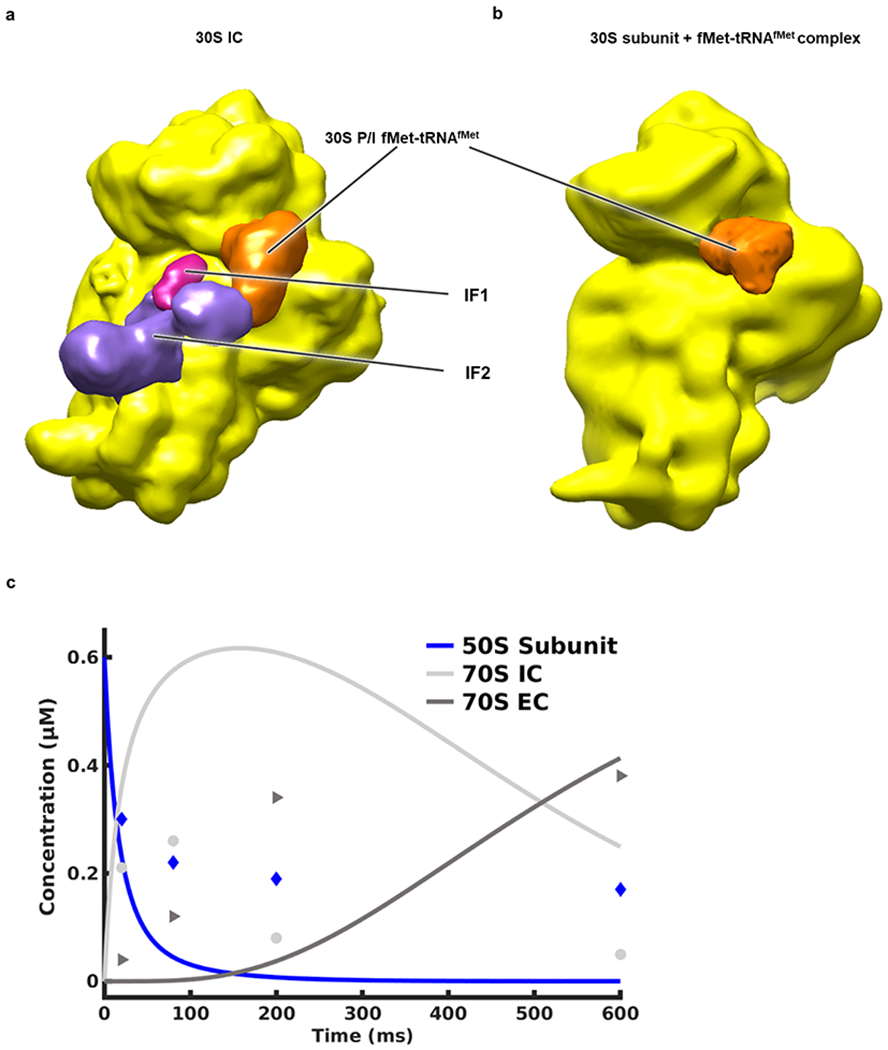
Cryo-EM reconstructions (i.e., 3D cryo-EM-derived Coulomb potential maps30) of the (a) 30S IC and (b) 30S subunit + fMet-tRNAfMet complex obtained from a control experiment in which the 30S IC in Tris-Polymix Buffer and a solution of Tris-Polymix Buffer lacking 50S subunits were injected into the microfluidic chip designed to give the longest reaction time (~600 ms), mixed, allowed to react, and sprayed onto an EM grid that was rapidly plunged into liquid ethane. The sizes of the resulting populations of the 30S IC and 30S subunit + fMet-tRNAfMet complex were 75% and 25%, respectively, demonstrating that the majority of the 30S ICs remain intact during the mixing-spraying process. (c) Plot of the concentrations of the 50S subunit, 70S IC, and 70S EC as a function of time generated by using initial 50S subunit and 30S IC concentrations analogous to those used in our mixing-spraying microfluidic chip (i.e., 0.6 μM and 1.2 μM, respectively) and modeling the kinetics of subunit joining using the kinetic scheme and set of rate constants reported by Goyal and coworkers for a subunit joining reaction performed in the presence of IF1 and IF2, but in absence of the IF319. A detailed description of the kinetic modeling can be found in the Methods. The plot predicts that the 70S IC population should peak within 50–250 ms after mixing of the 50S subunit and 30S IC and that these 70S ICs should mature to a significant population of 70S ECs within the next several hundreds of ms. Therefore, to ensure that we would capture formation of the 70S IC and its maturation to the 70S EC, we selected microfluidic chips designed to provide reaction times of ~20 ms, ~80 ms, ~200 ms, and ~600 ms. The free 50S subunit, 70S IC, and 70S EC populations observed in our TR cryo-EM experiments are shown as blue diamonds, light grey circles, and dark grey triangles, respectively.
Extended Figure 2.

(a) A photograph of the mixing-spraying, TR cryo-EM apparatus, labeled to show all major components. The mixing-spraying microfluidic chip is mounted inside an environmentally controlled chamber. A syringe pump, which is controlled by a laboratory-written, Visual Basic and C++ software program called Howard5e46, is used to inject the reactants from inlets 1 and 2 into the microfluidic chip. Once in the microfluidic chip, the reactants are mixed and allowed to react for the reaction time specific to the microfluidic chip being used. The EM grid is held at the end of the plunger by a pair of tweezers. The Howard5e software controls and synchronizes the syringe pump as well as the plunger that holds the tweezer-mounted EM grid46. Thus, as the sprayers discharge the reaction from the microfluidic chip onto the EM grid, the plunger is activated to plunge the EM grid into cryogen46. (b-f) Images of cryo-EM grids prepared by the mixing-spraying, TR cryo-EM apparatus, going from low to high magnification. (b) Grid-view depicting droplets of different sizes deposited on the grid. (c) Square-view depicting droplet distribution over the holes. (d) Hole-view depicting ice distribution over holes. For image acquisition, thin ice regions were selected. (e) A representative micrograph showing good particle density. (f) Power spectrum of the acquisition image of panel e.
Extended Figure 3.
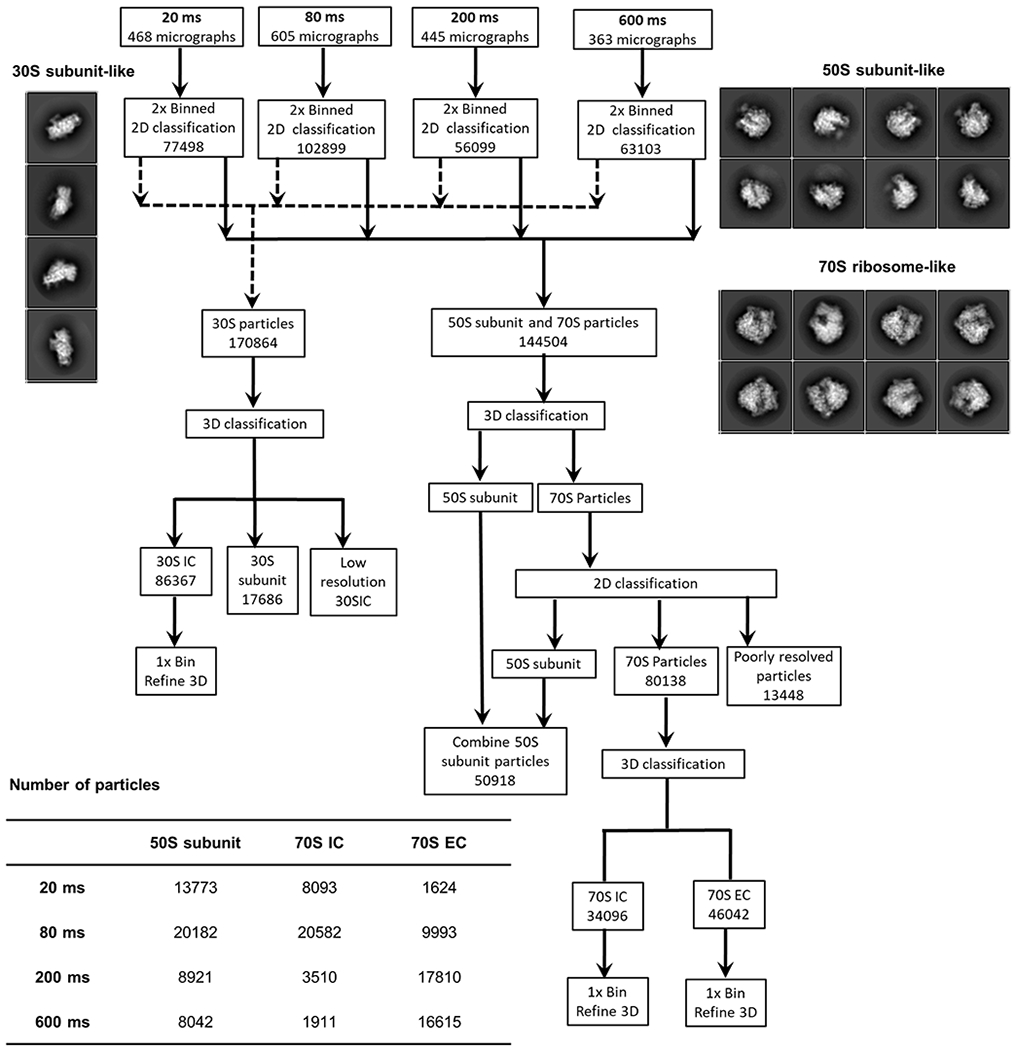
Flow-chart of the work process for single-particle analysis and 3D refinement. In the first step, particles were auto-picked from the images recorded for the individual time points. Auto-picked particles were then extracted using 2× binning of the images and subjected to 2D classification to discard ice-like and/or debris-like particles and define 30S subunit-like, 50S subunit-like, and 70S ribosome-like particle classes. Representative 2D classes of 30S subunit-like, 50S subunit-like, and 70S ribosome-like particles are shown on the left- and right-hand sides of the flow chart. A detailed account of the classification scheme is presented in the subsection of cryo-EM data processing in the Methods section. Briefly, following 2D classification at each time point, two particle datasets were created. The first particle dataset was composed of 170,864 30S subunit-like projections and the second particle dataset was composed of 144,504 50S subunit-like and 70S ribosome-like projections. The first particle dataset with 170,864 30S subunit-like projection classes was subjected to 3D classification, which yielded two major subclasses. The first of these major subclasses contained 86,367 30S ICs and the second contained 17,686 30S subunits carrying only fMet-tRNAfMet (i.e., 30S subunit + fMet-tRNAfMet complexes). The second particle dataset, containing the 144,504 50S subunit-like and 70S ribosome-like particles, was also subjected to a combination of 3D classification and 2D classification to separate compositional heterogeneity consisting of 50S subunit ribosome and 70S ribosome. After performing a combination of 3D classification and 2D classification, two particle datasets were created, the first containing 50,918 50S subunit particles and the second containing 80,138 70S ribosome–like particles. Further 3D classification was performed on the dataset containing 80,138 70S ribosome-like particles which yielded 70S IC and 70S EC classes. Particles from 50S subunit, 70S IC and 70S EC were traced back to each time point, as tabulated at the bottom of the flow chart.
Extended Figure 4.

Masked classification scheme to look for rare conformations of the 70S IC and 70S EC. (a-c) The mask (grey) covering densities of IF1 (magenta), IF2 (purple), P/P-tRNA (orange) and P/E-tRNA is shown in different views. The views depict the position of the mask with respect to the 30S subunit (pale yellow) and the 50S subunit (blue). For the masked 3D classification scheme, this mask was applied to the dataset of refined 80,138 70S particles, which yielded mostly 3 types of classes (d). The first type of classes encompasses 44% of the particles with density for IF2 (purple) and tRNA in the P/I position (green), the second type of classes encompasses 48% with density for tRNA in the P/P position (orange), and the third type of classes encompasses ~8% without any density in the masked region. The 3D refinement of the first, second and third types of classes yielded cryo-EM maps of 70S IC, 70S EC and low-resolution 70S EC, respectively.
Extended Figure 5.
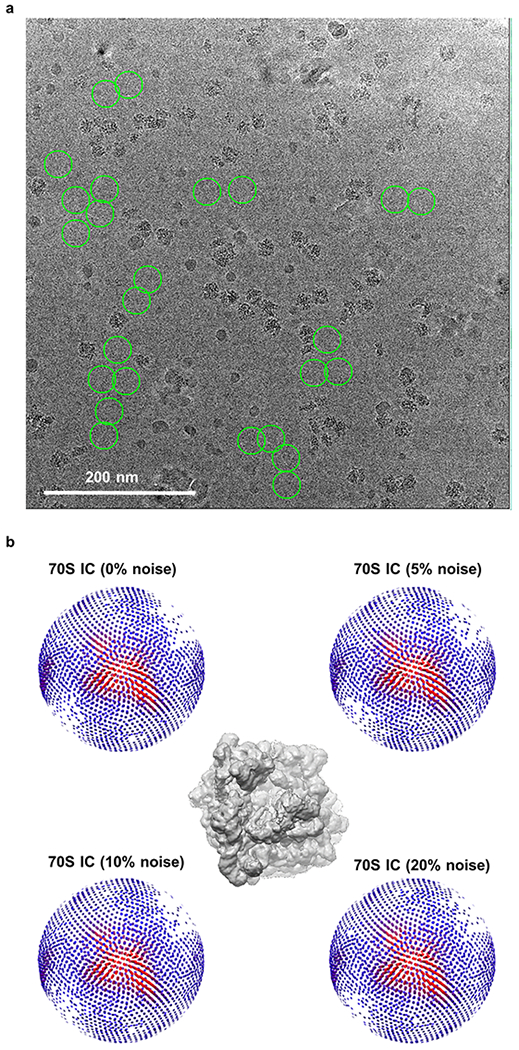
(a) Noise particles selected from the gain-corrected micrograph. The noise particles which did not exhibit any ribosome particle-like features were selected from the background (green circles). (b) The angular coverage of the 70S IC with respect to the view depicted in the center panel, as a function of the level of added noise.
Extended Figure 6.
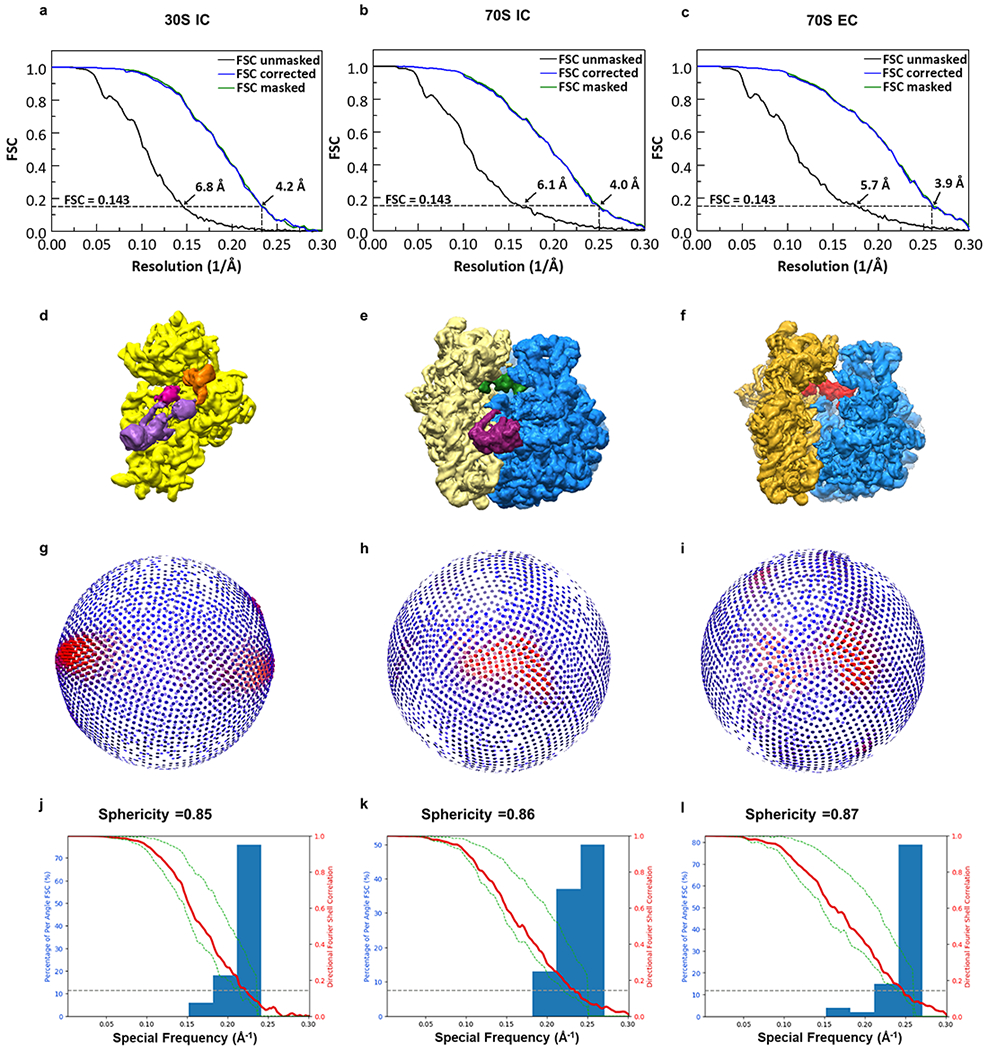
Fourier shell curves for (a) 30S IC, (b) 70S IC, and (c) 70S EC. The resolutions of these structures were estimated using a resolution-estimating protocol that avoids overfitting and uses the Fourier shell correlation (FSC) with the 0.143 criterion28. Cryo-EM reconstructions of (d) 30S IC, (e) 70S IC, and (f) 70S EC. Angular orientation coverage of (g) 30S IC, (h) 70S IC, and (i) 70S EC, presented corresponding to the views depicted in d, e, and f, respectively. Directional FSC plots47 of the cryo-EM reconstructions of (j) 30S IC, (k) 70S IC, and (l) 70S EC.
Extended Figure 7.

IF2–70S ribosome interactions in the 70S IC. (a) The positions of IF2 (dark purple), 70S P/I fMet-tRNAfMet (green), uS12 (yellow), and H69, H71, H80, H89 and H95 (SRL) (all shown in blue) within the cryo-EM reconstruction of the 70S IC (transparent grey) were obtained using MDFF. (b) A magnified view of the structure shown in (a) highlighting the interactions IF2 makes with the 70S ribosome in the 70S IC.
Extended Figure 8.
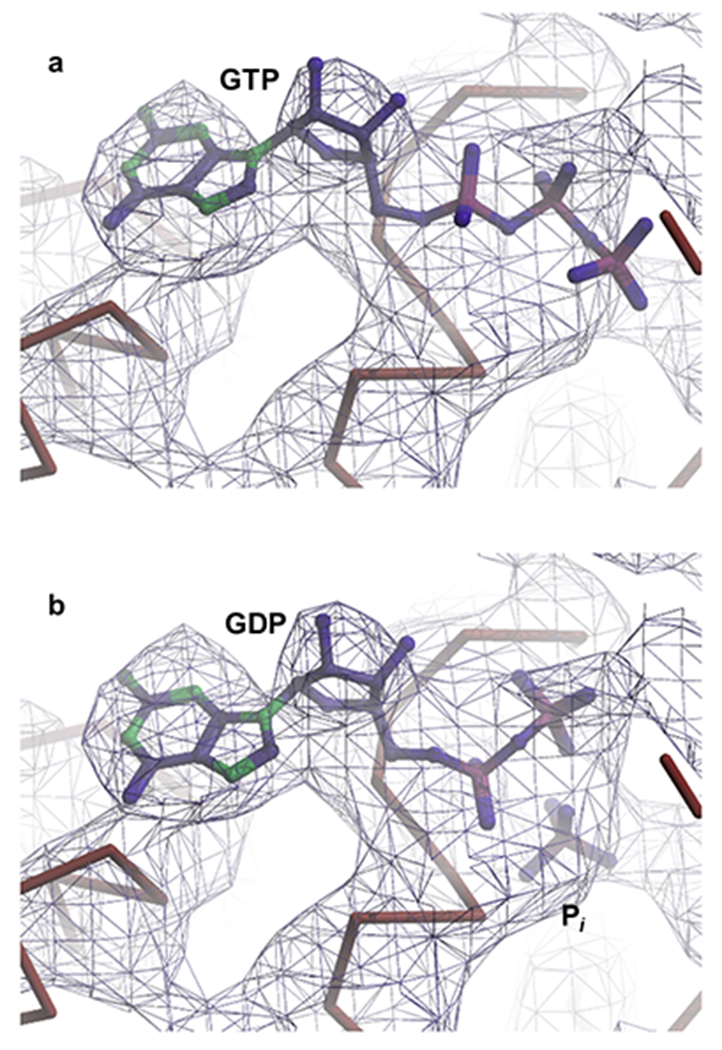
Portion of the Coulomb potential corresponding to the guanosine as obtained from the 4 Å resolution, cryo-EM reconstruction of the 70S IC (shown as a blue mesh). Rigid-body fitting was used to position either (a) GTP or (b) GDP•Pi into the Coulomb potential. The initial position of Pi relative to GDP for the rigid body fitting was taken from the structure of the GDP•Pi-form of the G protein Giα1 (PDB ID: 1AS2)48.
Extended Figure 9.
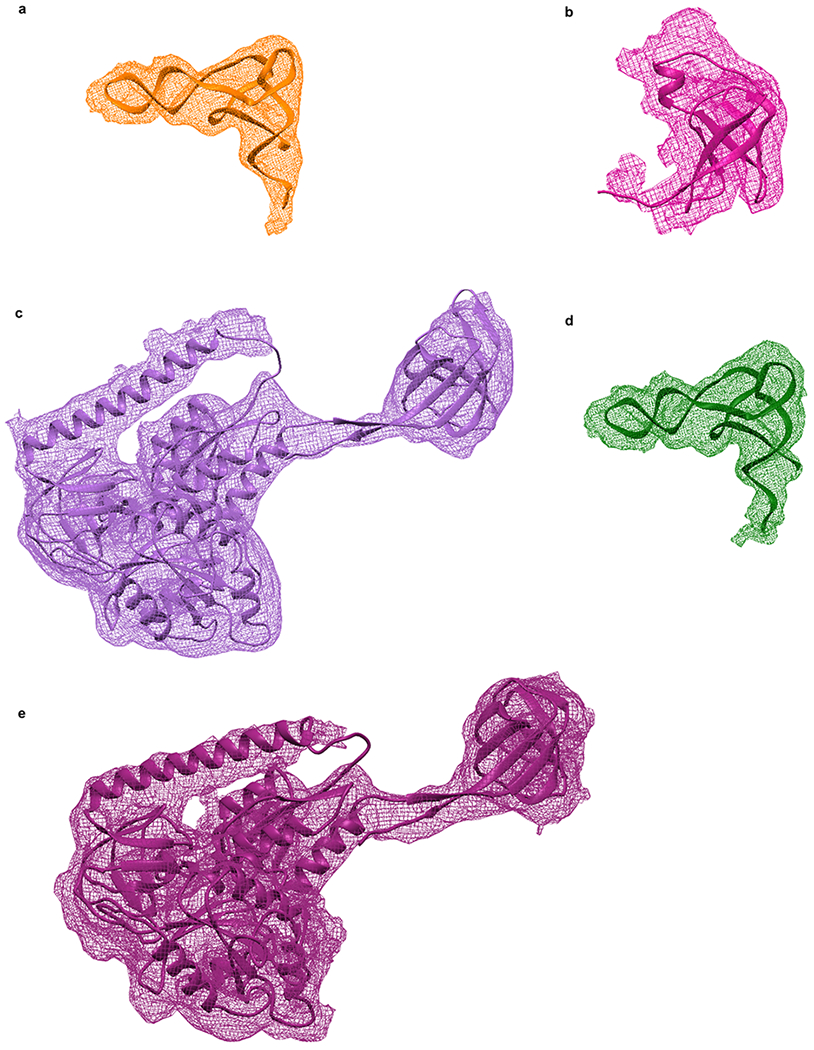
Views of the major components of the 30S IC and 70S IC after structural modeling of the 30S IC and 70S IC using the MDFF method. (a) fMet-tRNAfMet (orange) in its 30S P/I configuration in the 30S IC. (b) IF1 (magenta) in the 30S IC. (c) IF2 (light purple) in the 30S IC. (d) fMet-tRNAfMet (green) in its 70S P/I configuration in the 70S IC. (e) IF2 (dark purple) in the 70S IC. For each component, the reconstructed Coulomb potential is represented by the mesh and the structural model is represented by secondary structure cartoons.
Supplementary Material
ACKNOWLEDGEMENTS
This work was supported by funds to J.F. from the National Institutes of Health (R01 GM 55440 and GM 29169) and to R.L.G. from the National Institutes of Health (R01 GM 084288). K.C. was supported by an American Cancer Society Postdoctoral Fellowship (125201).
Footnotes
COMPETING FINANCIAL INTERESTS
The authors declare no conflicts of interest.
REFERENCES
- 1.Antoun A, Pavlov MY, Andersson K, Tenson T & Ehrenberg M The roles of initiation factor 2 and guanosine triphosphate in initiation of protein synthesis. Embo J 22, 5593–5601 (2003). [DOI] [PMC free article] [PubMed] [Google Scholar]
- 2.Hussain T, Llacer JL, Wimberly BT, Kieft JS & Ramakrishnan V Large-Scale Movements of IF3 and tRNA during Bacterial Translation Initiation. Cell 167, 133-+ (2016). [DOI] [PMC free article] [PubMed] [Google Scholar]
- 3.Julian P, Milon P, Agirrezabala X, Lasso G, Gil D, Rodnina MV & Valle M The Cryo-EM Structure of a Complete 30S Translation Initiation Complex from Escherichia coli. Plos Biol 9(2011). [DOI] [PMC free article] [PubMed] [Google Scholar]
- 4.Simonetti A, Marzi S, Billas IML, Tsai A, Fabbretti A, Myasnikov AG, Roblin P, Vaiana AC, Hazemann I, Eiler D, Steitz TA, Puglisi JD, Gualerzi CO & Klaholz BP. Involvement of protein IF2 N domain in ribosomal subunit joining revealed from architecture and function of the full-length initiation factor. P Natl Acad Sci USA 110, 15656–15661 (2013). [DOI] [PMC free article] [PubMed] [Google Scholar]
- 5.Simonetti A, Marzi S, Myasnikov AG, Fabbretti A, Yusupov M, Gualerzi CO & Klaholz BP. Structure of the 30S translation initiation complex. Nature 455, 416–U473 (2008) [DOI] [PubMed] [Google Scholar]
- 6.Allen GS, Zavialov A, Gursky R, Ehrenberg M & Frank J The cryo-EM structure of a translation initiation complex from Escherichia coli. Cell 121, 703–712 (2005). [DOI] [PubMed] [Google Scholar]
- 7.Myasnikov AG, Marzi S, Simonetti A, Giuliodori AM, Gualerzi CO, Yusupova G, Yusupov M & Klaholz BP. Conformational transition of initiation factor 2 from the GTP- to GDP-bound state visualized on the ribosome. Nat Struct Mol Biol 12, 1145–1149 (2005). [DOI] [PubMed] [Google Scholar]
- 8.Sprink T, Ramrath DJF, Yamamoto H, Yamamoto K, Loerke J, Ismer J, Hildebrand PW, Scheerer P, Burger J, Mielke T & Spahn CMT Structures of ribosome-bound initiation factor 2 reveal the mechanism of subunit association. Sci Adv 2(2016). [DOI] [PMC free article] [PubMed] [Google Scholar]
- 9.Frank J Time-resolved cryo-electron microscopy: Recent progress. J Struct Biol 200, 303–306 (2017). [DOI] [PMC free article] [PubMed] [Google Scholar]
- 10.Antoun A, Pavlov MY, Lovmar M & Ehrenberg M How initiation factors maximize the accuracy of tRNA selection in initiation of bacterial protein synthesis. Mol Cell 23, 183–193 (2006). [DOI] [PubMed] [Google Scholar]
- 11.Caban K & Gonzalez RL The emerging role of rectified thermal fluctuations in initiator aa-tRNA- and start codon selection during translation initiation. Biochimie 114, 30–38 (2015). [DOI] [PMC free article] [PubMed] [Google Scholar]
- 12.Milon P, Konevega AL, Gualerzi CO & Rodnina MV Kinetic checkpoint at a late step in translation initiation. Mol Cell 30, 712–720 (2008). [DOI] [PubMed] [Google Scholar]
- 13.Milon P & Rodnina MV Kinetic control of translation initiation in bacteria. Crit Rev Biochem Mol 47, 334–348 (2012). [DOI] [PubMed] [Google Scholar]
- 14.Grigoriadou C, Marzi S, Kirillov S, Gualerzi CO & Cooperman BS A quantitative kinetic scheme for 70 S translation initiation complex formation. J Mol Biol 373, 562–572 (2007). [DOI] [PMC free article] [PubMed] [Google Scholar]
- 15.MacDougall DD & Gonzalez RL Translation Initiation Factor 3 Regulates Switching between Different Modes of Ribosomal Subunit Joining. J Mol Biol 427, 1801–1818 (2015). [DOI] [PMC free article] [PubMed] [Google Scholar]
- 16.Gualerzi CO & Pon CL Initiation of mRNA translation in bacteria: structural and dynamic aspects. Cell Mol Life Sci 72, 4341–4367 (2015). [DOI] [PMC free article] [PubMed] [Google Scholar]
- 17.Wilson DN Ribosome-targeting antibiotics and mechanisms of bacterial resistance. Nat Rev Microbiol 12, 35–48 (2014). [DOI] [PubMed] [Google Scholar]
- 18.Lopez-Alonso JP, J P, Fabbretti A, Kaminishi T, Iturrioz I, Brandi L, Gil-Carton D, Gualerzi CO, Fucini P. & Connell SR. Structure of a 30S pre-initiation complex stalled by GE81112 reveals structural parallels in bacterial and eukaryotic protein synthesis initiation pathways. Nucleic Acids Res 45, 2179–2187 (2017). [DOI] [PMC free article] [PubMed] [Google Scholar]
- 19.Goyal A, Belardinelli R, Maracci C, Milon P & Rodnina MV Directional transition from initiation to elongation in bacterial translation. Nucleic Acids Res 43(2015). [DOI] [PMC free article] [PubMed] [Google Scholar]
- 20.Huang CH, Mandava CS & Sanyal S The Ribosomal Stalk Plays a Key Role in IF2-Mediated Association of the Ribosomal Subunits. J Mol Biol 399, 145–153 (2010). [DOI] [PubMed] [Google Scholar]
- 21.Tomsic J, Vitali LA, Daviter T, Savelsbergh A, Spurio R, Striebeck P, Wintermeyer W, Rodnina MV & Gualerzi CO Late events of translation initiation in bacteria: a kinetic analysis. Embo J 19, 2127–2136 (2000) [DOI] [PMC free article] [PubMed] [Google Scholar]
- 22.Ling C & Ermolenko DN Initiation factor 2 stabilizes the ribosome in a semirotated conformation. P Natl Acad Sci USA 112, 15874–15879 (2015). [DOI] [PMC free article] [PubMed] [Google Scholar]
- 23.Marshall RA, Aitken CE & Puglisi JD GTP Hydrolysis by IF2 Guides Progression of the Ribosome into Elongation. Mol Cell 35, 37–47 (2009). [DOI] [PMC free article] [PubMed] [Google Scholar]
- 24.LaTeana A, Pon CL & Gualerzi CO Late events in translation initiation. Adjustment of fMet-tRNA in the ribosomal P-site. J Mol Biol 256, 667–675 (1996). [DOI] [PubMed] [Google Scholar]
- 25.Chen B, Kaledhonkar S, Sun M, Shen BX, Lu ZH, Barnard D, Lu TM, Gonzalez RL & Frank J Structural Dynamics of Ribosome Subunit Association Studied by Mixing-Spraying Time-Resolved Cryogenic Electron Microscopy. Structure 23, 1097–1105 (2015). [DOI] [PMC free article] [PubMed] [Google Scholar]
- 26.Fu Z, Kaledhonkar S, Borg A, Sun M, Chen B, Grassucci RA, Ehrenberg M & Frank J Key Intermediates in Ribosome Recycling Visualized by Time-Resolved Cryoelectron Microscopy. Structure 24, 2092–2101 (2016). [DOI] [PMC free article] [PubMed] [Google Scholar]
- 27.Lu Z, T R., Barnard D, Meng X, Mohamed H, Yassin A, Mannella CA, Agrawal RK, Lu TM. & Wagenknecht T. Monolithic microfluidic mixing-spraying devices for time-resolved cryo-electron microscopy. J Struct Biol 168, 388–395 (2009). [DOI] [PMC free article] [PubMed] [Google Scholar]
- 28.Chen SX, McMullan G, Faruqi AR, Murshudov GN, Short JM, Scheres SHW & Henderson R High-resolution noise substitution to measure overfitting and validate resolution in 3D structure determination by single particle electron cryomicroscopy. Ultramicroscopy 135, 24–35 (2013). [DOI] [PMC free article] [PubMed] [Google Scholar]
- 29.Trabuco LG, Villa E, Mitra K, Frank J & Schulten K Flexible fitting of atomic structures into electron microscopy maps using molecular dynamics. Structure 16, 673–683 (2008). [DOI] [PMC free article] [PubMed] [Google Scholar]
- 30.Wang J, Liu Z, Frank J & Moore PB Identification of ions in experimental electrostatic potential maps. IUCrJ 5, 375–381 (2018). [DOI] [PMC free article] [PubMed] [Google Scholar]
- 31.Caban K, Pavlov M, Ehrenberg M & Gonzalez RL A conformational switch in initiation factor 2 controls the fidelity of translation initiation in bacteria. Nat Commun 8(2017). [DOI] [PMC free article] [PubMed] [Google Scholar]
- 32.Fei JY, Wang JN, Sternberg SH, MacDougall DD, Elvekrog MM, Pulukkunat DK, Englander MT & Gonzalez RL A Highly Purified, Fluorescently Labeled in Vitro Translation System for Single-Molecule Studies of Protein Synthesis. Method Enzymol 472, 221–259 (2010). [DOI] [PMC free article] [PubMed] [Google Scholar]
- 33.Wang J, Caban K & Gonzalez RL Jr. Ribosomal initiation complex-driven changes in the stability and dynamics of initiation factor 2 regulate the fidelity of translation initiation. J Mol Biol 427, 1819–1834 (2015). [DOI] [PMC free article] [PubMed] [Google Scholar]
- 34.Elvekrog MM & Gonzalez RL Jr. Conformational selection of translation initiation factor 3 signals proper substrate selection. Nat Struct Mol Biol 20, 628–633 (2013). [DOI] [PMC free article] [PubMed] [Google Scholar]
- 35.Guenneugues M, Caserta E, Brandi L, Spurio R, Meunier S, Pon CL, Boelens R & Gualerzi CO Mapping the fMet-tRNA(f)(Met) binding site of initiation factor IF2. Embo J 19, 5233–5240 (2000). [DOI] [PMC free article] [PubMed] [Google Scholar]
- 36.Antoun A, Pavlov MY, Lovmar M & Ehrenberg M How initiation factors tune the rate of initiation of protein synthesis in bacteria. Embo J 25, 2539–2550 (2006). [DOI] [PMC free article] [PubMed] [Google Scholar]
- 37.Grigoriadou C, Marzi S, Pan D, Gualerzi CO & Cooperman BS The translational fidelity function of IF3 during transition from the 30 S initiation complex to the 70 S initiation complex. J Mol Biol 373, 551–561 (2007). [DOI] [PMC free article] [PubMed] [Google Scholar]
- 38.Fabbretti A, Pon CL, Hennelly SP, Hill WE, Lodmell JS & Gualerzi CO The real-time path of translation factor IF3 onto and off the ribosome. Mol Cell 25, 285–296 (2007). [DOI] [PubMed] [Google Scholar]
- 39.Russo CJ & Passmore LA Ultrastable gold substrates for electron cryomicroscopy. Science 346, 1377–1380 (2014). [DOI] [PMC free article] [PubMed] [Google Scholar]
- 40.Zheng SQ, Palovcak E, Armache JP, Verba KA, Cheng YF & Agard DA MotionCor2: anisotropic correction of beam-induced motion for improved cryo-electron microscopy. Nat Methods 14, 331–332 (2017). [DOI] [PMC free article] [PubMed] [Google Scholar]
- 41.Rohou A & Grigorieff N CTFFIND4: Fast and accurate defocus estimation from electron micrographs. J Struct Biol 192, 216–221 (2015). [DOI] [PMC free article] [PubMed] [Google Scholar]
- 42.Scheres SHW RELION: Implementation of a Bayesian approach to cryo-EM structure determination. J Struct Biol 180, 519–530 (2012). [DOI] [PMC free article] [PubMed] [Google Scholar]
- 43.Pettersen EF, Goddard TD, Huang CC, Couch GS, Greenblatt DM, Meng EC & Ferrin TE UCSF chimera - A visualization system for exploratory research and analysis. J Comput Chem 25, 1605–1612 (2004). [DOI] [PubMed] [Google Scholar]
- 44.Emsley P & Cowtan K Coot: model-building tools for molecular graphics. Acta Crystallogr D 60, 2126–2132 (2004). [DOI] [PubMed] [Google Scholar]
- 45.Hite RK & MacKinnon R Structural Titration of Slo2.2, a Na+-Dependent K+ Channel. Cell 168, 390-+ (2017). [DOI] [PMC free article] [PubMed] [Google Scholar]
- 46.Kaledhonkar S, Fu Z, White H & Frank J Time-Resolved Cryo-electron Microscopy Using a Microfluidic Chip in Protein Complex Assembly: Methods and Protocols (ed. Marsh JA) 59–71 (Springer; New York, New York, NY, 2018). [DOI] [PubMed] [Google Scholar]
- 47.Tan YZ, Baldwin PR, Davis JH, Williamson JR, Potter CS, Carragher B & Lyumkis D. Addressing preferred specimen orientation in single-particle cryo-EM through tilting. Nat Methods 14, 793-+ (2017). [DOI] [PMC free article] [PubMed] [Google Scholar]
- 48.Raw AS, Coleman DE, Gilman AG & Sprang SR Structural and biochemical characterization of the GTPgammaS-, GDP.Pi-, and GDP-bound forms of a GTPase-deficient Gly42 --> Val mutant of Gialpha1. Biochemistry 36, 15660–15669 (1997). [DOI] [PubMed] [Google Scholar]
Associated Data
This section collects any data citations, data availability statements, or supplementary materials included in this article.
Supplementary Materials
Data Availability Statement
The cryo-EM reconstruction maps were deposited in the EMDB server under the accession codes EMD-0643 (30S IC), EMD-0662 (70S IC), and EMD-0661 (70S EC). The structural models obtained by MDFF were deposited in the PDB server under accession codes 6O7K (30S IC) and 6O9K (70S IC). The structural model obtained by rigid-body fitting was deposited in the PDB server under accession code 6O9J (70S EC).