

Abstract
Quantitative gene expression profiling of cardiac allografts characterizes the phenotype of the alloimmune response, yields information regarding differential effects that may be associated with various anti-rejection drug regimens, and generates testable hypotheses regarding the pathogenesis of the chronic rejection lesions typically observed in nonhuman primate heart transplant models. The goal of this study was to assess interplatform performance and variability between the relatively novel NanoString nCounter Analysis System, ΔΔCT (relative) RT-qPCR, and standard curve (absolute) RT-qPCR utilizing cynomolgus monkey cardiac allografts. Methods for RNA isolation and preamplification were also systematically evaluated and effective methods are proposed. In this study, we demonstrate strong correlation between the two RT-qPCR methods, but variable and, at times, weak correlation between RT-qPCR and NanoString. NanoString fold change results demonstrate less sensitivity to small changes in gene expression than RT-qPCR. These findings appear to be driven by technical aspects of each platform that influence the conditions under which each technique is ideal. Collectively, our data contribute to the general effort to optimally utilize gene expression profiling techniques, not only for transplanted tissues, but for many other applications where accurate rank-order of gene expression versus precise quantification of absolute gene transcript number may be relatively valuable.
1. Introduction
Chronic organ transplant rejection (CR) is a clinically significant issue to the field of transplantation. In cardiac allografts, chronic rejection, manifesting as vascular injury and termed cardiac allograft vasculopathy (CAV), has been associated with T cell mediated immunity and with elaboration by B-cells of donor-specific human leukocyte antigen (HLA) antibodies and autoantibodies.1–6 Gene expression analysis in transplanted tissue reflects the presence of the cellular infiltrate, and in doing so has provided a wealth of information about the cellular and molecular changes in the graft occurring over time post-transplant, and in association with graft failure.7–18 In our research, we use an intra-abdominal heterotopic heart allograft model in cynomolgus monkeys (Macaca fascicularis) to model CR. Through this model, we obtained scheduled periodic collections of cardiac allotransplant tissues, allowing for RNA isolation and subsequent gene expression analysis, as reported previously.3,19,20 However, platforms for gene expression analysis and profiling vary greatly in ease of use, number of genes measured per assay, and reproducibility.
Gene profiling techniques range from low-throughput to high-throughput with known associated sensitivity and threshold as well as variation in obtained results when platforms are compared. Several efforts have been reported in transplant models seeking to optimize semi-quantitative gene profiling through evaluation and standardization of tissue processing and gene expression measurement methods.18,21,22 We became particularly interested in evaluating the relative precision of the novel NanoString n-Counter analysis platform for measuring the expression of genes we have previously quantified using single-gene or small-scale multiplexed methods.3,7,19,23,24 NanoString allows for analysis of hundreds of gene transcripts in a large number of samples more rapidly and efficiently than RT-qPCR by taking advantage of unique color-coded reporter probes.25,26 The accuracy of this platform, relative to other gene profiling techniques, has not previously been reported for cardiac allograft tissues. Rather, transplant focused NanoString studies have addressed other tissues of interest.22,27–30
Here, in an effort to establish and streamline methods for tissue processing and gene profiling in cynomolgus monkey cardiac allografts, we investigated the NanoString n-Counter analysis platform and compared it to traditional ΔΔCT RT-qPCR (relative), and standard curve RT-qPCR (absolute). The purpose of this study was not only to evaluate the comparability of results obtained using these three methods but also the ease of workflow and efficient generation of results. We selected 8 genes mechanistically linked to the CR process in prior studies that were expected to be modulated in the research samples under study, compared to normal monkey heart samples.3,7,12–15,23 Genes were selected to quantify T cell immune signatures (Th1, Th2, TFH, Treg). Prior NanoString comparison studies have been conducted, and shown variable results for correlation to both RT-qPCR and OpenArray Assays.31–34 Here we present the first comparative analysis of ΔΔCT RT-qPCR, standard curve RT-qPCR, and NanoString using cynomolgus cardiac allografts. In addition, we evaluate various methods for RNA isolation and describe the effects of preamplification on basic gene profiling results in cardiac explants and biopsies.
2. Methods
2.1. Reagents and Samples
Samples were obtained from cynomolgus monkeys (Macaca fascicularis) according to IACUC protocols. All recipient animals underwent intra-abdominal heterotopic cardiac allotransplantation. Grafts were explanted at the point of declining function, as detected by telemetric monitoring (and usually before progressing to cessation of contractility, or complete graft failure); small pieces of graft myocardium were rapidly snap-frozen in liquid nitrogen and stored at −80°C until use. Normal cardiac tissue (n=4) was obtained from naïve donor cynomolgus monkeys.
2.2. RNA Isolation
Total RNA was isolated from 20–25 mg pieces of snap-frozen left ventricle explant tissue by three different methods. The first method was a standard laboratory-based chloroform extraction, where explant tissue was homogenized in 1mL of TRIzol® reagent (Thermo Fisher Scientific). 200μl of chloroform was added and samples were vortexed vigorously. Samples were subsequently centrifuged 12,000xg for 15 minutes at 4°C. The upper aqueous phase was collected and transferred to a new tube for alcohol precipitation with 100% ethanol. The subsequent RNA/ethanol solution was centrifuged at 12,000xg for 20 minutes at 4°C. The RNA pellet was resuspended in RNase free water. The final RNA product was subjected to the RNeasy® MinElute Cleanup Kit to remove residual genomic DNA contamination (Qiagen). The second method was the RNeasy® Fibrous Tissue Mini Kit (‘Fibrous kit’), and the third was the Rneasy® Plus Universal Mini Kit, carried out according to the manufacturer’s instructions (Qiagen).
Total RNA used in all RT-qPCR and NanoString assays was obtained using the Rneasy® Plus Universal Mini Kit. RNA was assessed for purity and integrity by capillary electrophoresis using the Agilent Bioanalyzer at the University of Maryland School of Medicine Genomics Core Facility. RNA quantification for each sample was assessed using both the Agilent Bioanalyzer and Nanodrop 2000 (Thermo Fisher Scientific).
For small core or excisional tissue biopsies, estimated to weigh <5mg each, total RNA was isolated using the RNeasy® Plus Micro Kit according to the manufacturer’s instruction (Qiagen).
2.3. Reverse Transcription and Preamplification
For assessment of amplification’s effect on the reproducibility of ΔΔCT RT-qPCR results, 50ng of total RNA was preamplified and reverse transcribed to a double stranded cDNA product using the Ovation RNA-Seq System V2 according to the manufacturer’s instructions (NuGEN Technologies Inc.). For all NanoString/RT-qPCR assay comparison experiments, 1μg of RNA was reverse transcribed into cDNA using SuperScript VILO Master Mix according to the manufacturer’s instructions (Thermo Fisher Scientific).
2.4. RT-qPCR
Real-time PCR assays were performed on the ABI Prism 7900 (Applied Biosystems) as described by Kelishadi et al.3 Instruments and amplification conditions are summarized in Table S1. The primers and probes were inventoried Taqman assays (Table S2), with the exception of FOXP3 which was an individual primer and probe set (Table S3). PCR reactions were run in duplicate wells, with each reaction containing 50 ng of cDNA. HPRT1 was used as housekeeping gene. Run data were analyzed with automatic baseline and threshold settings determined by the ABI7900 PRISM software. For relative expression, each gene was normalized to HPRT1 using the ΔΔCT calculation. mRNA levels were finally expressed as relative fold increase over normal monkey heart (average of 4 individual normal native heart tissue samples). log2 calculations of this fold increase were used to compare RT-qPCR to NanoString.
2.5. FRZ1 PCR Standard
Absolute quantities of test genes were derived from a calibration curve using an amplicon of the mouse FZR1 gene (NCBI accession #NM_019757.1), as previously described.21 The primers and probes sequences (Table S3) were as follows: Forward, 5’-CCCTGTCTTCATACCCCATCTC-3’; Reverse, 5’-CAGCCACCACACTGGGAATC-3’; and, Probe, 5’-FAM-CTGCCCCTTGCCTGG-MGB-3’. A stock solution of pooled and purified FZR1 PCR products in TBS was the gift of Dr. Keslar and Dr. Fairchild (Cleveland Clinic). PCR calibration curves were made from 10-fold dilutions of this stock solution. Linear regression was used to calculate slope and intercept for the calibration curve. All accepted calibration curve slopes fell between −3.30 and −3.60 as advised by Dr. Keslar. Linear regression data for representative standard curves from each plate are shown in Table S4.
2.6. NanoString Gene Expression Assay
Gene expression in cardiac allograft biopsies and explants was quantified for a custom codeset (60 inflammatory and immune marker genes as well as 5 Rhesus macaque housekeeping genes and 14 reference genes) using the NanoString platform as previously described.7 200ng of unamplified RNA per sample was processed through the Nanostring nCounter System (NanoString Technologies Inc.) by the Deep Sequencing Core at Johns Hopkins University (Baltimore, MD). Normalization and data analysis of count numbers was carried out with NanoString nSolver® Analysis Software v3.0 based on the geometric mean of positive controls and reference gene HPRT1. Eight negative controls were used for background thresholding with the threshold set to mean +2 standard deviations above the mean of the negative control count. All log2 calculations of fold change were generated by the nSolver® Analysis Software.
2.7. Statistical Evaluation of the Data
Graphpad Prism software was used for all statistical analysis. Mean and standard deviation were calculated for each group of samples. Linear regression analysis was applied to data and linear regression lines were generated. The Pearson’s correlation coefficient, R, was calculated to assess strength of correlation. Student’s t-tests were performed on the fold changes from each platform. p<0.05 was considered statistically significant.
3. Results
3.1. Comparison of RNA Isolation Techniques
To isolate RNA from left ventricle explants for qPCR assays, a proteinase-K based Fibrous kit from Qiagen was used initially. Resulting RNA varied in quality (RNA Integrity Number (RIN)) and quantity (yield in μg/mg). A subset of tissues processed with the Fibrous kit produced free-floating white debris that did not pellet at step 4 of the kit’s published protocol. This debris prevented collection of a clean supernatant and interfered with RNA yield and purity. To improve and standardize RNA isolation, tissues from cardiac explants were subjected to two additional isolation methods: traditional phenol-chloroform extraction coupled with alcohol precipitation of RNA; and Qiagen’s RNeasy® Plus Universal Mini Kit. RNA yield and quality results were compared between the three methods. (Fig.1)
Figure 1: RNA isolation method influences RNA yield and purity in transplanted cynomolgus monkey hearts.

As described in Methods, weighed pieces of tissue from different explanted heterotopic monkey heart allografts were subjected to three isolation methods: RNeasy® Fibrous Tissue Kit, TRIzol® and Chloroform, and the RNeasy® Plus Universal Kit. (A) Yield in μg/mg (left) and RIN (right) for each sample were plotted by isolation method. The horizontal line among each group of data points represents the mean listed in (B). (B) Summary table of performance parameters for each method utilized. Ease is denoted with a +/− scoring system based on time and relative effort needed for completion, with positive values corresponding to shorter time and greater technical ease. Yield and RIN are expressed as mean±SD. gDNA contamination status pertains to whether samples were contaminated with genomic DNA at the end of the protocol. All samples contaminated with gDNA were subjected to column clean up as described in the Methods. (C) Linear regression plot of yield in μg/mg versus RIN values. Pearson’s correlation coefficient was calculated.
Mean RNA yield for the Fibrous kit was 0.68±0.79 μg/mg with the greatest variability among data points and a free-floating debris problem. While the overall mean yield for the chloroform technique was slightly lower (0.55±0.23 μg/mg), there was less variability among individual samples, and no samples were affected by free-floating debris (Fig. 1A). Mean purity, represented by RIN score, was improved (5.4±1.4) with the chloroform method compared to that of the fibrous kit (4.3±3.8). However, the chloroform protocol was time consuming and required RNA clean up on a separate column due to genomic DNA (gDNA) contamination (Fig. 1B).
In an effort to improve workflow, Qiagen’s RNeasy® Plus Universal Mini Kit was tested. This kit was associated with the highest mean RNA yield (1.39±0.78 μg/mg) and the highest mean RIN score (8.2±1.2) of all 3 techniques (Fig. 1A,B). It was also the least time-consuming protocol, and no samples were affected by free-floating debris. Overall, a modest positive correlation (R=.62) was observed between RNA yield (μg/mg) and RIN (Fig. 1C) across all three techniques, demonstrating that if the yield is relatively high, the quality of RNA is generally better.
Table 1 summarizes basic information about the tissue samples subjected to isolation with the RNeasy® Fibrous Tissue Mini Kit. Samples affected by free floating, non-pelleting debris are listed above the bold black line and unaffected samples are listed below it. The presence of non-pelleting debris did not correlate with graft survival time (in days), which exhibited a broad range for both debris-affected and ‘clean’ samples. Affected samples also did not segregate to any particular treatment group. With one exception, all debris-affected samples were associated with high CAV and ISHLT scores, but severe CAV did not consistently associate with debris, or prevent retrieval of high-quality or high-yield RNA from other explants.
Table 1:
Summary table describing the drug treatment regimen, graft survival time, and acute and chronic rejection histological scores at the time of graft explant for all samples evaluated in with the RNeasy® Fibrous Tissue Mini Kit in this study. A bold black line separates the samples with free-floating debris (above) from those without (below).
| Immunomodulatory regimen | Animal ID | Graft survival * | CAV score | ISHLT score | RNA yield μg/mg | RIN |
|---|---|---|---|---|---|---|
| Belatacept | FA99 | 124 | 2.38 | 3 | 0.150 | 1.0 |
| Belatacept | FC6K | 121 | 1.77 | 3 | 0.586 | 5.2 |
| Belatacept | DW5P | 8 | 1.60 | 3 | 0.027 | 1.1 |
| FR104+hu5C8 | MDX45 | 173 | 2.14 | 3 | 0.019 | 0.0 |
| FR104+hu5C8 | FC2V | >83 | .47 | 0.5 | 0.240 | 1.1 |
| FR104lo | DP30 | 164 | 2.71 | 3 | 0.055 | 0.0 |
| FR104lo | DX48 | 57 | 2.56 | 3 | 0.120 | 2.7 |
| FR104lo | FC6J | 80 | 2.67 | 3 | 0.107 | 0.0 |
| No Rx | FA6N | 6 | n/a | 2 | 0.698 | 8.8 |
| No Rx | FC8R | 6 | n/a | 2 | 1.249 | 6.9 |
| Belatacept | FC3B | 123 | 2.33 | 3 | 1.14 | 8.6 |
| FR104 | DV56 | 50 | 2.31 | 3 | 0.69 | 9.2 |
| FR104 | M-C1005 | 178 | 2 | 3 | 2.79 | 7.1 |
| FR104lo | FD32 | 178 | 2.86 | 3 | 1.60 | 9.0 |
Graft survival time represents the day the graft was explanted because of rejection, or removal of a beating graft (Cocoa). Chronic allograft vasculopathy (CAV) scores and International Society of Heart and Lung Transplantation (ISHLT) acute rejection scores are shown for each graft.
3.2. The Effect of Pre-amplification
Endomyocardial biopsies yield limited amounts of RNA which are insufficient for multi-gene analysis by RT-qPCR. Pre-amplification techniques are required to expand the amount of cDNA template available for analysis of these precious samples.35,36 Choices for an amplification system that can produce cDNA useable by both the RT-qPCR and NanoString are limited since the product must be double-stranded. To establish a standard amplification platform, the Ovation RNA-Seq V2 system (NuGEN Technologies) was selected and evaluated for its effect on the reproducibility of ΔCT values in traditional RT-qPCR.
Fold amplification of the final cDNA product was equivalently robust for endomyocardial biopsies and cardiac explants (Fig 2A). Biopsies collected on day 14 had a mean fold amplification of 9.5±2.9 compared to 9.4±1.3 for those collected on day 42, 9.1±2.6 for day 90, 8.9±1.9 for day 150, and 9.8±1.4 for the explant group. While amplification was equivalently robust, NuGEN Technologies advertises at least 5000-fold amplification in their product guide.37 These yields were not observed, and the stock of cDNA obtained was sufficient but two logs lower than expected.
Figure 2: Validation of the Ovation RNA-Seq V2 System method by qPCR analysis.
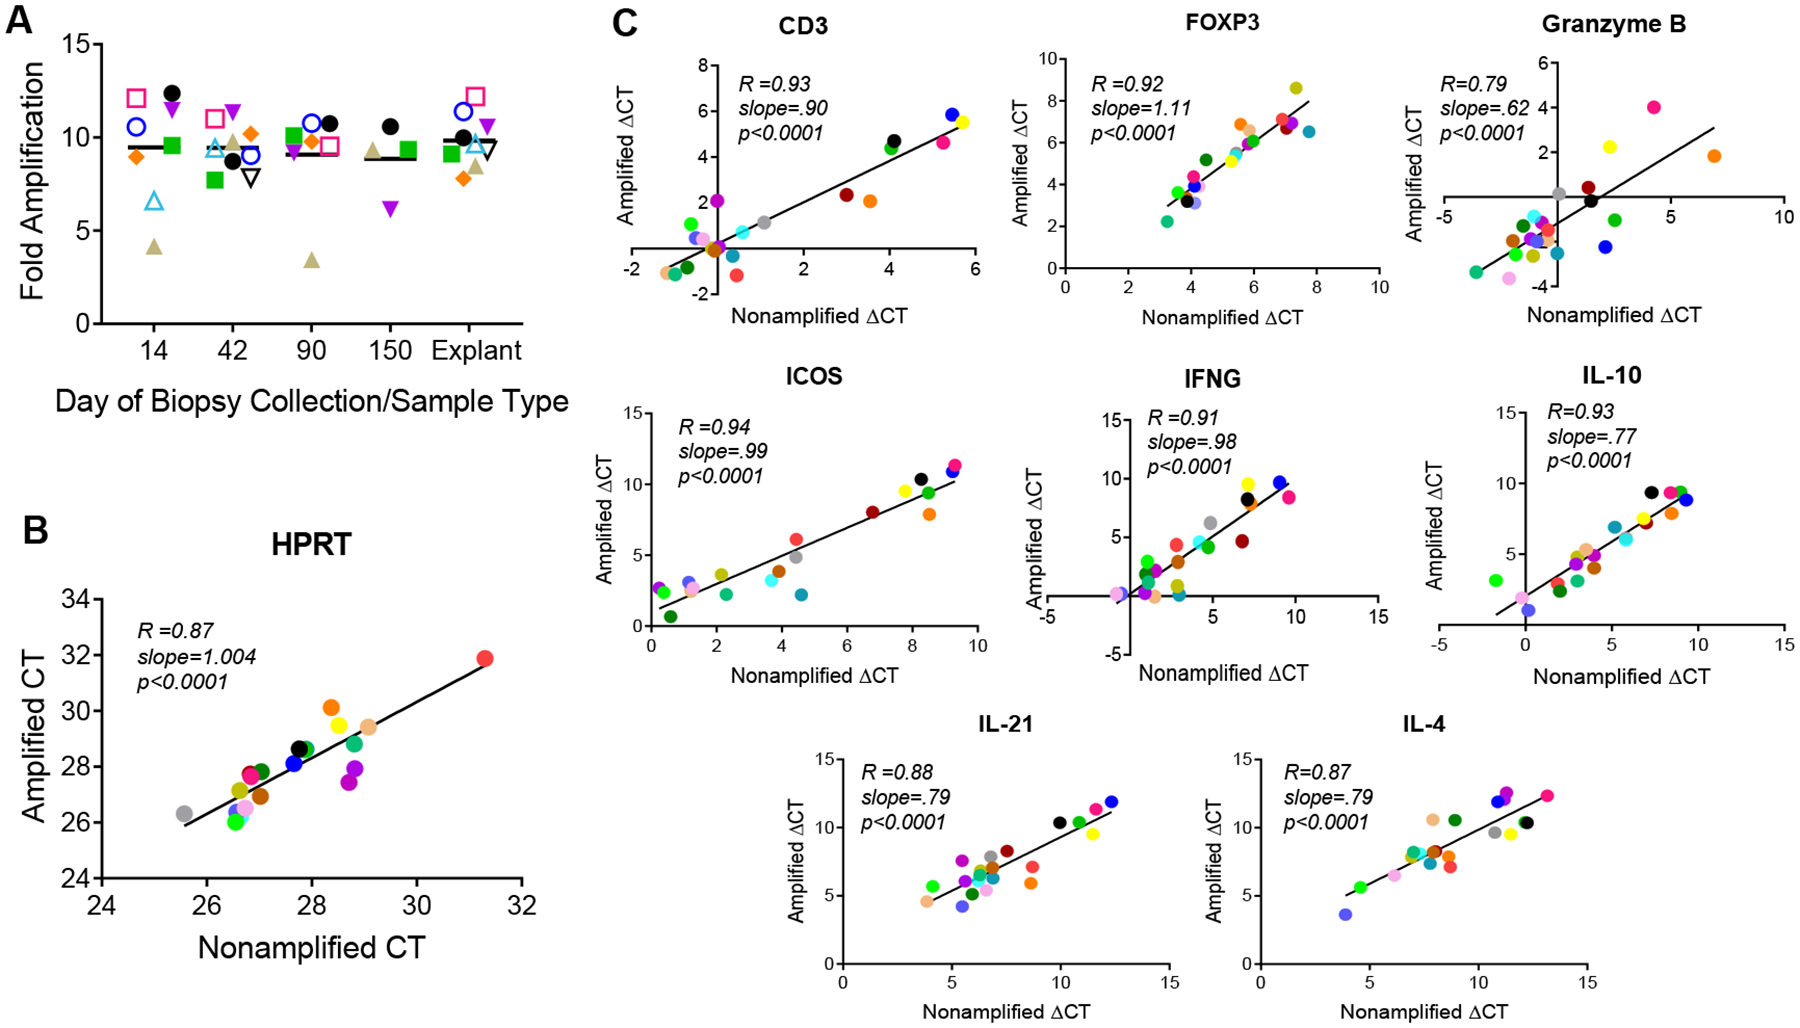
(A) RNA was amplified and converted to cDNA using the Ovation RNA Seq System V2 (NuGEN Technologies). Amount of amplification is expressed as a fold change calculated by dividing the new concentration of cDNA in ng/μl by the initial RNA concentration (ng/μl). Cardiac biopsy samples are separated by day of collection (14, 42, 90, and 150) from explanted tissues. (B) Linear regression plot of RT-qPCR CT values for housekeeping gene HPRT in amplified vs. unamplified samples. (C) Linear regression plots for eight target genes: CD3, FOXP3, Granzyme B, ICOS, IFNG, IL-10, IL-21, and IL-4. ΔCT values for amplified samples were plotted against ΔCT values from the corresponding unamplified samples. Pearson’s correlation coefficients (r) were calculated. Color coding is the same as in Figure 1.
In Figure 2B, RT-qPCR derived CT values from amplified and unamplified explant cDNA were compared for housekeeping gene HPRT. In Figure 2C, RT-qPCR ΔCT values for amplified and unamplified explant cDNA were plotted for eight target genes (CD3, FOXP3, GZMB, ICOS, IFNG, IL-10, IL-21, and IL-4). Linear regression analysis was performed and Pearson’s correlation values were calculated (Fig. 2B–C). There is a strong positive association (R=.87; p-value of <.0001) between amplified and unamplified CT values for HPRT (Fig. 2B). Similarly, for the eight target genes, correlation values (R) ranged from .79 to .94 (p-values <.0001) displaying a strong positive association (Fig. 2C). This demonstrates that RT-qPCR is mildly sensitive to preamplification, but does not introduce a consistent bias for any of the genes measured, since amplification yields no significant effect on the strength of correlation. Due to the limited amount of RNA stock isolated from the tissue biopsies, only explant RNA was used in the forthcoming RT-qPCR platform comparison.
3.3. Comparison of relative quantification (ΔΔCT) with absolute quantification (standard curve) RT-qPCR
To measure interplatform performance and variability, the fold changes (in log2 scale) for eight target genes associated with CR in cardiac allografts were compared across qPCR platforms. For this analysis, the unamplified cDNA used was isolated from explanted heart tissue samples using the RNeasy® Plus Universal Mini Kit. In Figure 3, fold change calculations from the ΔΔCT RT-qPCR method (relative) were plotted against fold change calculations from a standard curve applied RT-qPCR method (absolute). Strong positive correlation was observed between the relative and absolute quantification qPCR methods for all eight genes, with correlation values (R) ranging from 0.78 to 0.99 (p-values≤0.0012). Paired Student’s t-tests were performed using the fold changes for each gene to analyze the difference in detection (Table 2). All p-values were nonsignificant, supporting the conclusion that the ΔΔCT and standard curve-based variations of RT-qPCR generate highly similar results.
Figure 3: Linear regression model comparing fold change of target genes assessed by ΔΔCT (relative) RT-qPCR and standard curve (absolute) RT-qPCR.
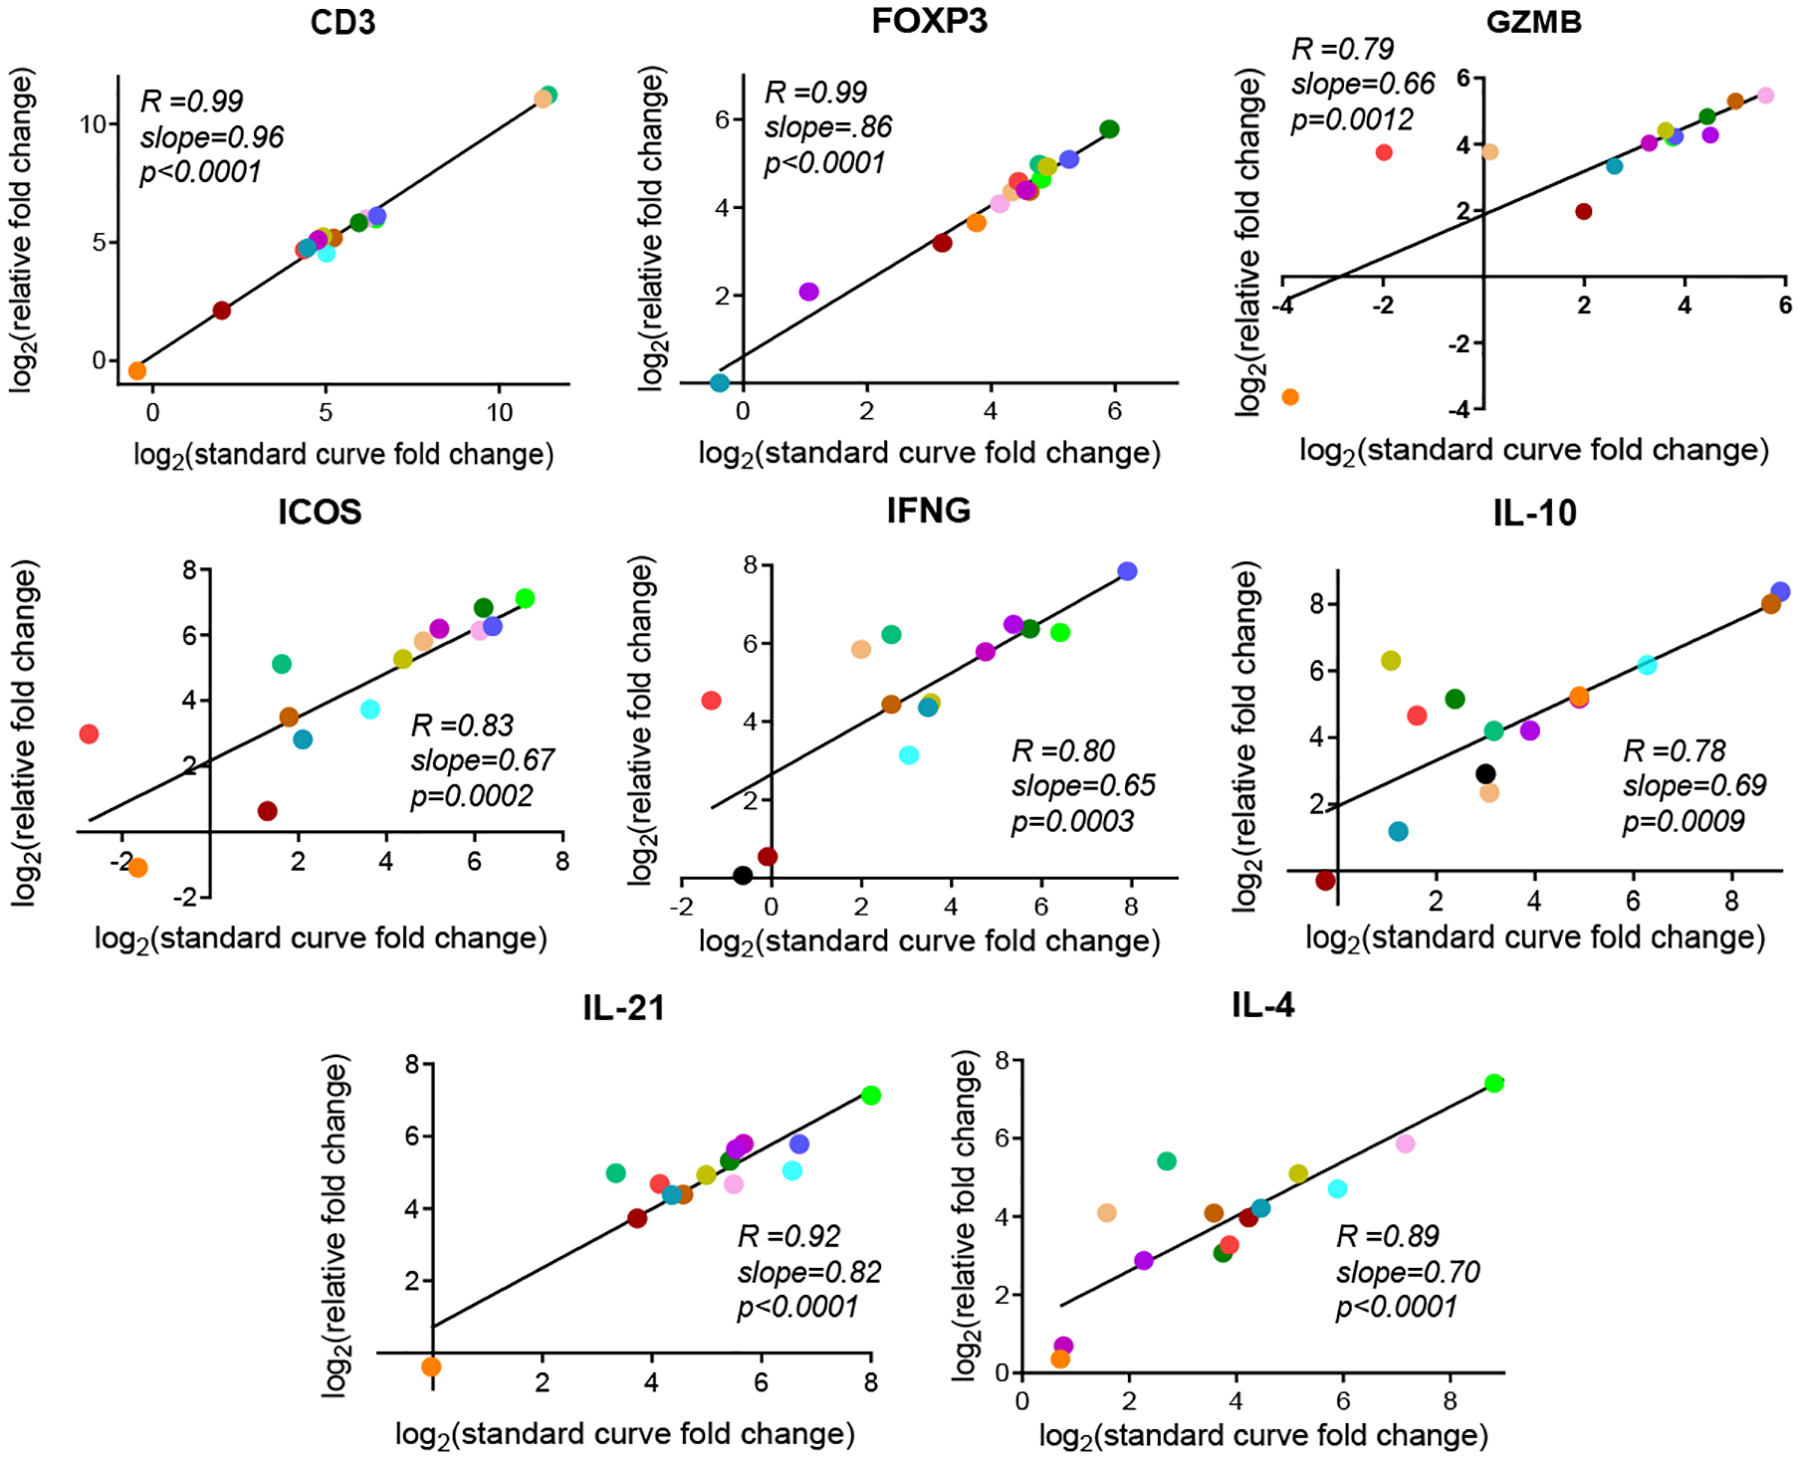
Fold change (in log2 scale) calculations from the ΔΔCT (relative) RT-qPCR method were plotted against fold change calculations from a standard curve applied (absolute) RT-qPCR method for eight target genes. Unamplified RNA from explanted tissues was used for this analysis. Each graph shown represents an individual linear regression analysis for a specific gene. Pearson’s correlation values (R) are shown on each graph with the slope of the linear regression line and the slope’s associated p-value. Color coding is the same as in Figure 1.
Table 2:
Statistical Comparison
| Gene | ΔΔCT RT-qPCR v. Standard Curve RT-qPCR | ΔΔCT RT-qPCR v. NanoString | Standard Curve RT-qPCR v. NanoString |
|---|---|---|---|
| CD3 | 0.71 | 0.76 | 0.85 |
| FOXP3 | 0.59 | 0.0006*** | 0.0008*** |
| GZMB | 0.06 | 0.0002*** | 0.0008*** |
| ICOS | 0.32 | 0.018* | 0.026* |
| IFNG | 0.06 | 0.021* | 0.0024** |
| IL-10 | 0.13 | 0.04* | 0.0085** |
| IL-21 | 0.41 | 0.007** | 0.0055** |
| IL-4 | 0.82 | 0.003** | 0.006** |
Student’s t-tests were performed on the fold changes from each platform data set.
Calculated p-values are shown for each comparison and each gene.
3.4. Interplatform Variability: NanoString n-Counter Analysis and RT-qPCR
To further assess interplatform variability, fold changes (in log2 scale) for target genes shared across each RT-qPCR platform were plotted against NanoString n-Counter analysis fold change data. All RNA isolated for this analysis was isolated from explant tissues using the RNeasy® Plus Universal Mini Kit. In Figure 4, correlation between the relative fold change (ΔΔCT) and the NanoString fold change was remarkably different from one gene to the next. Strong positive correlation was observed for CD3 (R=0.98; p<0.0001) and IFNG (R=0.73; p=0.016). Moderate correlation was observed for GZMB (R=0.60; p=0.11), and weak correlation for both IL-10 (R=0.42; p=0.23) and FOXP3 (R=0.30; p=0.43). No correlation (judged as R<0.3) was observed for ICOS (R=0.23; p=0.51), IL-21 (R=0.022; p=0.95), and IL-4 (R=0.17; p=0.64).
Figure 4: Linear regression model comparing fold change of target genes assessed by ΔΔCT (relative) RT-qPCR and the NanoString nCounter Analysis platform.
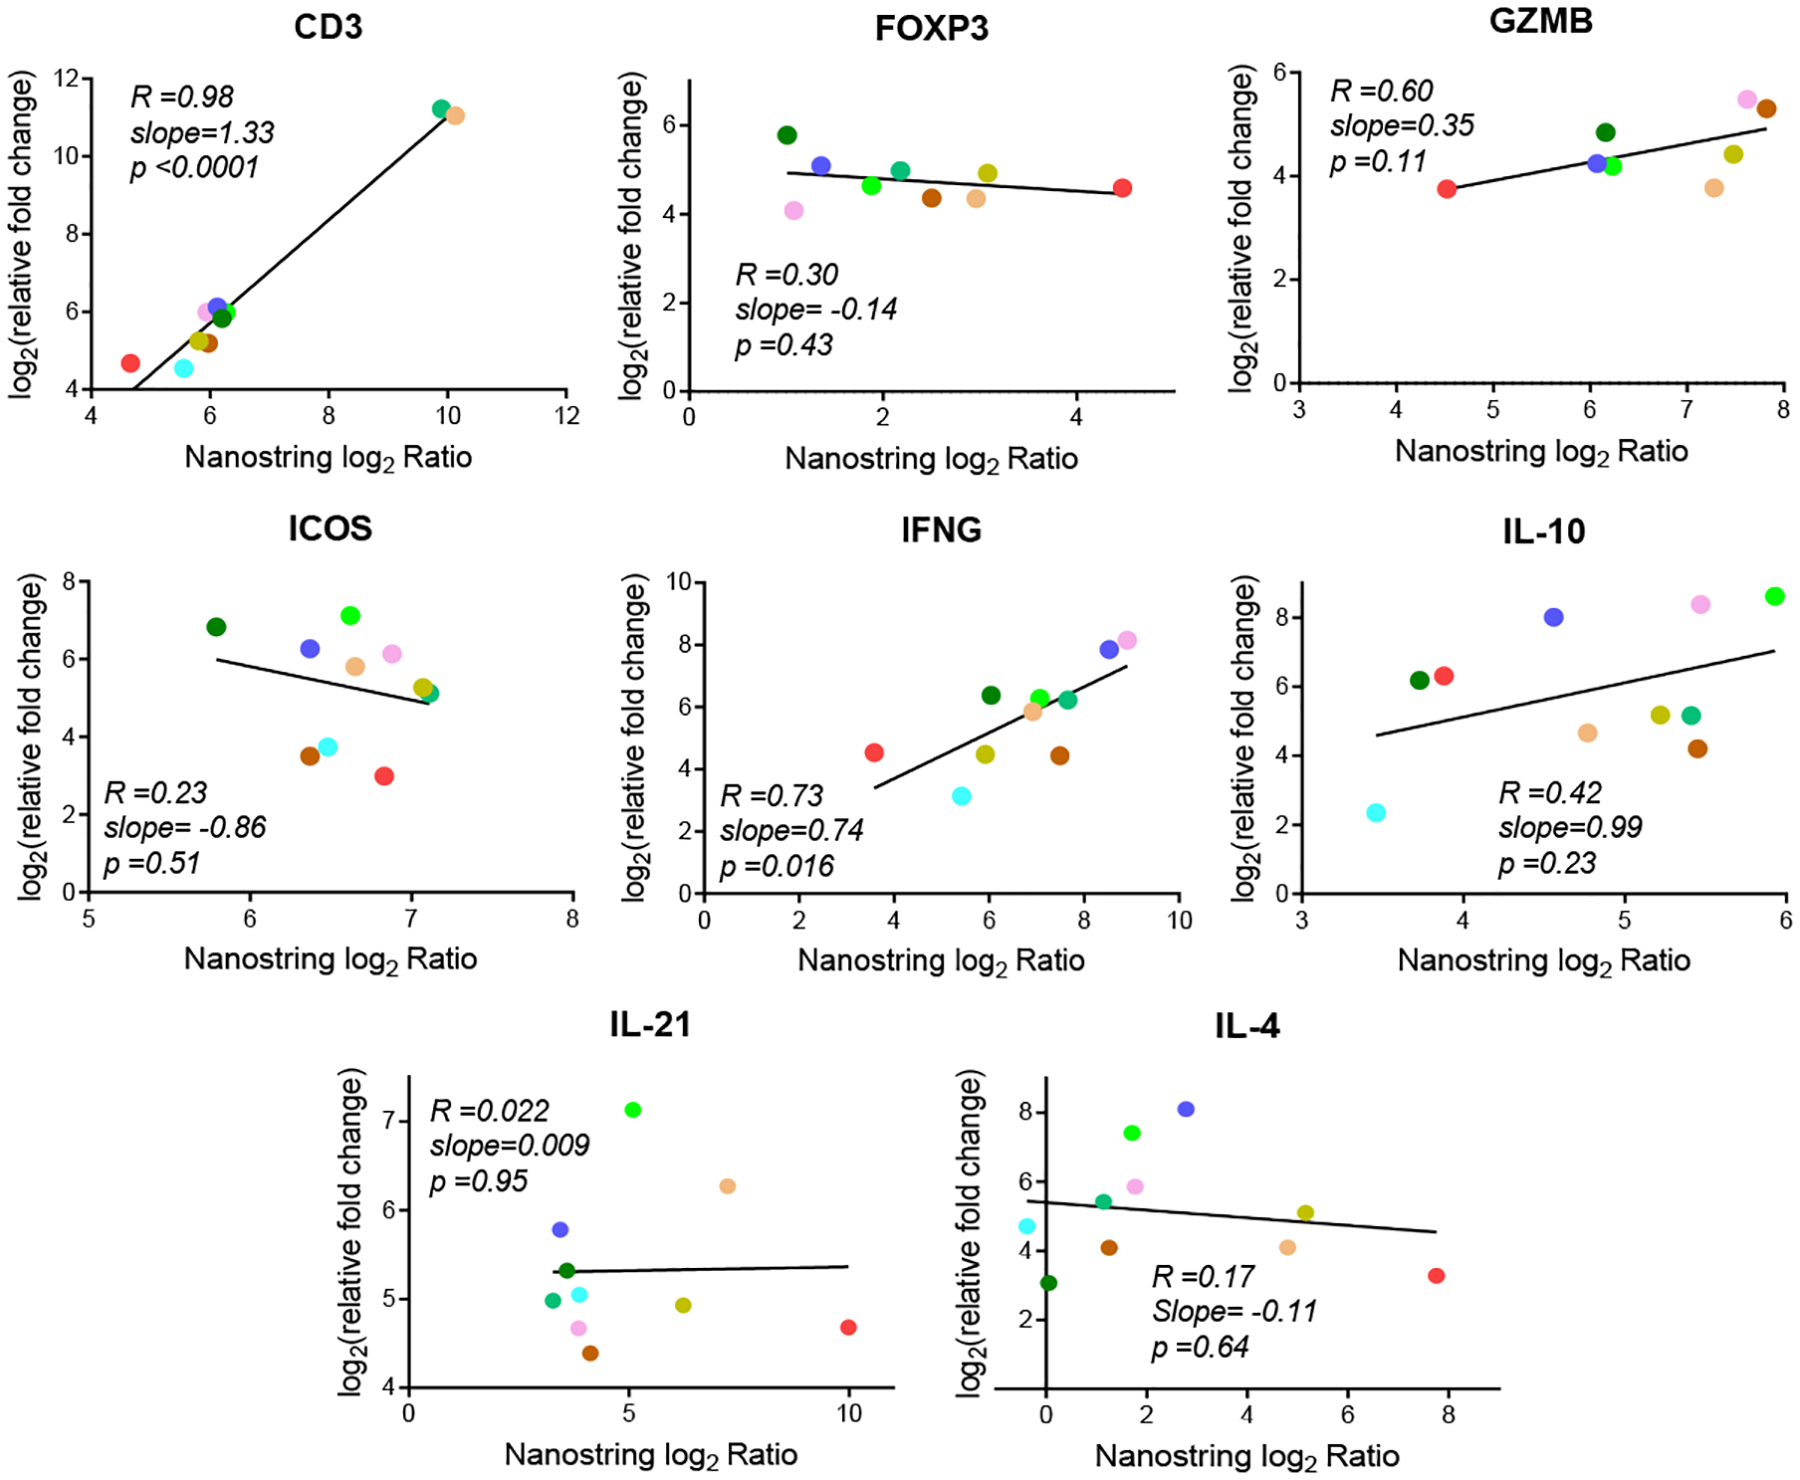
Fold change (in log2 scale) calculations from the ΔΔCT (relative) RT-qPCR method were plotted against fold change calculations from the NanoString nCounter Analysis platform for eight target genes. Unamplified RNA from explanted tissues was used for this analysis. Each graph shown represents an individual linear regression analysis for a specific gene. Pearson’s correlation values (R) are shown on each graph with the slope of the linear regression line and the slope’s associated p-value. Color coding is the same as in Figure 1.
In Figure 5, correlation between the standard curve fold change and the NanoString fold change resembled the pattern of correlation observed in Fig. 4. CD3 (R=0.98; p<0.0001) and IFNG (R=0.75; p=0.013) displayed strong positive correlation. A moderate positive correlation was observed for GZMB (R=0.66; p=0.054), and weak correlations for FOXP3 (R=0.44; p=0.24) and ICOS (R=0.34; p=0.33). No correlation was observed for IL-10 (R=0.17; p=0.67), IL-21 (R=0.005; p=0.98), and IL-4 (R=0.14; p=0.71). Paired Student’s t-tests were performed using the fold changes for each gene to analyze the difference in detection (Table 2). These results confirm that NanoString and RT-qPCR yield significantly different results. When using conventional RT-qPCR methods as the reference, the ‘accuracy’ of NanoString varies significantly for different genes, and was better for genes that are detected in larger quantities (CD3, IFNG, GZMB) than for genes expressed in smaller quantities (IL-4, IL-21).
Figure 5: Linear regression model comparing fold change of target genes assessed by standard curve (absolute) RT-qPCR and the NanoString nCounter Analysis platform.

Fold change (in log2 scale) calculations from a standard curve applied (absolute) RT-qPCR method were plotted against fold change calculations from the NanoString nCounter Analysis platform for eight target genes. Unamplified RNA from explanted tissues was used for this analysis. Each graph shown represents an individual linear regression analysis for a specific gene. Pearson’s correlation values (R) are shown on each graph with the slope of the linear regression line and the slope’s associated p-value. Color coding is the same as in Figure 1.
To identify the direction of changes in gene expression, we assessed interplatform variability using dot plots organized by gene, with individual data points representing single fold change values (Fig. 6). Each plot (Fig. 6A–C) corresponds to one of the three platforms assessed in this study. Overall, some genes surveyed exhibited lower expression levels with NanoString compared to RT-qPCR, and for those genes, we observed poor correlation. Additionally, the pattern or range of gene expression was more tightly grouped, with smaller internal distribution, in NanoString (Fig. 6C) compared to RT-qPCR (Fig. 6A–B). These results indicate that NanoString may be less sensitive to small amounts of variation in gene expression compared to RT-qPCR.
Figure 6: Overall interplatform gene expression analysis as fold change for each gene.

(A) Fold changes (in log2 scale) for ΔΔCT (relative) RT-qPCR are plotted as a group of data points and organized by target gene. The black horizontal line among each group of data points represents the mean of the group. (B) Fold changes for standard curve (absolute) RT-qPCR plotted as a group of data points and organized by gene. (C) Fold changes for NanoString plotted as a group of data points and organized by gene. Each dot represents an individual allograft tissue sample (n=14 allografts). The dotted line represents a fold change of 1 (no change) vs. naive heart control tissue (average of 4).
4. Discussion
Traditional RT-qPCR has long been considered a sensitive and specific staple of gene expression analysis in transplant studies. However, the newer NanoString nCounter Analysis System has attracted interest as an efficient, high-throughput alternative to the time consuming and limited RT-qPCR techniques. Here, using carefully validated methods for isolating and amplifying RNA from cynomolgus cardiac allografts, we have compared the performance of ΔΔCT (relative) RT-qPCR and standard curve (absolute) RT-qPCR against the NanoString nCounter Analysis System.
We show that RNA isolation techniques greatly influence the yield, quality, and purity of RNA samples available for analysis. RNeasy® Plus Universal kit proved a reliable method for isolating RNA from chronically rejected cardiac allografts, resulting in improved sample concentration and RIN values compared to traditional chloroform extraction of RNA and the RNeasy® Fibrous tissue kit. Our study was not designed to determine why the RNeasy® Fibrous tissue kit was frequently associated with debris, or a high incidence of inferior RNA yield and quality. The explant samples that yielded unsatisfactory RNA with the RNeasy® Fibrous tissue kit varied across assigned immunomodulatory regimen groups, graft survival time, and histological findings (Table 1). Although, most affected samples were associated with high CAV and ISHLT scores, other explants with similar histology yielded high-quality RNA without debris, indicating that tissue rejection per se did not directly compromise the ability to isolate high-quality RNA using the Fibrous kit. While we note that the Fibrous kit contains proteinase K as well as buffers RLT and RW1, which are not components of the RNeasy® Plus Universal kit, we did not choose to explore how each of these reagents affected RNA yield and purity.
We also validated the Ovation RNA-Seq V2 system as a method for amplifying RNA from small heart allograft biopsies. This system produces a double stranded cDNA product that can be utilized in both RT-qPCR and NanoString. Our results demonstrate that the Ovation amplification system does not generate any systematic biases, since we observed no marked difference in RNA profiling after amplification compared to unamplified samples, as shown by the strong correlation of RT-qPCR results and the close agreement with respect to gene transcript quantity. Our results are consistent with reports by Faherty et al., who showed that 93% of expressed genes were identical between all unamplified and amplified comparisons with this experimental system, and by Suzuki et al., who demonstrated the system’s high sensitivity to detect RNA sequences.38,39
In order to use gene expression profiling as an accurate, reproducible tool for mechanistic studies in the laboratory, it is imperative to understand the limitations of each method, and under what applications each method can be relied upon for accurate results. Our systematic platform evaluation found significant differences in quantitative results between conventional RT-qPCR methods and NanoString with fresh frozen cardiac explant tissues, particularly for genes that are expressed at relatively lower abundance. Based on several prior studies focused on tissue sampling, FFPE might also have been used.40–42 We have no experience with FFPE as a starting material for RNA expression measurements, but we have no reason to believe that our use of fresh frozen tissue samples in place of FFPE tissues influenced our results.
The discrepancies we observed between the NanoString and RT-qPCR platforms are consistent with several other studies that evaluated these and other gene profiling methods. Adam et al. evaluated human FFPE renal allograft samples and found that while NanoString results were reproducible across a range of RNA inputs, only a moderate correlation (r =.487) with RT-qPCR was noted.30 Similarly, Prokopec et al. found that NanoString correlated strongly with OpenArray data (R=.95) but only correlated moderately with RT-qPCR (R=.55) and exhibited much more variability, corroborating our current observations.32 Sigdel et al. (2018) found that correlation of results between NanoString and RT-qPCR changed from strong (r =.80) to moderate (r =.66) based entirely on tissue storage.34
The technical explanation for gene-specific variability in correlation between RT-qPCR and NanoString in cynomolgus monkey cardiac allografts is a point that is beyond our current scope, and merits further investigation. Currently unpublished data from Smith et al. that was released to the public domain through MolecularMD Corporation posits that NanoString requires a minimum of 9000 copies for robust and accurate detection. They demonstrate that NanoString can underestimate copy number, and that tissue type, preservation, and extraction methods can affect results using this method.43 We noted that NanoString fold changes were frequently lower than corresponding RT-qPCR fold changes (Fig. 4–5). Discrepancies in fold change between the two platforms may be attributable to the technical mechanism of NanoString itself, and a fundamental requirement for larger RNA inputs.
NanoString probes bind specifically to mRNA, which accounts for 5% of total RNA, at best. mRNA levels are dependent on a multitude of changing factors, including targets, their particular expression levels, and hybridization time. An additional factor contributing to RNA “counts” is FOV (fields of view). NanoString is counting barcodes within FOV that do not represent the entire lane. As such, NanoString only serves as a relative measurement, or ‘snapshot,’ of mRNA expression, relative to reference (housekeeping) genes. These properties may be contributing factors to the discrepancy in reported counts and calculated fold change measurements that we observed. Although likely not a major issue given that NanoString designs probes around highly conserved gene regions, this technique would not be sensitive to detect gene polymorphisms which could cause a ‘false negative’ signal.
An additional point of consideration is the relatively narrow “spread” (range) for gene-specific NanoString fold changes compared to RT-qPCR fold changes (Fig. 6). This could be indicative of a lack of sensitivity in NanoString to minor changes in expression for genes expressed below a certain raw threshold. On the other hand, this could be explained by inequivalent PCR efficiencies resulting in artificially biased RT-qPCR data. With further study, revised parameters for optimized use of NanoString could perhaps be established that would be less dependent on total expression level and sample quantity, and more sensitive to detect low abundance RNA species. Overall, NanoString is relatively simple to deploy, does not require an amplification step, and thus seems useful for circumstances where a high-throughput ‘survey’ approach is desirable. Allowing for the caveats above regarding accurate quantification, the relatively close correlation in rank-order of gene expression level between NanoString and the two reference RT-qPCR methods indicates that NanoString yields similar data as the more accurate but significantly more cumbersome classical approaches.
This study is limited in two regards. First, a restricted number of target genes were assessed in tissue explants and our findings might not be generalizable to the full array of RNA species measured in the NanoString platform. Second, the platform comparison presented only includes explant tissues. The small amount of DNA typically produced from small heart biopsies, due to the very limited amount of RNA present in the starting tissue, prevented us from exploring the relative accuracy of NanoString in biopsies.
We posit that each technology assessed here has advantages and disadvantages that need to be considered on a per application basis. RT-qPCR is reproducible and sensitive, but time consuming, labor intensive, and requires a large amount of cDNA to produce limited gene expression analysis. It is best suited to a small-scale, highly-focused analysis of only a few genes in a limited number of samples. In contrast, NanoString requires minimal sample handling and allows for direct quantification of gene transcript copy number.44 It is robust and requires a very small amount of RNA input to produce a relatively vast amount of data, allowing for a large-scale analysis within the span of only a few days.25,45 It even permits simultaneous, multiplexed detection of RNA and protein, and detects significantly degraded RNA.41,46,47 Our findings lead us to suggest that NanoString is a useful profiling platform under certain experimental demands. NanoString is perhaps optimally used for evaluating small tissue biopsies, where total available RNA stock limits high throughput analysis. Our data contribute to the general effort to optimally utilize gene expression profiling techniques not only for transplanted tissues but for the many other applications where accurate rank-order of gene expression versus precise quantification of absolute gene transcript number may be mechanistically informative.
Supplementary Material
Some cardiac tissues are not amenable to routine RNA isolation
Ovation RNA-Seq V2 system preforms reliable robust amplification
ΔΔCT and standard curve variations of RT-qPCR provide similar results
NanoString does not correlate well with traditional RT-qPCR methods
NanoString may be less sensitive to small variations in gene expression
Acknowledgements
This work was funded by NIH U01 AI 066719 to RN Pierson III and AM Azimzadeh as well as an AATS Summer Intern Scholarship to EAS Bergbower. We would like to thank Dr. Wenji Sun for her assistance with ordering and reagent maintenance. We would also like to thank Dr. Yuming Zhao and Dr. Erdyni Tzitzikov for designing the HPRT and FOXP3 primer and probe set. Finally, we would like to thank Dr. Keslar (Cleveland Clinic) for her generous gift of the FZR1 stock.
Footnotes
Publisher's Disclaimer: This is a PDF file of an unedited manuscript that has been accepted for publication. As a service to our customers we are providing this early version of the manuscript. The manuscript will undergo copyediting, typesetting, and review of the resulting proof before it is published in its final form. Please note that during the production process errors may be discovered which could affect the content, and all legal disclaimers that apply to the journal pertain.
Disclosures
The authors have no financial or other substantive conflicts of interest to report that could influence the results reported in this manuscript.
Appendix A: Supplementary Data
Supplementary data to this article can be found online.
References
- 1.Kaczmarek I, Deutsch MA, Kauke T, et al. Donor-specific HLA alloantibodies: long-term impact on cardiac allograft vasculopathy and mortality after heart transplant. Exp Clin Transplant. 2008;6(3):229–235. [PubMed] [Google Scholar]
- 2.Kalache S, Dinavahi R, Pinney S, Mehrotra A, Cunningham MW, Heeger PS. Anticardiac myosin immunity and chronic allograft vasculopathy in heart transplant recipients. J Immunol. 2011;187(2):1023–1030. [DOI] [PMC free article] [PubMed] [Google Scholar]
- 3.Kelishadi SS, Azimzadeh AM, Zhang T, et al. Preemptive CD20+ B cell depletion attenuates cardiac allograft vasculopathy in cyclosporine-treated monkeys. J Clin Invest. 2010;120(4):1275–1284. [DOI] [PMC free article] [PubMed] [Google Scholar]
- 4.Azimzadeh AM, Pfeiffer S, Wu GS, et al. Humoral immunity to vimentin is associated with cardiac allograft injury in nonhuman primates. Am J Transplant. 2005;5(10):2349–2359. [DOI] [PubMed] [Google Scholar]
- 5.Skoric B, Cikes M, Ljubas Macek J, et al. Cardiac allograft vasculopathy: diagnosis, therapy, and prognosis. Croat Med J. 2014;55(6):562–576. [DOI] [PMC free article] [PubMed] [Google Scholar]
- 6.Libby P, Pober JS. Chronic rejection. Immunity. 2001;14(4):387–397. [DOI] [PubMed] [Google Scholar]
- 7.Zhang T, Azimzadeh AM, Sun W, et al. Selective CD28 Inhibition Modulates Alloimmunity and Cardiac Allograft Vasculopathy in Anti-CD154-Treated Monkeys. Transplantation. 2018;102(3):e90–e100. [DOI] [PMC free article] [PubMed] [Google Scholar]
- 8.Beazley KE, Zhang T, Lima F, et al. Implication for transglutaminase 2-mediated activation of beta-catenin signaling in neointimal vascular smooth muscle cells in chronic cardiac allograft rejection. J Heart Lung Transplant. 2012;31(9):1009–1017. [DOI] [PMC free article] [PubMed] [Google Scholar]
- 9.de Jonge J, Kurian S, Shaked A, et al. Unique early gene expression patterns in human adult-to-adult living donor liver grafts compared to deceased donor grafts. Am J Transplant. 2009;9(4):758–772. [DOI] [PMC free article] [PubMed] [Google Scholar]
- 10.Fahmy NM, Yamani MH, Starling RC, et al. Chemokine and receptor-gene expression during early and late acute rejection episodes in human cardiac allografts. Transplantation. 2003;75(12):2044–2047. [DOI] [PubMed] [Google Scholar]
- 11.Araki M, Fahmy N, Zhou L, et al. Expression of IL-8 during reperfusion of renal allografts is dependent on ischemic time. Transplantation. 2006;81(5):783–788. [DOI] [PubMed] [Google Scholar]
- 12.Halloran PF, Reeve J, Aliabadi AZ, et al. Exploring the cardiac response to injury in heart transplant biopsies. JCI Insight. 2018;3(20). [DOI] [PMC free article] [PubMed] [Google Scholar]
- 13.Reeve J, Halloran PF. Biopsy transcriptome expression profiling: proper validation is key. Lancet. 2017;389(10069):600–601. [DOI] [PubMed] [Google Scholar]
- 14.Halloran PF, Venner JM, Famulski KS. Comprehensive Analysis of Transcript Changes Associated With Allograft Rejection: Combining Universal and Selective Features. Am J Transplant. 2017;17(7):1754–1769. [DOI] [PubMed] [Google Scholar]
- 15.Halloran PF, Venner JM, Madill-Thomsen KS, et al. Review: The transcripts associated with organ allograft rejection. Am J Transplant. 2018;18(4):785–795. [DOI] [PubMed] [Google Scholar]
- 16.Loupy A, Duong Van Huyen JP, Hidalgo L, et al. Gene Expression Profiling for the Identification and Classification of Antibody-Mediated Heart Rejection. Circulation. 2017;135(10):917–935. [DOI] [PubMed] [Google Scholar]
- 17.Parkes MD, Aliabadi AZ, Cadeiras M, et al. An integrated molecular diagnostic report for heart transplant biopsies using an ensemble of diagnostic algorithms. J Heart Lung Transplant. 2019;38(6):636–646. [DOI] [PubMed] [Google Scholar]
- 18.Li B, Hartono C, Ding R, et al. Noninvasive diagnosis of renal-allograft rejection by measurement of messenger RNA for perforin and granzyme B in urine. N Engl J Med. 2001;344(13):947–954. [DOI] [PubMed] [Google Scholar]
- 19.Azimzadeh AM, Pfeiffer S, Wu G, et al. Alloimmunity in primate heart recipients with CD154 blockade: evidence for alternative costimulation mechanisms. Transplantation. 2006;81(2):255–264. [DOI] [PubMed] [Google Scholar]
- 20.Barrows BR, Azimzadeh AM, McCulle SL, et al. Robust gene expression with amplified RNA from biopsy-sized human heart tissue. J Mol Cell Cardiol. 2007;42(1):260–264. [DOI] [PubMed] [Google Scholar]
- 21.Keslar KS, Lin M, Zmijewska AA, et al. Multicenter evaluation of a standardized protocol for noninvasive gene expression profiling. Am J Transplant. 2013;13(7):1891–1897. [DOI] [PMC free article] [PubMed] [Google Scholar]
- 22.van der Zwan M, Baan CC, Colvin RB, et al. Immunomics of Renal Allograft Acute T Cell-Mediated Rejection Biopsies of Tacrolimus- and Belatacept-Treated Patients. Transplant Direct. 2019;5(1):e418. [DOI] [PMC free article] [PubMed] [Google Scholar]
- 23.Poirier N, Azimzadeh AM, Zhang T, et al. Inducing CTLA-4-dependent immune regulation by selective CD28 blockade promotes regulatory T cells in organ transplantation. Sci Transl Med. 2010;2(17):17ra10. [DOI] [PMC free article] [PubMed] [Google Scholar]
- 24.Chang AC BM, Blair KSA, Zhang J, Scott MA, Brock JE, Thomas DW, Burkly LC, Miller GG, Pierson RN III. Modulation of interleukin-12 gene expression in primate cardiac allografts during anti-CD40 Ligand monoclonal antibody treatment. Surgical Forum. 1998;XLIX:363–364. [Google Scholar]
- 25.Geiss GK, Bumgarner RE, Birditt B, et al. Direct multiplexed measurement of gene expression with color-coded probe pairs. Nat Biotechnol. 2008;26(3):317–325. [DOI] [PubMed] [Google Scholar]
- 26.Tsang HF, Xue VW, Koh SP, Chiu YM, Ng LP, Wong SC. NanoString, a novel digital color-coded barcode technology: current and future applications in molecular diagnostics. Expert Rev Mol Diagn. 2017;17(1):95–103. [DOI] [PubMed] [Google Scholar]
- 27.Shannon CP, Balshaw R, Ng RT, et al. Two-stage, in silico deconvolution of the lymphocyte compartment of the peripheral whole blood transcriptome in the context of acute kidney allograft rejection. PLoS One. 2014;9(4):e95224. [DOI] [PMC free article] [PubMed] [Google Scholar]
- 28.Afzali B, Chapman E, Racape M, et al. Molecular Assessment of Microcirculation Injury in Formalin-Fixed Human Cardiac Allograft Biopsies With Antibody-Mediated Rejection. Am J Transplant. 2017;17(2):496–505. [DOI] [PubMed] [Google Scholar]
- 29.Dromparis P, Aboelnazar NS, Wagner S, et al. Ex vivo perfusion induces a time- and perfusate-dependent molecular repair response in explanted porcine lungs. Am J Transplant. 2019;19(4):1024–1036. [DOI] [PubMed] [Google Scholar]
- 30.Adam B, Afzali B, Dominy KM, et al. Multiplexed color-coded probe-based gene expression assessment for clinical molecular diagnostics in formalin-fixed paraffin-embedded human renal allograft tissue. Clin Transplant. 2016;30(3):295–305. [DOI] [PubMed] [Google Scholar]
- 31.Chatterjee A, Leichter AL, Fan V, et al. A cross comparison of technologies for the detection of microRNAs in clinical FFPE samples of hepatoblastoma patients. Sci Rep. 2015;5:10438. [DOI] [PMC free article] [PubMed] [Google Scholar]
- 32.Prokopec SD, Watson JD, Waggott DM, et al. Systematic evaluation of medium-throughput mRNA abundance platforms. RNA. 2013;19(1):51–62. [DOI] [PMC free article] [PubMed] [Google Scholar]
- 33.Veldman-Jones MH, Lai Z, Wappett M, et al. Reproducible, Quantitative, and Flexible Molecular Subtyping of Clinical DLBCL Samples Using the NanoString nCounter System. Clin Cancer Res. 2015;21(10):2367–2378. [DOI] [PubMed] [Google Scholar]
- 34.Sigdel TK, Nguyen M, Dobi D, et al. Targeted Transcriptional Profiling of Kidney Transplant Biopsies. Kidney Int Rep. 2018;3(3):722–731. [DOI] [PMC free article] [PubMed] [Google Scholar]
- 35.Del Gaudio S, Cirillo A, Di Bernardo G, et al. Preamplification procedure for the analysis of ancient DNA samples. ScientificWorldJournal. 2013;2013:734676. [DOI] [PMC free article] [PubMed] [Google Scholar]
- 36.Noutsias M, Rohde M, Block A, et al. Preamplification techniques for real-time RT-PCR analyses of endomyocardial biopsies. BMC Mol Biol. 2008;9:3. [DOI] [PMC free article] [PubMed] [Google Scholar]
- 37.NuGEN Technologies I. Ovation RNA-Seq System V2 Part No. 7102. Redwood City, CA: Author; 2011. [Google Scholar]
- 38.Suzuki T, Kawada JI, Okuno Y, et al. Comprehensive detection of viruses in pediatric patients with acute liver failure using next-generation sequencing. J Clin Virol. 2017;96:67–72. [DOI] [PubMed] [Google Scholar]
- 39.Faherty SL, Campbell CR, Larsen PA, Yoder AD. Evaluating whole transcriptome amplification for gene profiling experiments using RNA-Seq. BMC Biotechnol. 2015;15:65. [DOI] [PMC free article] [PubMed] [Google Scholar]
- 40.Flynn A, Dwight T, Harris J, et al. Pheo-Type: A Diagnostic Gene-expression Assay for the Classification of Pheochromocytoma and Paraganglioma. J Clin Endocrinol Metab. 2016;101(3):1034–1043. [DOI] [PubMed] [Google Scholar]
- 41.Chen X, Deane NG, Lewis KB, et al. Comparison of Nanostring nCounter(R) Data on FFPE Colon Cancer Samples and Affymetrix Microarray Data on Matched Frozen Tissues. PLoS One. 2016;11(5):e0153784. [DOI] [PMC free article] [PubMed] [Google Scholar]
- 42.Kolbert CP, Feddersen RM, Rakhshan F, et al. Multi-platform analysis of microRNA expression measurements in RNA from fresh frozen and FFPE tissues. PLoS One. 2013;8(1):e52517. [DOI] [PMC free article] [PubMed] [Google Scholar]
- 43.Smith DL, Quyen V, Spittle C. RNA Quantitation Platform Comparison: nCounter, RT-qPCR, ddPCR. Molecular MD Corp; Web site. http://molecularmd.com/wp-content/uploads/2017/03/RNA-Quantitation-Platform-Comparison_nCounter-RTqPCR-ddPCR_NextGenDx2016.pdf. Published 2016. Accessed. [Google Scholar]
- 44.Bentley-Hewitt KL, Hedderley DI, Monro J, Martell S, Smith H, Mishra S. Comparison of quantitative real-time polymerase chain reaction with NanoString(R) methodology using adipose and liver tissues from rats fed seaweed. N Biotechnol. 2016;33(3):380–386. [DOI] [PubMed] [Google Scholar]
- 45.Veldman-Jones MH, Brant R, Rooney C, et al. Evaluating Robustness and Sensitivity of the NanoString Technologies nCounter Platform to Enable Multiplexed Gene Expression Analysis of Clinical Samples. Cancer Res. 2015;75(13):2587–2593. [DOI] [PubMed] [Google Scholar]
- 46.Warren S. Simultaneous, Multiplexed Detection of RNA and Protein on the NanoString((R)) nCounter((R)) Platform. Methods Mol Biol. 2018;1783:105–120. [DOI] [PubMed] [Google Scholar]
- 47.Reis PP, Waldron L, Goswami RS, et al. mRNA transcript quantification in archival samples using multiplexed, color-coded probes. BMC Biotechnol. 2011;11:46. [DOI] [PMC free article] [PubMed] [Google Scholar]
Associated Data
This section collects any data citations, data availability statements, or supplementary materials included in this article.