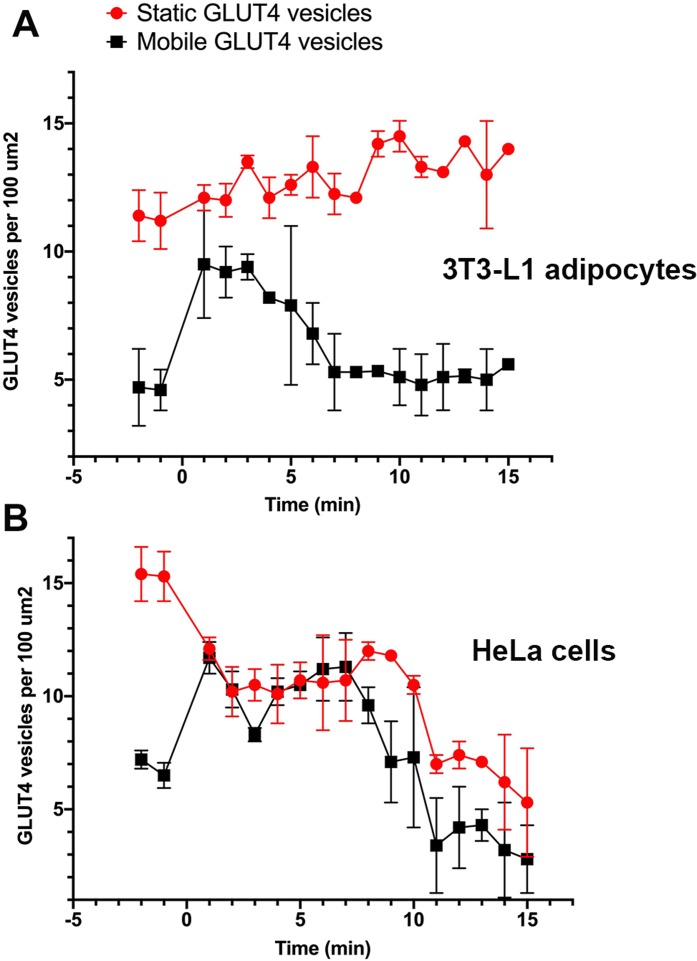
Figure 3. Quantification of vesicle dynamics in the TIRF zone.
Counts of mobile and stationary vesicles for 3T3-L1 adipocytes (A) and HeLa cells (B) stimulated by 100 nM insulin were determined as outlined in “Materials and Methods”. A total of 10 individual 100 µm2 regions of interest were analysed from three cells from three separate platings of cells. Error bars correspond to standard deviation for 30 measured ROIs. Images were recorded at a frame rate of 2 Hz for 15 min where time point 0 corresponds to point of insulin addition.

