Abstract
Background
In the current healthcare environment there is increasing pressure to deliver high quality care to more people at less cost. Robotic assisted thoracic surgical procedures (RATS) have been shown by some to be more expensive than conventional endoscopic or open surgery. We initiated this study to assess the financial impact of RATS compared to robotic non-thoracic surgery in an academic institution.
Methods
A retrospective study was performed for all patients who underwent any robotically assisted surgical procedure at Temple University Hospital (TUH) in fiscal year 2015. Surgical volume, operative time, length of stay (LOS), case mix index (CMI), direct and indirect costs, hospital charges, surgical charges, contribution margin (CM) and net margin (NM) were collected for the thoracic surgery service in addition to other services which performed more than 20 robotic cases a year. We analyzed the data according to the following strategy: (I) financial performance for both inpatient and outpatient robotic procedures for the entire hospital; (II) compared financial data for robotic and non-robotic surgeries in the thoracic surgery division; (III) compared thoracic surgery data with the STS database for the same time period in order to calculate any potential cost saving (PCS).
Results
In FY15, a total of 696 robotic procedures were performed by the various services at TUH with a mean of 58 cases each month. Although CM was highest for cardiovascular surgery, the highest NM was by thoracic surgery. Despite having the highest volume and a positive CM, the mostly outpatient urology service showed a negative NM in FY15. A CMI-adjusted comparison on 208 of the 589 robotic procedures where there was a comparable group of inpatients who had open procedures, the mean direct cost for non-robotic procedures was $6,239, 9% less than for robotic procedures. The mean total cost for non-robotic procedures was only 3.64% ($435) less than that for robotic procedures ($11,502 vs. $11,937). When compared with the UHC expected LOS, the robotic group had a lower LOS while the non-robotic group had a higher LOS. The mean total direct costs were $3,510 less for the robotic procedures ($16,502 vs. $20,012). When compared to similar cases reported to the STS in FY 2015, the length of stay, conversion rate, transfusion rate, post-operative complications and OR time compared favorably. Using calculations based on published data, the potential cost savings are in the 1 to 2 million dollar range compared to traditional endoscopic or open procedures reported to the STS.
Conclusions
High acuity services such as Thoracic Surgery drive higher CM per case as long as variable costs especially LOS are kept low. Procedures with lower CMI may not provide a high enough CM to offset the fixed and variable costs. Robotic surgical cases performed in the outpatient setting may incur significant losses as the reimbursement does not cover the direct costs. Hospitals should preferentially allocate robotic resources to inpatient procedures with higher CMI and work to decrease overall LOS.
Keywords: Robotic surgery, robotic thoracic surgery, contribution margin, net margin, direct cost, indirect cost
Introduction
Over the last 20 years, robotic technology has been more frequently utilized in the arena of minimally invasive thoracic surgery as the benefits of dexterous dissection and manipulation in a confined space make it ideal for intrathoracic dissection. For these perceived benefits in addition to competing market forces, surgeons are keen to adopt and claim this new technology. The increase in robotic surgery over the last decade has resulted in numerous studies touting its benefits and perhaps pressuring hospitals to acquire this modality in order to remain competitive.
However, as with all new technology, the decision to implement robotic surgery must be balanced by the financial capability to do so. In the current healthcare environment there is increasing pressure on all providers to deliver high quality care to more people at less cost. This mandate directly competes with the adoption of new and costly technology that may (or may not) improve patient care. The initial investment of purchasing a robotic surgery unit can range from 2–3 million USD depending on the accessories. A state of the art model includes 2 consoles, near infrared capability and training simulators. In addition to the upfront cost, there are the disposables, ongoing maintenance, and expected depreciation. Other less tangible but no less important costs include salaries, administrative overhead and non-robotic instrument expense. The premise is that better outcomes, shorter hospital stay and fewer complications will offset these higher costs.
Several studies have investigated the cost associated with robotics in different surgical procedures (1-5). Fewer have reported the cost of robotic-assisted thoracic surgery (RATS) compared with conventional video-assisted thoracic surgery (VATS) or open surgery and have described RATS to be more expensive (6-9). These studies tended to look at a small portion of the overall costs or were not specifically designed to look at the issue of total cost. We initiated this study to assess the financial impact of RATS in an academic institution, Temple University Hospital (TUH).
Methods
We retrospectively analyzed financial and clinical data collected prospectively for all patients who underwent any robotically assisted surgical procedure at TUH in fiscal year 2015 (FY15). The study was approved by the institutional review board (protocol # 24196) and was performed in collaboration with the office of Business Intelligence in the Finance department of Temple Health. The financial database (McKesson Performance Analytics System) was queried retrospectively using CPT codes to identify all patients undergoing robotic assisted procedures in addition to non-robotic thoracic surgical procedures in FY15.
Data collected included operative time, length of stay (LOS), case mix index (CMI), direct and indirect costs, hospital charges, surgical charges, and contribution margin for patients on any surgical service with more than 20 robotic cases.
Continuous variables are presented as mean ± standard deviation, medians (interquartile range) and were compared using T-tests. Statistical analyses were performed using Excel 14.1 (Microsoft 200 Corp, Redmond, WA, USA). Tests were analyzed using P<0.05 to indicate statistical significance.
In order to be clear and consistent, it is illustrative to define the terms used in this paper.
Direct Costs include expenses incurred by direct patient care areas, such as nursing floors, labs, the imaging departments, the operating room and the pharmacy, among others. Direct robotic specific cost per case included robotic disposable supplies, allocated incremental robotic depreciation, maintenance and lease expense. Direct costs are sub-divided into two components:
❖ Direct variable costs consist of direct patient care expenses that vary directly with patient volume. As census fluctuates these expenses also increase and decrease in kind. Examples would be salaries for RNs on the nursing floors, the cost of surgical supplies, the costs of pharmaceuticals delivered to patients, etc.
❖ Direct semi variable costs consist of expenses associated with patient care departments, but only those that do not vary directly with patient volume. Examples include the salary for nurse managers or unit clerks on the nursing floors, training expenses, or equipment maintenance expenses.
Indirect costs, sometimes referred to as overhead expenses, include expenses associated with non-patient care departments. Examples are billing, coding, general administration, utilities expenses, and dietary, among others.
Contribution margin (CM): defined as total revenue minus all variable costs.
Net margin (NM) is the percentage of revenue remaining after all costs including indirect costs have been subtracted from total revenue.
We analyzed the data according to the following strategy:
Financial performance for both inpatient and outpatient robotic procedures for the entire hospital were analyzed and compared.
We then compared our financial data for robotic and non-robotic surgeries in the thoracic surgery division in order to assess the impact of robotics on our divisional finances.
We then compared our thoracic surgery data with the STS database for the same time period in order to calculate any potential cost saving (PCS). PCS was calculated based on the comparison between our own robotic thoracic data and STS database for open and VATS or laparoscopic data. PCS are also based on previously published data in addition to internal estimates based on 2013 national Premier database (Table 1) (10-13).
Table 1. Clinical outcomes compared to STS data, FY 2015 and PCS.
| Clinical outcomes | Robotic | TES | Open | PCS (vs. TES) | PCS (vs. open) |
|---|---|---|---|---|---|
| Number of patients | 169 | 4,612 | 5,913 | ||
| Length of stay (inpatient days) | 4.7 | 5.3 | 7.3 | $932 | $4,038 |
| Conversions | 1.8% | 8.1% | NA | $180–$445 | NA |
| Transfusions | 1.2% | 3.8% | 7.8% | $33 | $79 |
| Post-operative complications | |||||
| Minor complications | 14.8% | 43.6% | 55.1% | $1,038 | $1,521 |
| Major complications | 11.8% | 22.0% | 28.8% | $3,213 | $5,884 |
| OR time (min) | 148 | 180 | 175 | $350 | $297 |
| Total PCS per case | $5,746–$6,011 | $11,819 | |||
| Total overall PCS for all cases | $971,074–$1,015,859 | $1,997,411 |
PCS, potential cost savings; TES, traditional endoscopic surgery (thoracoscopy or laparoscopy).
Results
Overall impact of robotics on the hospital including all services
Overall volume, CM and NM by service (Figures 1,2)
Figure 1.
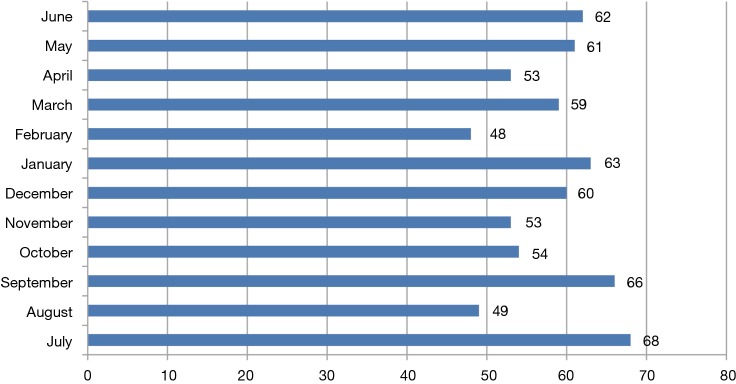
Number of robotic procedures performed by all services in FY15.
Figure 2.
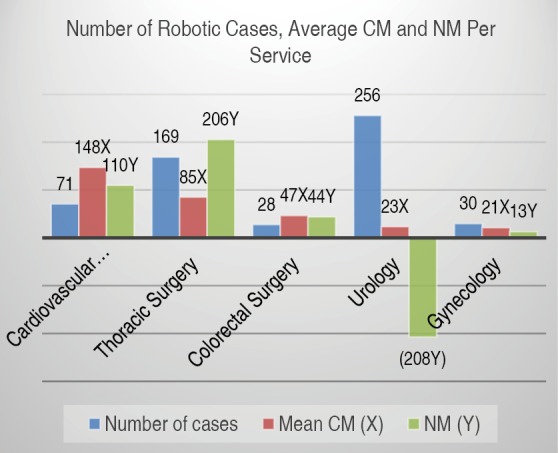
Number of robotic cases, average CM and NM per service. CM, contribution margin; NM, net margin.
In FY15, a total of 696 robotic procedures were performed by the various services at TUH with a mean of 58 cases each month (range, 48–68) as shown in Figure 1. Surgical services with more than 20 annual robotic surgical cases were urology (n=256), thoracic surgery (n=169), cardiovascular surgery (n=71), gynecology (n=30) and colorectal surgery (n=28). Figure 2 shows the mean CM and NM per service. Due to proprietary reasons, unit values of “CMU” and “NMU” were used as surrogate dollar amount units for CM and NM respectively. Although CM was highest for cardiovascular surgery, the highest NM was by thoracic surgery. Despite having the highest volume and a positive CM, the mostly outpatient urology service showed a negative NM in FY15.
Mean CM and NM based on type of admission (Figures 3,4)
Figure 3.
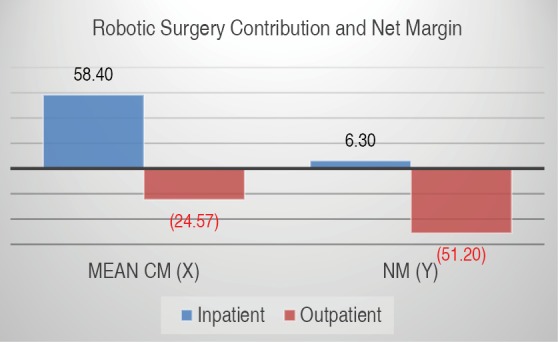
Average CM and NM per case by all services in FY15. CM, contribution margin; NM, net margin.
Figure 4.
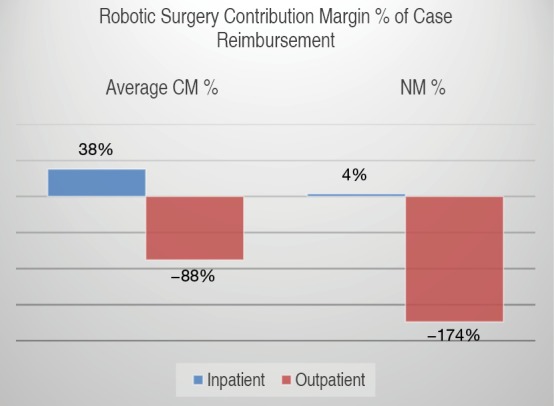
Robotic surgery CM and NM as percent of case reimbursement. CM, contribution margin; NM, net margin.
The mean CM per robotic surgical case for all services was positive 57.84 CMU (SD 45.48) with median of 53.67 CMU (IQR 55.35) for inpatient surgeries and negative 24.49 CMU (SD 21.74) with median of −17.98 (IQR 34.96) for outpatient surgeries. The mean NM was 6.29 NMU (SD 2.60) with median of 7.11 NMU (IQR 3.81) for inpatient case and a negative NM of negative 51.19 NMU (SD 2.60) with median of −62.69 NMU (IQR 36.07) per outpatient case (Figure 3).
When CM is described as percent of total surgical reimbursement (CM%), this translated into an average CM% of 38% for inpatient surgeries and −88% for outpatient surgeries. The NM was therefore 4% for inpatient surgeries and −174% for outpatient surgeries (Figure 4).
Comparison of direct and total cost per case between robotic and non-robotic procedures (Figure 5)
Figure 5.
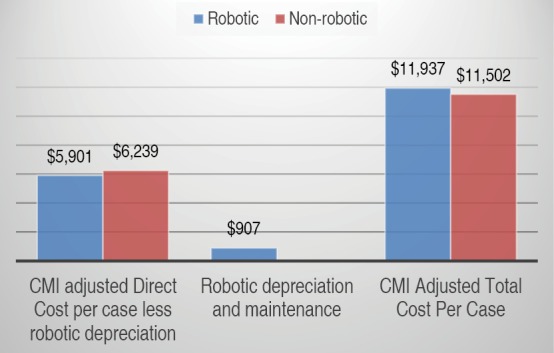
CMI adjusted comparison of direct and total cost per case between robotic and non-robotic procedures. CMI, case mix index.
To compare the direct and total cost of robotic and non-robotic procedures in all services, we performed a CMI-adjusted comparison on 208 of the 589 robotic procedures where there was a comparable group of inpatients who had open procedures (Figure 5). As shown, the mean direct cost for non-robotic procedures was $6,239 (SD 2,180) with median of $5,475 (IQR 2,485). This was 9% less than for robotic procedures, $6,808 (SD 1,693) with median of $6,519 (IQR 2,485). This difference in direct costs was statistically significant (P=0.044) and includes $907 for robotic related costs of depreciation and maintenance. The mean total cost for non-robotic procedures was, however, only 3.6% ($435) less than that for robotic procedures ($11,502 vs. $11,937), a non-statistically significant difference (P=0.35).
Thoracic robotic surgery (Table 2)
Table 2. Direct costs LOS, CMI and charges for all thoracic cases in FY 2015.
| Parameter | Robotic | Non-robotic | P |
|---|---|---|---|
| Cases | 169 | 80 | |
| Case mix index | 2.50 | 3.15 | 0.15 |
| Mean length of stay (days) | 5.24 | 9.24 | <0.01 |
| UHC expected LOS (days) | 5.92 | 7.66 | <0.01 |
| Total direct robotic specific cost per case | $3,223 | NA | NA |
| • Robotic disposable supplies | |||
| • Allocated robotic depreciation, maintenance and lease expense | |||
| Total direct non-robotic salary and non-salary costs: | $13,279 | $20,012 | 0.14 |
| • Operating room | |||
| • Pharmacy | |||
| • Lab | |||
| • Imaging | |||
| • Therapy | |||
| • Supplies | |||
| • ICU room and board | |||
| • All other room and board | |||
| • Blood | |||
| • All other departments |
LOS, length of stay; CMI, case mix index.
In FY15, a total of 249 operative procedures (excluding endoscopic and non-thoracic procedures) were performed on the thoracic surgical service. The number of robotic procedures (n=169) was more than twice that of the non-robotic ones. The case mix index (CMI) was lower in the robotic group as was the actual length of stay (ALOS). When compared with the University Health System consortium (UHC) expected ALOS, the robotic group had a lower ALOS while the non-robotic group had a higher ALOS. The mean Direct Robotic Specific Cost per Case was $3,223, but the mean total direct costs were actually $3,510 less for the robotic procedures ($16,502 vs. $20,012). A breakdown of direct costs on the thoracic service is shown in Table 1.
Comparison of thoracic data with STS database and calculation of potential cost savings (Tables 1,3)
Table 3. Cost effect of different variable endpoints.
| Clinical outcomes | Cost per outcome | Reference |
|---|---|---|
| Length of stay (inpatient days) | $1,553 | Halpern et al. (10) |
| ICU (days), If applicable | $4,738 | Halpern et al. (10) |
| Conversion to open | $3,162–$7,812 | Premier database* |
| Transfusions | $1,142 | Shander et al. (11) |
| Post operative complications | 0.3× $14,009 | Vonlanthen et al. (12) |
| Minor complications | 0.3× $14,009 | Vonlanthen et al. (12) |
| Major complications | 2.8× $14,009 | Vonlanthen et al. (12) |
| OR time (min) | $11 | Chatterjee (13) |
*, Internal estimates based on 2013 National Premier database. Analysis and data, including ICD-9 codes, are on file.
When compared to similar cases reported to the STS in FY 2015, the length of stay, conversion rate, transfusion rate, post-operative complications and OR time compared favorably (Table 1). Using calculations based on Table 2, the potential cost savings are in the 1 to 2 million dollar range compared to traditional minimally invasive or open procedures reported to the STS.
Discussion
We have not attempted in this study to compare the clinical or even financial data of robotics to standard minimally invasive or open surgery. Rather we set out to evaluate the financial implications of introducing a robotics thoracic program in an academic institution.
The vast majority of technological innovation is accomplished by private entities that rightly seek to generate a return on their investment made in developing the technology. When there is evidence of benefit compared to standard treatments, there is also increasing pressure on physicians, hospitals and even patients to adopt this new technology which often leads to increases in costs. In fact, regardless of the acuity of the condition, there is also the moral dilemma of not withholding any treatment that may have a benefit, no matter how small, for our patients.
In an article by Laupacis in 1992, they proposed five ‘rades of recommendation’ for implementation. Grade A technology (more effective and less expensive than the existing one), whereas a grade E technology (less or equally effective and more costly). Grades B through D are more effective and more costly. Many issues other than cost effectiveness, such as ethical and political considerations, affect the implementation of a new technology. However, especially with current pressures to reduce costs as reimbursement is decreasing, it is important to make sound financial decisions related to the adoption and utilization of health care services (14).
Opportunity cost with respect to surgery, can occur if a certain technology uses more operating time than another. Economically, this adds a “cost” to the less efficient technology. Although this is a fundamental concept for economists it is seldom used in evaluation of surgical technology (13).
The pressure on hospital systems, particularly community hospitals is to avoid a competitive disadvantage with other hospitals that may have a certain device available. For academic institutions there may be an additional pressure to stay at the “cutting edge” of technology in addition to contributing to education and research, an imperative that adds to the cost of adopting new technology for these academic hospitals. An academic health care system must support both medical professionals and their patients in the adoption and use of beneficial new technologies, even when they may not be cost-effective or adequately reimbursed by insurers.
Robotic assisted surgery has been adopted rapidly throughout the world over the past 15 years with millions of cases performed using the da Vinci systems (Intuitive Inc, Sunnyvale, California), the leading robotic technology. As of September, 2016, 3,803 units were installed worldwide (2,501 in the United States, 644 in Europe, 476 in Asia). Initially developed for cardiac surgery, it was soon adopted by urological surgeons who found it ideal for prostatectomy. It then gained significant acceptance with other specialties including gynecology, general surgery, colorectal surgery and thoracic surgery.
Robotic thoracic surgery is a relatively new field that is enjoying extremely rapid adoption from less than 1 percent of lobectomies being performed robotically before 2008 up to 11 percent by 2013 (8,15-17). Several studies have reported on the additional cost of robotic surgery compared to conventional techniques. To date, there have been no large-scale randomized trials comparing robot-assisted surgery to other modalities. Limited observational studies show conflicting short-term outcomes but few benefits in long-term outcomes of robot-assisted surgery over conventional procedures (2).
Barbash in 2010, examined all the cost studies looking at robot-assisted procedures published from 2005 to 2009 and found the mean additional variable cost of using the robot over non-robotic surgeries was about $1,600, or 6% of the overall cost of the procedure in 2007 (15,18). In 2008, Park and Flores reported that RATS lobectomy was associated with increased cost adding on mean $3,981 compared with VATS alone. Surprisingly both VATS and RATS had significantly less cost compared to open thoracotomy (9).
In a study by Swanson using the Premier hospital database, the mean cost for a RATS lobectomy was $25,040.70 versus $20,476.60 for VATS (P<0001). Operating times were longer for RATS than VATS lobectomy (4.49 vs. 4.23 hours; P=0.959) and length of stay was similar (7). In another study comparing results from two institutions with data from the STS database, Farivar described statistically significant improvements for RATS with shorter operative time, chest tube duration and hospital stay than for VATS or thoracotomy (16,19). In one other study of 184 consecutive patients (69 open, 57 robotic, and 58 VATS), Deen and colleagues reported operative time was statistically different among the three modalities, but length of stay was not. There was no statistically significant difference in overall cost between VATS and open cases (difference = $1,207) or open and robotic cases (difference = $1,975). Robotic cases cost $3,182 more than VATS (P<0.001) (6).
We examined the effect of adopting robot-assisted thoracic surgery at TUH which is part of a health system that includes 3 hospitals and has 36,000 annual admissions with an annual budget of $2,000,000,000. At the time of the study, almost all robotic procedures were performed by a single surgeon (first author). Procedures performed included anatomical lung resection, resection of mediastinal tumors, esophagectomy and benign foregut procedures.
At our institution, thoracic surgical robotic procedures had the highest NM compared to other services but a net positive margin was possible only for inpatient procedures. This was especially true for those cases with a high CMI and short length of stay. Interestingly, these findings closely mirror a previously report in 2005 by Resnick and colleagues on the impact of different surgical specialties in an academic center. In their study of surgeon total relative value units (RVUs), they found that among the various surgical specialties, Thoracic Surgery followed by Transplant Surgery were the biggest contributors to hospital margin (17,20). Outpatient robotic procedures were associated with a negative NM for all specialties.
Though our cost comparison for thoracic surgical cases was not made between matched patients we found no obvious increased cost between robotic and non-robotic cases. In fact, the mean total direct costs were $3,510 less for the robotic procedures.
This study is the first to show a comparison of the economic impact of robotics among a variety of surgical services in a large tertiary care center in addition to those factors that may result in a positive net margin. Specifically, cases with a higher CMI, inpatient procedures, short length of stay, and minimal postoperative complications.
Conclusions
High acuity services such as Thoracic Surgery drive higher CM per case as long as variable costs, especially LOS, are kept low. Procedures with lower CMI may not provide a high enough CM to offset the higher fixed and variable costs. Surgical cases performed with the robot in the outpatient setting may incur significant losses and should be done judiciously. Hospitals should preferentially allocate robotic resources to inpatient procedures. Robotic surgical systems have high fixed costs, with capital investment up to $2.5 million for each unit. Surgeons must perform numerous procedures to overcome the “learning curve” and even when they become proficient with the robot the procedures may require more operating time. The systems also require expensive maintenance and upkeep and require the use of additional consumables. The hope is that these new costs may be offset by fewer complications, shorter hospital stay, and possible societal productivity gains with faster return to work.
Acknowledgments
Funding: This research was funded in part through the NIH/NCI Cancer Center Support Grant P30 CA006927.
Ethical Statement: The authors are accountable for all aspects of the work in ensuring that questions related to the accuracy or integrity of any part of the work are appropriately investigated and resolved. The study was approved by the institutional review board (protocol # 24196) and was performed in collaboration with the office of Business Intelligence in the Finance department of Temple Health.
Footnotes
Conflicts of Interest: The author, Abbas E. Abbas, MD is a paid consultant for Boston Scientific, Inc and Intuitive Surgical, Inc. Neither entity was involved in the preparation of this manuscript. The other coauthors have no declared conflicts of interest.
References
- 1.Bolenz C, Freedland SJ, Hollenbeck BK, et al. Costs of radical prostatectomy for prostate cancer: a systematic review. Eur Urol 2014;65:316-24. 10.1016/j.eururo.2012.08.059 [DOI] [PubMed] [Google Scholar]
- 2.Hu JC, Gu X, Lipsitz SR, et al. Comparative effectiveness of minimally invasive vs open radical prostatectomy. JAMA 2009;302:1557-64. 10.1001/jama.2009.1451 [DOI] [PubMed] [Google Scholar]
- 3.Lotan Y, Cadeddu JA, Gettman MT. The new economics of radical prostatectomy: cost comparison of open, laparoscopic and robot assisted techniques. J Urol 2004;172:1431-5. 10.1097/01.ju.0000139714.09832.47 [DOI] [PubMed] [Google Scholar]
- 4.Morgan JA, Thornton BA, Peacock JC, et al. Does robotic technology make minimally invasive cardiac surgery too expensive? A hospital cost analysis of robotic and conventional techniques. J Card Surg 2005;20:246-51. 10.1111/j.1540-8191.2005.200385.x [DOI] [PubMed] [Google Scholar]
- 5.Mouraviev V, Nosnik I, Sun L, et al. Financial comparative analysis of minimally invasive surgery to open surgery for localized prostate cancer: a single-institution experience. Urology 2007;69:311-4. 10.1016/j.urology.2006.10.025 [DOI] [PubMed] [Google Scholar]
- 6.Deen SA, Wilson JL, Wilshire CL, et al. Defining the cost of care for lobectomy and segmentectomy: a comparison of open, video-assisted thoracoscopic, and robotic approaches. Ann Thorac Surg 2014;97:1000-7. 10.1016/j.athoracsur.2013.11.021 [DOI] [PubMed] [Google Scholar]
- 7.Swanson SJ, Miller DL, McKenna RJ, Jr, et al. Comparing robot-assisted thoracic surgical lobectomy with conventional video-assisted thoracic surgical lobectomy and wedge resection: results from a multihospital database (Premier). J Thorac Cardiovasc Surg 2014;147:929-37. 10.1016/j.jtcvs.2013.09.046 [DOI] [PubMed] [Google Scholar]
- 8.Kent M, Wang T, Whyte R, et al. Open, video-assisted thoracic surgery, and robotic lobectomy: review of a national database. Ann Thorac Surg 2014;97:236-42; discussion 242-4. 10.1016/j.athoracsur.2013.07.117 [DOI] [PubMed] [Google Scholar]
- 9.Park BJ, Flores RM. Cost comparison of robotic, video-assisted thoracic surgery and thoracotomy approaches to pulmonary lobectomy. Thorac Surg Clin 2008;18:297-300, vii. 10.1016/j.thorsurg.2008.05.003 [DOI] [PubMed] [Google Scholar]
- 10.Halpern NA, Pastores SM. Critical care medicine in the United States 2000-2005: an analysis of bed numbers, occupancy rates, payer mix, and costs. Crit Care Med 2010;38:65-71. 10.1097/CCM.0b013e3181b090d0 [DOI] [PubMed] [Google Scholar]
- 11.Shander A, Hofmann A, Ozawa S, et al. Activity-based costs of blood transfusions in surgical patients at four hospitals. Transfusion 2010;50:753-65. 10.1111/j.1537-2995.2009.02518.x [DOI] [PubMed] [Google Scholar]
- 12.Vonlanthen R, Slankamenac K, Breitenstein S, et al. The impact of complications on costs of major surgical procedures: a cost analysis of 1200 patients. Ann Surg 2011;254:907-13. 10.1097/SLA.0b013e31821d4a43 [DOI] [PubMed] [Google Scholar]
- 13.Chatterjee A, Payette MJ, Demas CP, et al. Opportunity cost: a systematic application to surgery. Surgery 2009;146:18-22. 10.1016/j.surg.2009.03.027 [DOI] [PubMed] [Google Scholar]
- 14.Laupacis A, Feeny D, Detsky AS, Tugwell PX. How attractive does a new technology have to be to warrant adoption and utilization? Tentative guidelines for using clinical and economic evaluations. CMAJ 1992;146:473-81. [PMC free article] [PubMed] [Google Scholar]
- 15.Paul S, Jalbert J, Isaacs AJ, et al. Comparative Effectiveness of Robotic-Assisted vs Thoracoscopic Lobectomy. Chest 2014;146:1505-12. 10.1378/chest.13-3032 [DOI] [PubMed] [Google Scholar]
- 16.Louie BE, Wilson JL, Kim S, et al. Comparison of Video-Assisted Thoracoscopic Surgery and Robotic Approaches for Clinical Stage I and Stage II Non-Small Cell Lung Cancer Using The Society of Thoracic Surgeons Database. Ann Thorac Surg 2016;102:917-24. 10.1016/j.athoracsur.2016.03.032 [DOI] [PMC free article] [PubMed] [Google Scholar]
- 17.Rajaram R, Mohanty S, Bentrem DJ, et al. Nationwide Assessment of Robotic Lobectomy for Non-Small Cell Lung Cancer. Ann Thorac Surg 2017;103:1092-100. 10.1016/j.athoracsur.2016.09.108 [DOI] [PMC free article] [PubMed] [Google Scholar]
- 18.Barbash GI, Friedman B, Glied SA, et al. Factors associated with adoption of robotic surgical technology in US hospitals and relationship to radical prostatectomy procedure volume. Ann Surg 2014;259:1-6. 10.1097/SLA.0b013e3182a5c8b8 [DOI] [PubMed] [Google Scholar]
- 19.Farivar AS, Cerfolio RJ, Vallieres E, et al. Comparing robotic lung resection with thoracotomy and video-assisted thoracoscopic surgery cases entered into the Society of Thoracic Surgeons database. Innovations (Phila) 2014;9:10-5. 10.1097/imi.0000000000000043 [DOI] [PubMed] [Google Scholar]
- 20.Resnick AS, Corrigan D, Mullen JL, et al. Surgeon contribution to hospital bottom line: not all are created equal. Ann Surg 2005;242:530-7; discussion 537-9. [DOI] [PMC free article] [PubMed] [Google Scholar]


