Abstract
The voltage-gated sodium channel NaV1.6 has recently been found in cardiac myocytes. Emerging studies indicate a role for NaV1.6 in ionic homeostasis as well as arrhythmogenesis. Little is known about the spatial organization of these channels in cardiac muscle, due mainly to the lack of high fidelity antibodies. Therefore, we developed and rigorously validated a novel rabbit polyclonal NaV1.6 antibody and undertook super-resolution microscopy studies of NaV1.6 localization in cardiac muscle. We developed and validated a novel rabbit polyclonal antibody against a C-terminal epitope on neuronal sodium channel 1.6 (NaV1.6). Raw sera showed high affinity in immuno-fluorescence studies, which was improved with affinity purification. The antibody was rigorously validated for specificity via multiple approaches. Lastly, we used this antibody in proximity ligation assay (PLA) and super resolution STORM microscopy studies, which revealed enrichment of NaV1.6 in close proximity to ryanodine receptor (RyR2), a key Ca2+ cycling protein, in cardiac myocytes. In summary, our novel NaV1.6 antibody demonstrates high degrees of specificity and fidelity in multiple preparations. It enabled multimodal microscopic studies, and revealed that over half of the NaV1.6 channels in cardiac myocytes are located within 100 nm of ryanodine receptor Ca2+ release channels.
INTRODUCTION
The NaV1.6 isoform of the voltage-gated sodium channel was first discovered in, and is now a well-established component of the peripheral and central nervous systems(Caldwell, et al., 2000; Wang, et al., 2017). Hence, its common moniker of neuronal sodium channel. Recently, NaV1.6 has been identified within cardiac myocytes, localized near Ca2+ handling machinery in transverse tubules (t-tubules)(Maier, et al., 2004; Radwanski, et al., 2015; Radwański, et al., 2016; Zimmer, et al., 2014). These neuronal channels contribute a small portion of the total sodium current compared to cardiac sodium channels (NaV1.5)(Maier, 2009). However, recent studies indicate that Na+ influx via these channels may disproportionately impact Ca2+ dynamics in both health and disease, via electrogenic Na+ - Ca2+ exchange mediated by the sodium calcium exchanger (NCX)(Helms, et al., 2016; Moreno & Clancy, 2012; Radwanski, et al., 2015; Radwanski, et al., 2013; Radwański, et al., 2016; Sato, et al., 2017). Further, these studies suggest that such a role for NaV1.6 may be predicated upon its physical proximity to Ca2+ cycling proteins within t-tubules(Radwanski, et al., 2018; Veeraraghavan, et al., 2017). Thus, there is a significant need to understand the spatial organization of NaV1.6 within cardiac myocytes, particularly in relation to Ca2+ cycling proteins.
Super-resolution microscopy techniques, which are ideally suited to address this problem, require high fidelity antibodies against target proteins. Therefore, we undertook development of a novel antibody against NaV1.6 in order to facilitate investigation of NaV1.6 localization in the heart and other tissues. Following an approach previously applied to sodium channel NaV1.5 with significant success(Veeraraghavan, et al., 2018), we raised a rabbit polyclonal antibody against a C-terminal epitope on NaV1.6. Through the use of a variety of strategies, we demonstrate that this antibody recognizes NaV1.6 with high avidity and selectivity. Finally, we use this novel tool in super-resolution microscopy experiments to demonstrate for the first time that over half of the NaV1.6 channels in cardiac myocytes are located within 100 nm of ryanodine receptor Ca2+ release channels.
METHODS
All animal procedures were approved by The Ohio State University Institutional Animal Care and Use Committee and conformed to the Guide for the Care and Use of Laboratory Animals published by the U.S. National Institutes of Health (NIH Publication No. 85–23, revised 2011).
Custom NaV1.6 Antibody Development:
Development of a custom rabbit polyclonal antibody was undertaken as previously described(Veeraraghavan, et al., 2018). Our novel antibody was raised against a C-terminal epitope on NaV1.6: “ENGGTHREKKESTP”, which correspond to amino acids 1926 – 1939 on human NaV1.6 (figure 1). A C-terminal epitope was selected to enable easy access for antibody binding. Further, this specific region was chosen based on its uniqueness to NaV1.6 (compared to other NaV1.x proteins) and high degree of conservation across mammalian species. A BLAST search revealed a highly significant (E = 3 × 10⁻⁷) correspondence between this epitope and the NaV1.6 protein from various species but no significant similarities (E > 3) to other known protein sequences.
Figure 1. NaV1.6 C-terminal epitope.
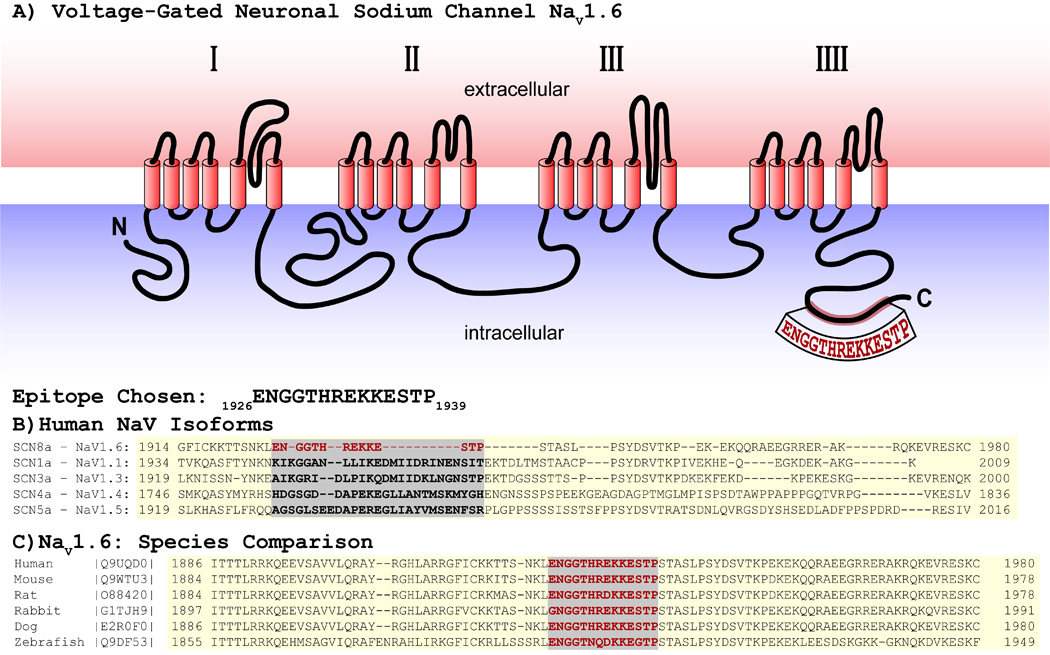
A) Schematic showing location of epitope on the NaV1.6 C-terminus. B) Comparison of NaV isoforms. C) Comparison with other species.
Immunization and care of rabbits, collection of sera, and affinity purification of the antibody were performed by Pierce Custom Antibody Services (ThermoFisher Inc). A New Zealand white rabbit was immunized with a peptide corresponding to the epitope with subsequent immunizations at 14, 42, 56, 104, 159, and 222 days after the initial immunization. Serum was collected prior to immunization (day 0) and at days 28, 56, 70, 72, 118, 120, 173, 236 and 238 following initial immunization. Each serum sample was individually evaluated for immunoreactivity in confocal immuno-fluorescence studies using murine cardiac sections with the day 0 serum evaluated as a nonspecific background control. The serum from day 173 showed the strongest immunoreactivity (figure 2) and was hence selected for affinity purification. Affinity purification was performed using a purpose-built immobilized antigen column and the purified antibody evaluated by ELISA. The concentration of the purified antibody was measured at 0.1 mg/ml.
Figure 2. Rabbit Polyclonal anti-NaV1.6 Antibody – Raw Serum:
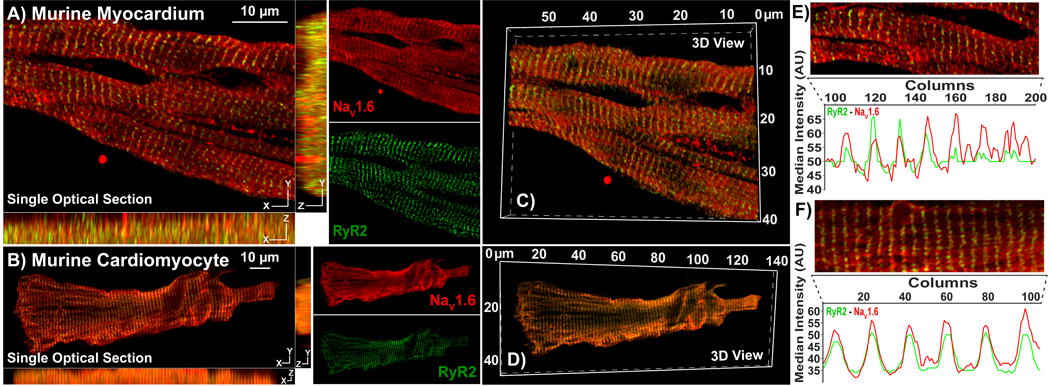
Representative Confocal images from A) myocardial sections, and B) isolated cardiac myocytes immunolabeled using our rabbit polyclonal NaV1.6 antibody (raw serum; red) and a mouse monoclonal RyR2 antibody (green). Single optical sections (XY) are presented along with orthogonal projections (YZ, XZ) as well as images of individual fluorescence channels. C, D) 3D views of the same samples. E, F) Intensity profiles demonstrate striated pattern of NaV1.6 immunosignals closely associating with RyR2 immunosignal
Mouse models:
WT mice (C57BL6 background; Cat. #000664) and global NaV1.6 KO mice (C3Fe.Cg background; Cat. #003798) were purchased from Jackson Laboratories. Cardiac-specific NaV1.6 KO mice (cNaV1.6KO) were obtained by crossing C57BL6 mice with loxP sites flanking Exon 1 of the Scn8a gene (custom generated by the University of Utah Transgenic and Gene Targeting Core and the University of Utah Mutation Generation and Detection Core) with mice expressing cre driven by cardiac-specific alpha myosin-heavy chain (Myh6) promoter (Jackson Laboratories Cat. #011038).
Tissue Collection and Myocyte isolation:
Male C57/BL6 mice (30 grams, 6–18 weeks) were anesthetized with 5% isoflurane mixed with 100% oxygen (1 l/min). After loss of consciousness, anesthesia was maintained with 3–5% isoflurane mixed with 100% oxygen (1 l/min). Once the animal was in a surgical plane of anesthesia, the heart was excised and frozen for cryosectioning or perfused (at 40–55 mm Hg) using Langendorff preparations with oxygenated Tyrode’s solution (containing, in mM: NaCl 140, KCl 5.4, MgCl2 0.5, dextrose 5.6, HEPES 10; pH adjusted to 7.4) at 37°C as previously described(Radwanski, et al., 2015; Radwanski, et al., 2010; Veeraraghavan, et al., 2018; Veeraraghavan, et al., 2015; Veeraraghavan & Poelzing, 2008). Cardiac myocytes were isolated via enzymatic digestion, plated on laminin-coated glass coverslips, fixed with 2% paraformaldehyde (PFA) for 5 min, washed in PBS (3 × 10 minutes) and stored in PBS at 4°C for immunolabeling.
Cell culture:
Native Chinese hamster ovarian cells (CHO) modified to stably express either NaV1.5 or NaV1.6 sodium channels were plated on laminin-coated glass coverslips and maintained in culture in F-12 HAM media at 37°C under a 5% O2, 95% CO2 atmosphere. Once at 50% confluence, the cells were fixed with 2% PFA for 5 min, washed in PBS (3 × 10 minutes), and stored in PBS at 4°C for immunolabeling.
Fluorescent Immunolabeling:
Immuno-fluorescent labeling of PFA-fixed tissue sections (5 μm) and cells was performed, as previously described (Koleske, et al., 2018; Radwański, et al., 2016; Veeraraghavan, et al., 2018; Veeraraghavan, et al., 2015). Briefly, samples were permeabilized with Triton X-100 (0.2% in PBS for 15 minutes at room temperature) and treated with blocking agent (1% BSA, 0.1% triton in PBS for 2 hours at room temperature) prior to labeling with primary antibodies (overnight at 4°C). Ryanodine receptors were labeled with a mouse monoclonal antibody (Cat #: MA3–916) from Invitrogen (Rockford, IL) and β-tubulin III was labeled using a mouse monoclonal antibody (Cat #: MAB5564) from Millipore Sigma (St. Louis, MO). Samples were then washed in PBS (3 × 5 minutes in PBS at room temperature) prior to labeling with secondary antibodies. For confocal microscopy, samples were then labeled with goat anti-rabbit AlexaFluor 568 (1:4000; ThermoFisher Scientific, Grand Island, NY) and goat anti-mouse AlexaFluor 488 (1:4000; ThermoFisher Scientific, Grand Island, NY) secondary antibodies. Samples were then washed in PBS (3 × 5 minutes in PBS at room temperature) and mounted in ProLong Gold (Invitrogen, Rockford, IL). For proximity ligation assay (PLA), samples were labeled using appropriate Duolink secondary antibodies (Sigma, St. Louis, MO) per manufacturer’s instructions(Radwański, et al., 2016). Briefly, this assay uses complementary oligonucleotide-labeled secondary antibodies, which undergo ligation when co-labeled proteins are located <40 nm apart, to detect protein-protein interactions with high sensitivity. For super resolution STochastic Optical Reconstruction Microscopy (STORM), samples were labeled with goat anti-mouse Alexa 647 (1:4000) and goat anti-rabbit Biotium CF 568 (1:4000) secondary antibodies (ThermoFisher Scientific, Grand Island, NY). Samples were then washed in PBS (3 × 5 minutes in PBS at room temperature) and stored in Scale U2 buffer for 48 hours at 4°C (Veeraraghavan & Gourdie, 2016; Veeraraghavan, et al., 2018; Veeraraghavan, et al., 2016).
Confocal Microscopy:
Confocal imaging was performed using an A1R-HD laser scanning confocal microscope equipped with four solid-state lasers (405 nm, 488 nm, 560 nm, 640 nm, 30 mW each), a 63×/1.4 numerical aperture oil immersion objective, two GaAsP detectors, and two high sensitivity photomultiplier tube detectors (Nikon, Melville, NY). Individual fluorophores were imaged sequentially with the excitation wavelength switching at the end of each frame.
Western Immunoblotting:
Whole cell lysates were prepared from frozen WT mouse hearts as previously described(Koleske, et al., 2018; Veeraraghavan, et al., 2018). These were electrophoresed on 4–15% TGX Stain-free gels (BioRad, Hercules, CA) before being transferred onto a nitrocellulose membrane. The membranes were probed with our novel rabbit polyclonal antibody against NaV1.6 as well as mouse monoclonal antibody against GAPDH (loading control; Fitzgerald Industries, Acton, MA), followed by goat anti-rabbit and goat anti-mouse HRP-conjugated secondary antibodies (Promega, Madison, WI). Signals were detected by chemiluminescence using SuperSignal West Femto Extended Duration Substrate (ThermoFisher Scientific, Grand Island, NY) and imaged using a Chemidoc MP imager (BioRad, Hercules, CA).
STORM Super-resolution Imaging:
STORM imaging was performed as previously described (Bonilla, et al., 2019; Veeraraghavan & Gourdie, 2016; Veeraraghavan, et al., 2018). Briefly, imaging was performed using a Vutara 352 microscope (Bruker Nano Surfaces, Middleton, WI) equipped with biplane 3D detection, and fast sCMOS imaging achieving 20 nm lateral and 50 nm axial resolution. Individual fluorophore molecules were localized with a precision of 10 nm. Registration of the two color channels was accomplished using localized positions of several TetraSpeck Fluorescent Microspheres (ThermoFisher Scientific, Carlsbad, CA) scattered throughout the field of view. The images were quantitatively analyzed using STORM-RLA as previously described(Veeraraghavan & Gourdie, 2016).
RESULTS
NaV1.6 antibody development – Epitope Selection:
In order to facilitate the investigation of the NaV1.6 neuronal sodium channel isoform in the heart and other tissues, we developed a novel, high affinity rabbit polyclonal antibody against a C-terminal epitope on NaV1.6 (figure 1). The region from amino acid 1926 to 1939 on the NaV1.6 C-terminus was chosen based on its uniqueness compared to other NaV isoforms (figure 1B). Additionally, this region is conserved across NaV1.6 from several mammalian species (figure 1C). Further, a BLAST search for this sequence yielded no significant results, affirming its specificity for NaV1.6.
Validation of NaV1.6 Antibody:
Raw sera, collected from rabbits 173 days following immunization, showed strong immuno-fluorescent signal (red) in a striated pattern with moderately low background in laser-scanning confocal microscopy images of transmural sections from murine ventricular myocardium (figure 2A) and in isolated murine cardiomyocytes (figure 2B). In both cases, NaV1.6 immuno-fluorescent signals demonstrated close association (indicated by yellow pixels in the overlay images) with ryanodine receptor 2 (RyR2; green), which is enriched at t-tubules(Radwański, et al., 2016). The periodic, striated expression pattern of NaV1.6 and RyR2, as well as their close association, are illustrated by intensity profiles generated from a single optical section in figure 2E, F. Orthogonal projections and 3D renderings demonstrate that the close association between NaV1.6 and RyR2 was consistent along the X, Y and Z dimensions (figures 2A – D) in both tissue and isolated myocytes.
Selectivity of the antibody for the NaV1.6 isoform was tested using Chinese hamster ovary (CHO) cells stably expressing either NaV1.6 (CHO- NaV1.6), or NaV1.5 (CHO- NaV1.5) isoform of voltage-gated sodium channels. The NaV1.5 isoform was chosen for this comparison given that it is the most abundant sodium channel protein in cardiac muscle. CHO- NaV1.6 cells expressed strong immuno-fluorescent signal (red) at the cell borders and within perinuclear regions (nuclei in blue) (figure 3A, B), while CHO- NaV1.5 cells revealed minimal immuno-fluorescent signal (figure 3C, D).
Figure 3. Antibody Specificity in heterologous expression system:
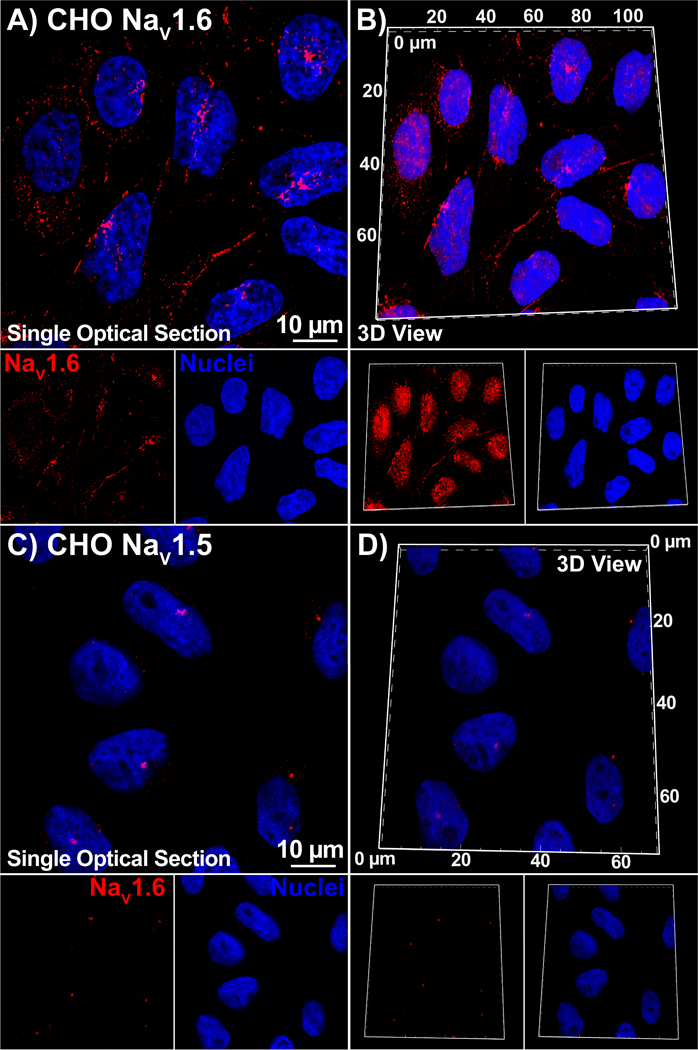
Single optical sections and 3D views of confocal images from CHO cells stably expressing NaV1.6 (A, B) or NaV1.5 (C, D) labeled with our NaV1.6 antibody (raw serum; red) as well as a DAPI nuclear stain (blue).
Next, we sought to improve the signal-to-background characteristics of our antibody through affinity purification. In lasers-canning confocal microscopy images of transmural sections from murine ventricular myocardium (figure 4A) and in isolated murine cardiomyocytes (figure 4B), the purified antibody maintained strong immuno-fluorescent signal (red) in a striated pattern as seen with the raw sera. However, the level of background fluorescence was markedly reduced. The close association between NaV1.6 and RyR2 immuno-fluorescent signals was maintained and became more apparent with the reduced background signal of the purified sera. The periodic, striated expression pattern of NaV1.6 and RyR2, as well as their close association, are illustrated by intensity profiles generated from a single optical section in figure 4E, F. Once again, orthogonal projections and 3D renderings demonstrate that the close association between NaV1.6 and RyR2 was consistent in all three dimensions (figures 4A – D) in both tissue and isolated myocytes. In a further experiment, murine ventricular sections were labeled with the purified antibody in the presence of a peptide corresponding to its epitope (5x the immunoglobulin concentration of the purified antibody). The peptide abrogated the NaV1.6 immuno-fluorescent signal (red) indicating a high specificity of the purified antibody to the targeted epitope (figure 5A–B).
Figure 4. Rabbit Polyclonal anti-NaV1.6 Antibody – Affinity Purified:

Representative Confocal images from A) myocardial sections, and B) isolated cardiac myocytes immunolabeled using our rabbit NaV1.6 antibody (raw serum; red) and a mouse monoclonal RyR2 antibody (green). Single optical sections (XY) are presented along with orthogonal projections (YZ, XZ) as well as images of individual fluorescence channels. C, D) 3D views of the same samples. E, F) Intensity profiles demonstrate striated pattern of NaV1.6 immunosignals closely associating with RyR2 immunosignals.
Figure 5. Antibody Specificity – Peptide inhibition.
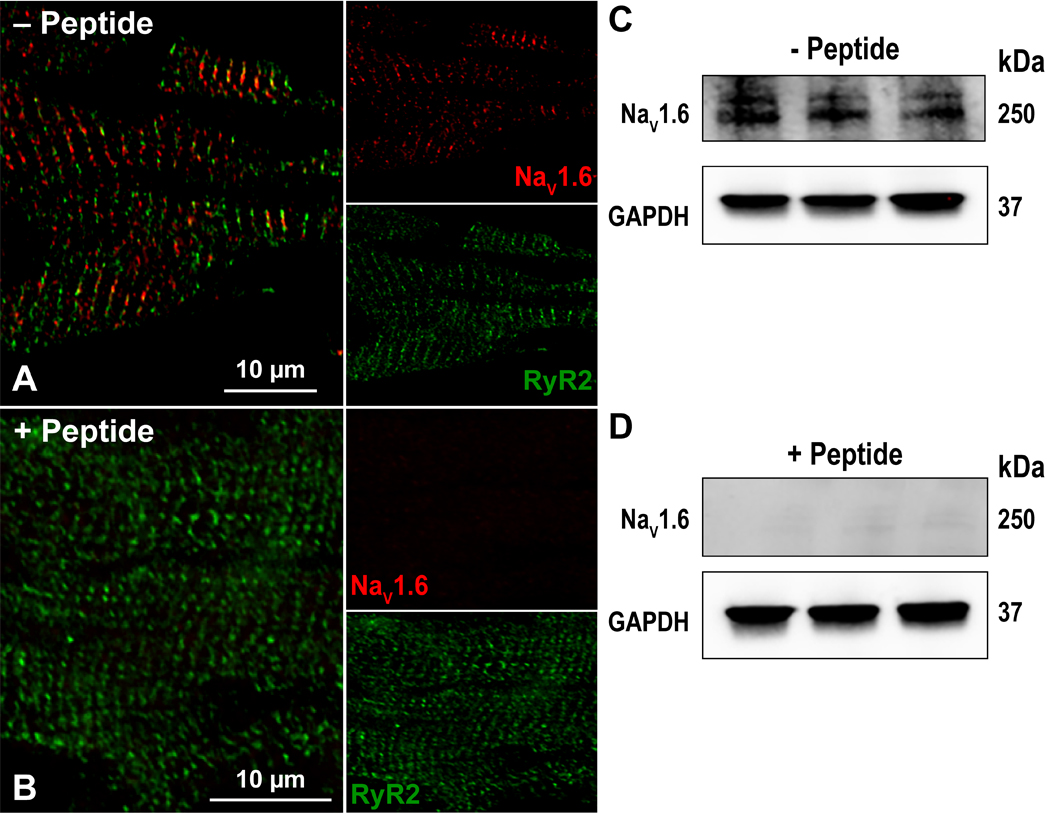
Confocal images of myocardial sections immunolabeled with for RyR2 (green) and NaV1.6 (red) in the A) absence and B) presence of a peptide corresponding to the NaV1.6 C-terminal epitope. Western immunoblots of whole cell lysates of three WT murine hearts (1 per lane) in the C) absence and D) presence of a peptide corresponding to the NaV1.6 C-terminal epitope. In both cases, GAPDH was detected as a loading control.
Additionally, we validated our antibody in Western blot studies of whole cell lysates of adult murine myocardium. The antibody detected a distinct band at 250 kD, consistent with the predicted molecular weight of the Nav1.6 protein (figure 5C; larger representation in supplemental figure 1). Furthermore, this band was abrogated in the presence of the peptide corresponding to the epitope (figure 5D). These results are congruent with those from the immuno-labeling studies, and further validate the specificity of our antibody.
Further validation of NaV1.6 isoform selectivity of our antibody was performed using mice with a global loss of NaV1.6 (NaV1.6 KO; figure 6C, F) as well as mice with cardiac-specific loss of NaV1.6 (cNaV1.6 KO; figure 6B, E). Confocal microscopy images of transmural cardiac sections from both knockout mice revealed near total attenuation of NaV1.6 immuno-fluorescent signal (figure 6B). Further validation was undertaken through immuno-fluorescent staining of brain sections from these mice. NaV1.6 immuno-fluorescent signals were apparent in brain sections from WT and cNaV1.6 KO mice, where they demonstrated close association with β-tubulin (figure 6D, E). However, NaV1.6 immuno-fluorescent signals could not be observed in the global NaV1.6 KO brain tissue (figure 6F). These data are consistent with our antibody demonstrating specific reactivity to NaV1.6 in both heart and brain tissue.
Figure 6. Antibody Specificity – KO models:
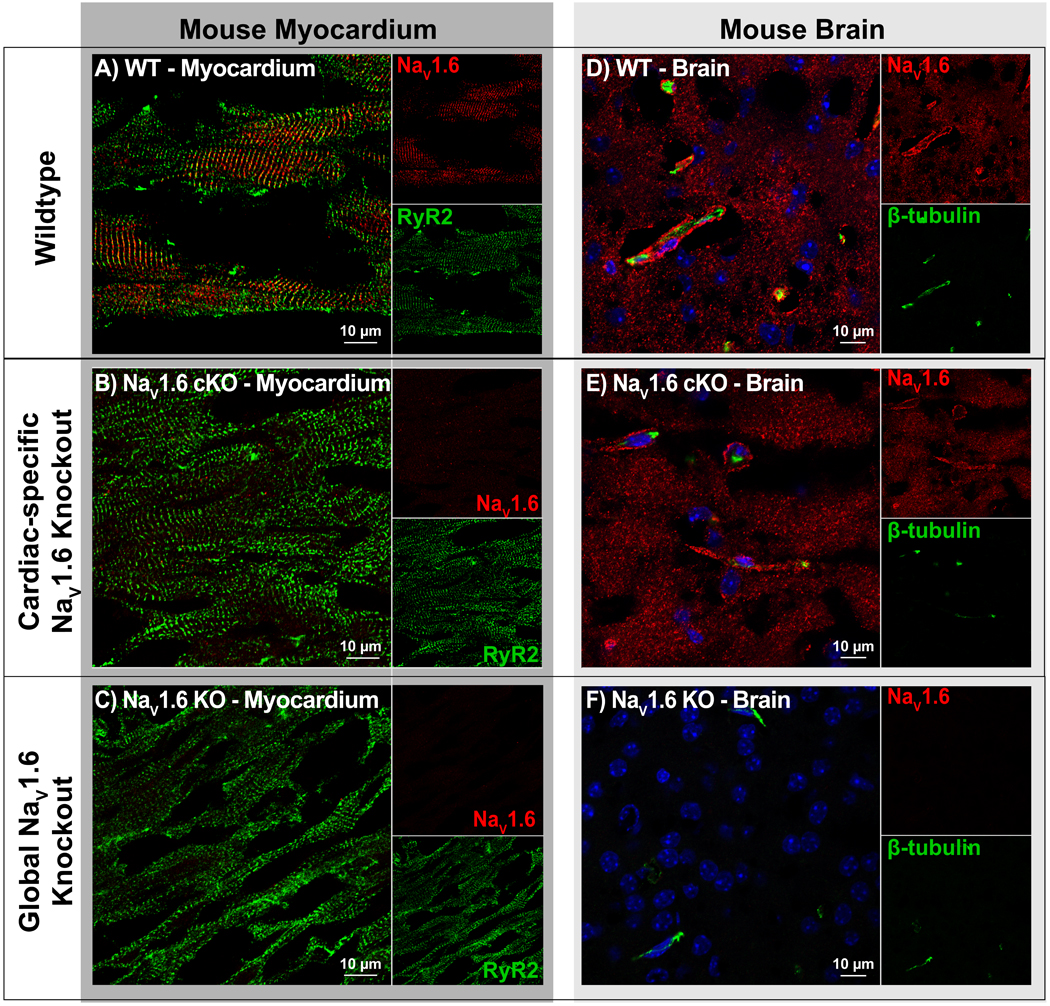
A-C) Confocal images of cardiac sections from WT, cardiac-specific NaV1.6 KO (NaV1.6 cKO) and global NaV1.6 KO mice, labeled for NaV1.6 (red) and RyR2 (green). Clear NaV1.6 immunosignal was observed in WT but not NaV1.6 cKO or NaV1.6 KO. D-F) Confocal images of brain sections labeled for NaV1.6 (red) and β-tubulin (green) show clear NaV1.6 immunosignal in WT and NaV1.6 cKO but not NaV1.6 KO samples.
NaV1.6 Localization in Cardiac Myocytes:
In order to evaluate NaV1.6 localization relative to Ca2+ cycling machinery, we performed a proximity ligation assay (PLA) to detect close approximation of NaV1.6 with RyR2 (figure 7). This assay generates a punctate signal at sites where co-labeled proteins are located within 40 nm of each other(Weibrecht, et al., 2010). An overlay of a confocal image of NaV1.6-RyR2 PLA signal (green puncta), and DAPI nuclear stain (blue) with differential interference contrast showing myocyte topology (grayscale) is provided in figure 7. This demonstrates the high frequency of close association between NaV1.6 and RyR2 with a striated distribution consistent with t-tubular localization. This concurs with previous studies suggesting colocalization of neuronal sodium channels, including NaV1.6, with RyR2(Radwański, et al., 2016).
Figure 7. Proximity ligation assay.
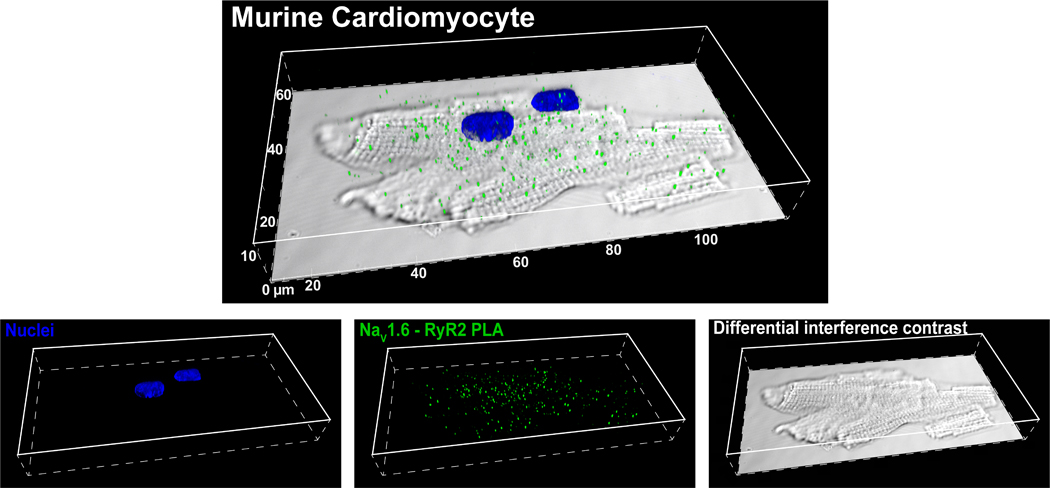
Confocal images of NaV1.6 -RyR2 PLA signals (green) and nuclei (blue) overlaid on a differential interference contrast image of an isolated cardiac myocyte.
Lastly, we performed stochastic optical reconstruction microscopy (STORM) on murine ventricular sections to quantitatively assess relative localization of NaV1.6 and RyR2 with sub-diffraction resolution. STORM affords 20 nm lateral and <50 nm axial resolution; however, it requires high fidelity antibodies to achieve sufficient signal-to-noise ratios. A representative 3D STORM image in figure 8A, demonstrates both NaV1.6 (green) and RyR2 (red) molecules organizing into dense clusters, arrayed in a striated pattern. This is consistent with closely associated clusters of NaV1.6 and RyR2 localized along t-tubules. Results from quantitative analysis of these data using STORM-based relative localization analysis (STORMRLA), a machine learning-based approach(Veeraraghavan & Gourdie, 2016), are presented in the form of a bivariate histogram in figure 8B. Low density NaV1.6 clusters were preferentially localized within 100 nm of RyR2 clusters but could also be identified at larger distances from RyR2. In contrast, high density NaV1.6 clusters were exclusively localized within 50 nm of RyR2 clusters. Overall, 40 ± 4% of NaV1.6 clusters were located within 50 nm of RyR2 clusters with an additional 25 ± 2% located between 50 and 100 nm from RyR2 clusters. These data indicate very close spatial approximation of NaV1.6 with RyR2 in cardiac muscle.
Figure 8. Super Resolution STORM imaging.
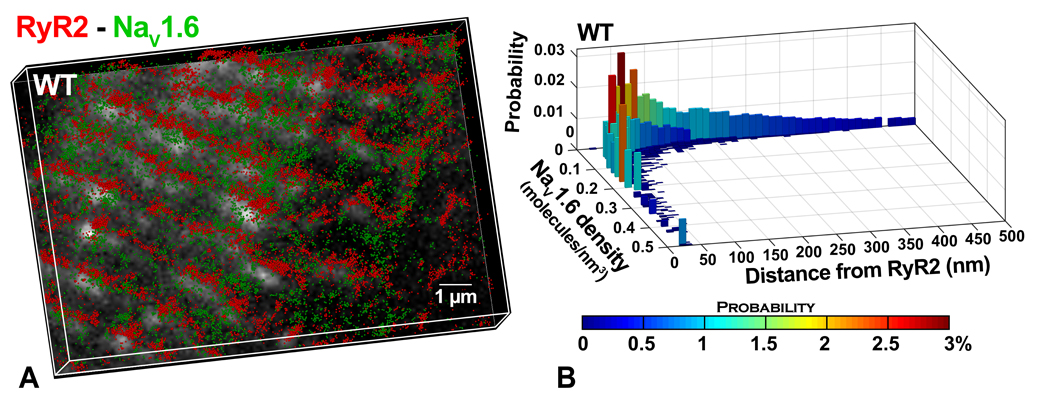
A) Representative STORM image of RyR2- NaV1.6 from murine myocardium. Lateral resolution of 20 nm and axial resolution of <50 nm were achieved. Each localized molecule is represented as a 50 nm sphere for easy visualization. B) Results from STORM-RLA(Veeraraghavan & Gourdie, 2016) quantification: bivariate histogram of NaV1.6 cluster density versus distance from the closest RyR2 cluster.
DISCUSSION
Voltage-gated sodium channel isoforms such as NaV1.6, which are expressed ubiquitously in the nervous system, are also present within the myocardium. Thus, they have been of interest in a wide range of physiological and pathophysiological contexts. The absence of quantitative, high resolution data on their localization relative to Ca2+ handling machinery in cardiac myocytes, stemming from a lack of high fidelity antibodies, has remained a significant barrier to understanding their functional roles. Here we present results demonstrating the high avidity and specificity of a novel rabbit polyclonal antibody against the C-terminal epitope on NaV1.6. Further, we utilized this antibody to demonstrate enrichment of NaV1.6 in close proximity (<100 nm) of RyR2 Ca2+ release channels.
Our novel antibody was raised against a 12 amino acid sequence from the C-terminal domain of NaV1.6, which displays a high degree of conservation across multiple mammalian species, while being unique relative to other sodium channel isoforms. Such a C-terminal epitope enables easy access for the antibody given its cytoplasmic location and lack of highly ordered protein structure. Additionally, this sequence possesses favorable chemical properties when synthesized as a peptide such as high water solubility and lack of known binding motifs. Therefore, this region of NaV1.6 was selected as an ideal target for antibody development.
The antibody was validated based on four different criteria: signal to noise ratio, pattern of localization, specificity, and affinity. In confocal microscopy experiments, the raw antibody-containing serum demonstrated clear immunosignals with low background in both cellular and tissue preparations. These properties of the antibody were notably enhanced following affinity purification. These signals demonstrated a striated pattern of localization which coincided with ryanodine receptor calcium release channels (RyR2), consistent with previous studies of neuronal sodium channels in the heart (Maier, et al., 2004; Radwański, et al., 2016; Radwanski & Poelzing, 2011). These studies reported neuronal channels localizing to the transverse tubules of cardiac myocytes along with Ca2+ handling proteins such as RyR2. Thus, RyR2 was identified as a suitable protein to co-label in our antibody validation studies. Next, we validated the specificity and isoform selectivity of our antibody using multiple orthogonal approaches. The immunoreactivity of our antibody in both immunofluorescence and immunoblot studies was abrogated upon incubation with a peptide corresponding to its epitope target. In immunoblot studies, multiple bands were observed at and near the predicted weight of NaV1.6. This is consistent with previous observations for ion channel proteins, particularly sodium channels(Clatot, et al., 2017; van Bemmelen, et al., 2004), where multiple bands were observed on Western blots, likely reflecting post translational modifications. Additional experiments using heterologous expression systems and genetically modified mice with global or cardiac specific knockout of NaV1.6 provided further evidence of specificity. Notably, the antibody displayed avidity and specificity in both brain and heart tissue in these experiments, enhancing confidence in our results and indicating broad utility of the antibody.
Although previous studies identified NaV1.6 at the t-tubules of cardiac myocytes, they lacked the resolution to determine whether NaV1.6 closely associated with Ca2+ handling proteins at the nanoscale. Armed with a high affinity and sensitivity antibody, we were able to assess the unique organization of NaV1.6 in cardiomyocytes at the nanoscale using proximity ligation assay (PLA) and STORM super-resolution microscopy. Punctate signals generated by PLA, corresponding to sites of close association between NaV1.6 and RyR2, displayed noticeable alignment with t-tubules (identified from DIC). This was consistent with the striated pattern of NaV1.6 and RyR2 localization observed using STORM. The low background noise observed in the STORM images, enabled by the high fidelity of our antibody, allowed NaV1.6-RyR2 relative localization to be quantitatively assessed at the nanoscale. Machine learning-based cluster detection and STORM-RLA(Veeraraghavan & Gourdie, 2016) quantification revealed over 60% of NaV1.6 clusters are located within 100 nm of RyR2. To our knowledge, this is the first such quantitative assessment of NaV1.6 localization in cardiac muscle at sub-diffraction resolution. Importantly, these results identify NaV1.6 as a component of the Ca2+ cycling nanodomain, capable of influencing Ca2+ cycling via NCX. This supports a role for NaV1.6 in modulating normal Ca2+ cycling in health as well as in contributing to abnormal, arrhythmogenic Ca2+ release in disease.
In summary, we present a novel high affinity and specificity antibody which may be used to dissect the role of NaV1.6 within cardiac nanodomains. We provide multiple lines of evidence demonstrating its selectivity and specificity in both brain and heart. Lastly, we utilized this high fidelity antibody to quantitatively demonstrate for the first time that over half of the NaV1.6 channels in cardiac myocytes reside within 100 nm of ryanodine receptor Ca2+ release channels.
Supplementary Material
Acknowledgements
The authors thank the University of Utah Transgenic and Gene Targeting Core and the University of Utah Mutation Generation and Detection Core for generation of cardiac-specific NaV1.6 knockout mice.
Sources of Funding: The study was supported by National Institutes of Health grants R01-HL074045, R01-HL063043, and R01-HL138579 awarded to S.G.; R00-HL127299 and an American Heart Association Transformational Project Award 19TPA34910191 to P.B.R.; and an American Heart Association Scientist Development Grant 16SDG29870007 awarded to R.V.
ABBREVIATIONS
- NaV1.6
Pore-forming subunit of the neuronal voltage-gated sodium channel
- NaV1.5
Pore-forming subunit of the cardiac voltage-gated sodium channel
- Ca2+
Calcium
- PLA
Proximity ligation assay
- RyR2
Ryanodine receptor
- NCX
Sodium calcium exchanger
- STORM
Stochastic optical reconstruction microscopy
- PBS
Phosphate-buffered saline
- PFA
paraformaldehyde
- CHO
Chinese hamster ovarian cells
- CHO- NaV1.5
Chinese hamster ovarian cells expressing NaV1.5
- CHO- NaV1.6
Chinese hamster ovarian cells expressing NaV1.6 t-tubules – transverse tubules
- NaV1.6 KO
global knockout of NaV1.6
- cNaV1.6KO
cardiac-specific knockout of NaV1.6
- WT
Wild-type, β1 +/+
- LSCM
Laser-scanning Confocal Microscopy
- STORM-RLA
STORM-based relative localization analysis
- TEM
Transmission electron microscopy
Footnotes
Disclosures
None.
REFERENCES
- BONILLA IM, BELEVYCH AE, BAINE S, STEPANOV A, MEZACHE L, BODNAR T, LIU B, VOLPE P, PRIORI S, WEISLEDER N, SAKUTA G, CARNES CA, RADWANSKI PB, VEERARAGHAVAN R & GYORKE S (2019). Enhancement of Cardiac Store Operated Calcium Entry (SOCE) within Novel Intercalated Disk Microdomains in Arrhythmic Disease. Sci Rep 9(1), 10179. [DOI] [PMC free article] [PubMed] [Google Scholar]
- CALDWELL JH, SCHALLER KL, LASHER RS, PELES E & LEVINSON SR (2000). Sodium channel Na(v)1.6 is localized at nodes of ranvier, dendrites, and synapses. Proceedings of the National Academy of Sciences of the United States of America 97(10), 5616–5620. [DOI] [PMC free article] [PubMed] [Google Scholar]
- CLATOT J, HOSHI M, WAN X, LIU H, JAIN A, SHINLAPAWITTAYATORN K, MARIONNEAU C, FICKER E, HA T & DESCHENES I (2017). Voltage-gated sodium channels assemble and gate as dimers. Nat Commun 8(1), 2077. [DOI] [PMC free article] [PubMed] [Google Scholar]
- HELMS AS, ALVARADO FJ, YOB J, TANG VT, PAGANI F, RUSSELL MW, VALDIVIA HH & DAY SM (2016). Genotype-Dependent and -Independent Calcium Signaling Dysregulation in Human Hypertrophic Cardiomyopathy. Circulation 134(22), 1738–1748. [DOI] [PMC free article] [PubMed] [Google Scholar]
- KOLESKE M, BONILLA I, THOMAS J, ZAMAN N, BAINE S, KNOLLMANN BC, VEERARAGHAVAN R, GYORKE S & RADWANSKI PB (2018). Tetrodotoxin-sensitive Navs contribute to early and delayed afterdepolarizations in long QT arrhythmia models. The Journal of general physiology. [DOI] [PMC free article] [PubMed] [Google Scholar]
- MAIER LS (2009). A novel mechanism for the treatment of angina, arrhythmias, and diastolic dysfunction: inhibition of late I(Na) using ranolazine. Journal of cardiovascular pharmacology 54(4), 279–286. [DOI] [PMC free article] [PubMed] [Google Scholar]
- MAIER SK, WESTENBROEK RE, MCCORMICK KA, CURTIS R, SCHEUER T & CATTERALL WA (2004). Distinct subcellular localization of different sodium channel alpha and beta subunits in single ventricular myocytes from mouse heart. Circulation 109(11), 1421–1427. [DOI] [PubMed] [Google Scholar]
- MORENO JD & CLANCY CE (2012). Pathophysiology of the cardiac late Na current and its potential as a drug target. Journal of molecular and cellular cardiology 52(3), 608–619. [DOI] [PMC free article] [PubMed] [Google Scholar]
- RADWANSKI PB, BRUNELLO L, VEERARAGHAVAN R, HO HT, LOU Q, MAKARA MA, BELEVYCH AE, ANGHELESCU M, PRIORI SG, VOLPE P, HUND TJ, JANSSEN PM, MOHLER PJ, BRIDGE JH, POELZING S & GYORKE S (2015). Neuronal Na+ channel blockade suppresses arrhythmogenic diastolic Ca2+ release. Cardiovascular research 106(1), 143–152. [DOI] [PMC free article] [PubMed] [Google Scholar]
- RADWANSKI PB, GREER-SHORT A & POELZING S (2013). Inhibition of Na(+) channels ameliorates arrhythmias in a drug-induced model of Andersen-Tawil syndrome. Heart rhythm : the official journal of the Heart Rhythm Society 10(2), 255–263. [DOI] [PubMed] [Google Scholar]
- RADWAŃSKI PB, HO H-T, VEERARAGHAVAN R, BRUNELLO L, LIU B, BELEVYCH AE, UNUDURTHI SD, MAKARA MA, PRIORI SG, VOLPE P, ARMOUNDAS AA, DILLMANN WH, KNOLLMANN BC, MOHLER PJ, HUND TJ & GYÖRKE S (2016). Neuronal Na+ Channels Are Integral Components of Pro-Arrhythmic Na+/Ca2+ Signaling Nanodomain That Promotes Cardiac Arrhythmias During β-Adrenergic Stimulation. JACC: Basic to Translational Science 1(4), 251266. [DOI] [PMC free article] [PubMed] [Google Scholar]
- RADWANSKI PB, JOHNSON CN, GYORKE S & VEERARAGHAVAN R (2018). Cardiac Arrhythmias as Manifestations of Nanopathies: An Emerging View. Front Physiol 9, 1228. [DOI] [PMC free article] [PubMed] [Google Scholar]
- RADWANSKI PB & POELZING S (2011). NCX is an important determinant for premature ventricular activity in a drug-induced model of Andersen-Tawil syndrome. Cardiovascular research 92(1), 57–66. [DOI] [PMC free article] [PubMed] [Google Scholar]
- RADWANSKI PB, VEERARAGHAVAN R & POELZING S (2010). Cytosolic calcium accumulation and delayed repolarization associated with ventricular arrhythmias in a guinea pig model of Andersen-Tawil syndrome. Heart rhythm : the official journal of the Heart Rhythm Society 7(10), 1428–1435. [DOI] [PubMed] [Google Scholar]
- SATO D, CLANCY CE & BERS DM (2017). Dynamics of sodium current mediated early afterdepolarizations. Heliyon 3(9), e00388. [DOI] [PMC free article] [PubMed] [Google Scholar]
- VAN BEMMELEN MX, ROUGIER JS, GAVILLET B, APOTHELOZ F, DAIDIE D, TATEYAMA M, RIVOLTA I, THOMAS MA, KASS RS, STAUB O & ABRIEL H (2004). Cardiac voltage-gated sodium channel Nav1.5 is regulated by Nedd4–2 mediated ubiquitination. Circulation research 95(3), 284–291. [DOI] [PubMed] [Google Scholar]
- VEERARAGHAVAN R & GOURDIE R (2016). Stochastic Optical Reconstruction Microscopy-based Relative Localization Analysis (STORM-RLA) for Quantitative Nanoscale Assessment of Spatial Protein Organization. Molecular biology of the cell 27(22), 3583–3590. [DOI] [PMC free article] [PubMed] [Google Scholar]
- VEERARAGHAVAN R, GYORKE S & RADWANSKI PB (2017). Neuronal sodium channels: emerging components of the nanomachinery of cardiac calcium cycling. The Journal of physiology. [DOI] [PMC free article] [PubMed] [Google Scholar]
- VEERARAGHAVAN R, HOEKER GS, ALVAREZ-LAVIADA A, HOAGLAND D, WAN X, KING DR, SANCHEZ-ALONSO J, CHEN C, JOURDAN J, ISOM LL, DESCHENES I, SMYTH J, GORELIK J, POELZING S & GOURDIE RG (2018). The adhesion function of the sodium channel beta subunit (beta1) contributes to cardiac action potential propagation. Elife 7. [DOI] [PMC free article] [PubMed] [Google Scholar]
- VEERARAGHAVAN R, LIN J, HOEKER GS, KEENER JP, GOURDIE RG & POELZING S (2015). Sodium channels in the Cx43 gap junction perinexus may constitute a cardiac ephapse: an experimental and modeling study. Pflugers Arch 467(10), 2093–2105. [DOI] [PMC free article] [PubMed] [Google Scholar]
- VEERARAGHAVAN R, LIN J, KEENER JP, GOURDIE R & POELZING S (2016). Potassium channels in the Cx43 gap junction perinexus modulate ephaptic coupling: an experimental and modeling study. Pflugers Arch 468(10), 1651–1661. [DOI] [PMC free article] [PubMed] [Google Scholar]
- VEERARAGHAVAN R & POELZING S (2008). Mechanisms Underlying Increased Right Ventricular Conduction Sensitivity to Flecainide Challenge. Cardiovascular research 77(4), 749–756. [DOI] [PubMed] [Google Scholar]
- WANG J, OU SW & WANG YJ (2017). Distribution and function of voltage-gated sodium channels in the nervous system. Channels (Austin) 11(6), 534–554. [DOI] [PMC free article] [PubMed] [Google Scholar]
- WEIBRECHT I, LEUCHOWIUS KJ, CLAUSSON CM, CONZE T, JARVIUS M, HOWELL WM, KAMALI-MOGHADDAM M & SODERBERG O (2010). Proximity ligation assays: a recent addition to the proteomics toolbox. Expert Rev Proteomics 7(3), 401–409. [DOI] [PubMed] [Google Scholar]
- ZIMMER T, HAUFE V & BLECHSCHMIDT S (2014). Voltage-gated sodium channels in the mammalian heart. Glob Cardiol Sci Pract 2014(4), 449–463. [DOI] [PMC free article] [PubMed] [Google Scholar]
Associated Data
This section collects any data citations, data availability statements, or supplementary materials included in this article.


