

Abstract
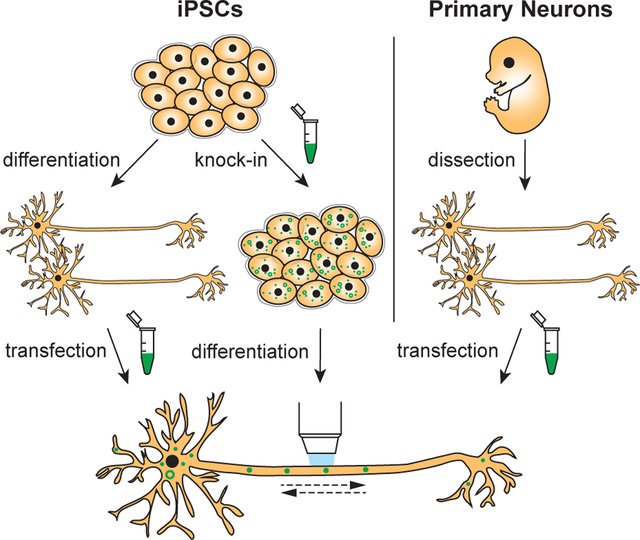
Induced pluripotent stem cells (iPSCs) hold promise to revolutionize studies of intracellular transport in live human neurons and to shed new light on the role of dysfunctional transport in neurodegenerative disorders. Here, we describe an approach for live-imaging axonal and dendritic transport in iPSC-derived cortical neurons. We use transfection and transient expression of genetically-encoded fluorescent markers to characterize the motility of Rab-positive vesicles, including early, late and recycling endosomes, as well as autophagosomes and mitochondria in iPSC-derived neurons. Comparing transport parameters of these organelles with data from primary rat hippocampal neurons, we uncover remarkable similarities. In addition, we generated LAMP1-EGFP knock-in iPSCs and show that knock-in neurons can be used to study transport of endogenously labeled vesicles, as a parallel approach to the transient overexpression of fluorescently-labeled organelle markers.
Keywords: iPSCs, induced pluripotent stem cells, iPSC-derived neurons, axonal transport, dendritic transport, live-imaging, NGN2
Graphical Abstract
Introduction
Intracellular transport is a vital process for the development and survival of cells. It is particularly important for neurons due to their long life-times and unique morphology, with highly branched dendrites and long axons which can extend up to a meter in length in humans. Neurons rely on intracellular transport to deliver newly synthesized organelles and macromolecules to the far-reaching ends of their neurites and to carry cargos such as neurotrophic factors back to the soma to alter gene expression. Defects in long-range intracellular transport have emerged as a common factor of several neurodegenerative disorders, including Parkinson’s disease, Alzheimer’s disease and amyotrophic lateral sclerosis.1
Long-distance transport in neurons is mainly driven by the microtubule-based motors kinesin and dynein. In axons, kinesin and dynein move processively due to the uniformly polarized microtubules, organized with dynamic plus-ends oriented outward and more stable minus-ends oriented toward the soma. Different forms of kinesin (kinesin families 1,2,3,4), drive anterograde motility towards the distal end of axons, while dynein mediates retrograde motility, transporting cargo back to the cell body. In mammalian dendrites, motility is more complex due to the mixed polarity of microtubules. Dynein and a more limited set of kinesin motors are able to navigate the cytoskeletal organization of dendrites but the underlying mechanisms of long-distance motility in this complex network are still being determined.2–4
All motors are ATP-dependent but display a range of motor properties, including different run lengths and velocities. Cargo motility is determined by a complex interaction between motors bound to the same cargo, regulated by motor-binding proteins and scaffolding proteins that affect motor activity. Transport is also regulated by post-translational modifications to microtubules and by microtubule-associated proteins such as tau and MAP7, which can alter motor interactions with their microtubule tracks (reviewed in Nirschl et al., 20175). Due to these layers of regulation at work within the complex intracellular environment, each type of cargo transported along the axon or in dendrites moves with a characteristic pattern, defined by velocity, run length, pausing frequency, and time spent in motion.
Intracellular transport in neurons has been studied in a variety of model systems, including in vivo models like Drosophila melanogaster and Caenorhabditis elegans (C. elegans) and in vitro models such as primary hippocampal or cortical neurons. In vivo systems provide a more physiological environment, but it can be technically challenging to image intracellular transport with sufficient temporo-spatial resolution. In vitro systems sacrifice the physiological environment of live organisms in favor of experimentally tractable systems that offer improved spatial-temporal resolution and the ability to readily label, knockdown, or overexpress specific components in order to define molecular mechanisms. Cultured primary rodent neurons, isolated from embryonic brains of mice or rats, are the most commonly used model to study trafficking in neurons. These cultures require expert dissection and culture techniques whose success can vary significantly among labs depending on the experience of the experimentalist and the culture conditions. Gene editing of primary neurons is also cumbersome due to their post-mitotic nature, requiring creation of new rodent lines, in utero electroporation, and/or direct brain injection of a Cas9 system or viral transduction.6,7 Further, rodent neurons may not recapitulate all relevant aspects of human neurobiology, making them an imperfect model to study the role of intracellular transport in neurological disorders.
Human induced pluripotent stem cells (iPSCs) provide a new and exciting model to overcome the limitations of rodent primary neurons and to allow analysis of intracellular transport in live human neurons. Differentiated human somatic cells are first reprogrammed into a pluripotent state. The resulting iPSCs can then be differentiated into various cell types, including neurons. This approach has opened new avenues for neurodegenerative research as iPSCs can be derived from human patients carrying disease-associated mutations. Researchers can use modern gene-editing tools such as CRISPR/Cas9 to correct these mutations and compare patient iPSC-derived neurons side-by-side with CRISPR-corrected isogenic controls. The feasibility of gene-editing also offers methodical advantages for studying intraneuronal transport. For example, CRISPR/Cas9 can be used to tag endogenous proteins of interest with fluorescent labels.8 This approach allows the study of protein and organelle dynamics at endogenous expression levels, complementing the more commonly used method of overexpressing fluorescently tagged proteins.
Recent work has increased the ability of researchers to derive and culture neurons from iPSCs with more efficient and robust methods.9,10 Using these optimized culture techniques, our study analyzed the intracellular transport of a variety of organelles within human iPSC-derived neurons. Our work is intended to provide a toolbox along with comparator datasets of intracellular transport in iPSC-derived neurons. We demonstrate the feasibility of live-imaging different Rab-positive vesicles, LAMP1-positive late endosomes/lysosomes, autophagosomes and mitochondria in the axonal and dendritic compartments of iPSC-derived neurons. We compare transport parameters of iPSC-derived neurons to data obtained from well-characterized rat hippocampal neurons to provide general insights into the similarities and differences between organelle trafficking in human iPSC-derived neurons and rodent embryonic neurons. Using LAMP1-EGFP knock-in iPSCs, we further show that iPSC-derived neurons can be used to study axonal transport of endogenously labeled vesicles, a complementary approach to the more commonly used transient transfection technique, which offers both strengths and limitations. We anticipate that these quantitative analyses will provide useful baseline data for the many ongoing studies focused on neuronal cell biology.
Results
NGN2 neurons as a model to study intracellular transport in neurons
Small molecule-based differentiation protocols for iPSCs exhibit variable efficiency and often result in heterogenous cultures of neuronal progenitors, neurons, and non-neuronal cells. This variability makes analysis of experimental data difficult, especially for live-imaging experiments where neuronal populations cannot be identified through staining for specific markers. Forward-programming approaches mediated by transcription factor overexpression minimalize this variability and allow for rapid derivation of homogenous neuronal populations.11 We used a genetically engineered iPSC line with a doxycycline-inducible NGN2 expression cassette inserted into the AAVS1 “safe harbor” locus.9 Dox-inducible NGN2 iPSCs were differentiated into a homogenous population of glutamatergic cortical neurons using a previously described protocol (Figure 1A).10 Following treatment with doxycycline-containing induction medium, cells rapidly became postmitotic and developed a neuron-like morphology; these NGN2-induced cells (Figure 1B,C) have been termed i3Neurons.9 28 days after sub-plating (day-in-vitro 28, DIV28) neurites stained positive for dendritic markers (microtubule-associated protein 2, MAP2) or Ankyrin G (AnkG) as a marker for the axon initial segment (AIS) (Figure 1C). We detected MAP2 and AnkG expression already at DIV7 (Figure S1A). About 96% of the cells had MAP2-positive neurites on DIV7. The majority of neurons (87%) had one neurite that stained positive for AnkG on DIV7 (Figure S1C). Similar to recent reports from other groups, a small subpopulation of i3Neurons (13%) had two neurites positive for AnkG (Figure S1B and C).12,13
Figure 1. Differentiation of doxycycline-inducible NGN2 iPSCs into i3Neurons.

A. Schematic of the differentiation protocol for i3Neurons. DOX= doxycycline.
B. Representative images of i3Neurons during differentiation, days in vitro 1,7,21. Scale bar is 50 μm.
C. Maximum intensity projection of i3Neuron DIV28 stained with MAP2 (green), AnkG (magenta) and Hoechst DNA stain (blue). Arrows highlight AIS, marked by increased AnkG staining. Scale bar is 10 μm.
D. Sholl analysis of i3Neurons DIV21 and hippocampal neurons DIV7. XY plot with mean ± S.E.M. N: hippo = 46, i3 = 35 neurons.
E. Axon length of i3Neurons DIV21 and hippocampal neurons DIV7. Scatter plot with mean ± S.E.M., unpaired t-test (p=0.0112). N: hippo = 22, i3 = 37 neurons.
Since NGN2-induced neurons have been extensively characterized and are commonly used at 3 weeks in vitro9–11, we used this time point for further experiments. We compared data from i3Neurons to rat hippocampal neurons at DIV7–8. The maturation of iPSC-derived neurons is distinct from that of primary neurons, and the embryologic development period is much longer in humans than in rodents. Specifically, we chose the DIV7–8 time point for hippocampal neurons as it is widely used in transport studies14–19, and a comparison is therefore likely to be useful to other researchers.
To characterize the cellular morphology of i3Neurons cultured under our conditions, we expressed GFP as a cytoplasmic fill and performed Sholl analysis, a well-established method to analyze neurite complexity.20 Sholl analysis revealed a peak of ~5 intersecting neurites in i3Neurons DIV21 (Figure 1D) and an average axonal length of 1003 μm (Figure 1E). For comparison, hippocampal neurons at DIV7 had a shorter average axon length (653.3 μm, Figure 1E) but a higher neurite number (average peak of ~11 intersecting neurites, Figure 1D).
Similar to our findings in i3Neurons, other groups also described an average peak of 4–6 intersections in Sholl analysis of NGN2-induced neurons and iPSC-derived neurons differentiated with conventional protocols.21–25 Our hippocampal data are similar to Sholl analysis of other rodent cultures, like rat cortical neurons DIV9 (max ~12 neurites) and mouse cortical neurons DIV9 (max ~17–20 neurites).26,27 The relatively low level of neurite complexity in iPSC-derived neurons at around 3 weeks in vitro may be explained by their slow maturation time. A recent study found that dendritic length roughly doubled in NGN2-induced neurons between DIV27 and DIV45.13
We found that coating our culture dishes with laminin affected i3Neuron morphology. Dishes coated with both PLO and laminin induced the formation of very long straight neurites rapidly after plating. However, adherence of cells to the dish was substantially reduced, leading to loss of cells during transfection or live imaging experiments. Thus, we cultured i3Neurons on dishes coated with PLO only for the experiments detailed below.
Microtubule orientation in i3Neurons models microtubule organization found in vivo
Vertebrate neurons display distinct patterns of microtubule organization in their axonal and dendritic processes. In axons, microtubules are uniformly oriented with their plus-ends towards the distal tip, while dendritic microtubules have a mixed orientation, with ~65% oriented anterograde (towards distal tip) and ~35% oriented retrograde (towards soma) (Figure 2A).28,29 To assess if i3Neurons share these characteristics, we expressed fluorescently labeled end-binding protein 3 (EB3). EB3 is specifically recruited to the plus-end of growing microtubules where it can be visualized as comet-like structures (Figure 2B). We found that about 99% of EB3 comets in the axon of i3Neurons DIV21 were oriented in the anterograde direction, while dendrites displayed a mix of anterograde (~64%) and retrograde (~36%) comets (Figure 2B–D). Thus, microtubule polarity in both the axons and dendrites of i3Neurons resembles that previously characterized in hippocampal neurons as well as in vivo.3,30 Similar to previous experiments in rodent neurons28,30, we observed a higher density of EB3 comets in dendrites (average of 5.5 comets/30 μm/1 min) compared to axons (average of 1.5 comets/30 μm/1 min) (Figure 2E). Recent work from our lab has highlighted the role of microtubule dynamics in both transport initiation and cargo delivery31,32, so in this aspect, i3Neurons are likely to provide a useful model. It remains to be determined whether post-translational modifications of microtubules, and the recruitment of specific MAPs, such as tau and MAP7, are conserved in the i3Neuron model system as there is a growing body of work that these factors also regulate transport in neurons.
Figure 2. Microtubule orientation and dynamics in i3Neurons.

A. Schematic of canonical microtubule organization in neurons.
B. Representative kymographs of EB3-mCherry in axons and dendrites of i3Neurons DIV21. Scale bars: vertical is 120 seconds, horizontal is 10 μm.
C. Direction of EB3 comets in axons. Bar graph with mean ± S.E.M., N: 7 neurons.
D. Direction of EB3 comets in dendrites. Bar graph with mean ± S.E.M., N: 6 neurons.
E. Quantification of EB3 comets in axons and dendrites of i3Neurons DIV21. Bar graph with mean ± S.E.M., N: axons = 7 and dendrites = 6 neurons.
i3Neurons and hippocampal neurons display similar early endosome dynamics
In neurons, endosomes play a vital role in transporting neurotransmitters, neuronal growth factors and downstream signaling factors. Early endosomes act as a platform for cargo sorting, sending proteins to the plasma membrane via recycling endosomes or to late endosomes for downstream signaling, trafficking or degradation. Rab5 is a well characterized marker for early endosomes.33 We expressed GFP-Rab5 in i3Neurons and compared the dynamics to Rab5-positive endosomes in rat hippocampal cultures DIV8. We imaged organelle dynamics in both axons and dendrites, since organelles display distinct parameters of motility within each of these compartments.
In axons of both i3Neurons and hippocampal neurons, Rab5-endosomes were mainly bidirectional or stationary, with about 60–70% displaying net directional motility of less than 10 μm (Figure 3A–C). The density of axonal early endosomes in i3Neurons was significantly lower than in hippocampal neurons (Figure 3D). Retrograde motility had a mean net velocity of about 0.5 μm/sec in both i3Neurons and hippocampal neurons, while anterograde motility had a mean net velocity around 0.3–0.6 μm/sec (Figure 3E–F). In dendrites, early endosomes marked by GFP-Rab5 were mostly non-motile (~80%), with similar organelle density and motility observed in both i3Neurons and hippocampal neurons (Figure 3G–J). Net dendritic velocities for anterograde and retrograde motility showed no significant difference between i3Neurons and hippocampal neurons (Figure 3K,L).
Figure 3. Early endosome dynamics in i3Neurons and hippocampal neurons.

A. Representative images of GFP-Rab5 in axons of i3Neurons DIV23–25 and hippocampal neurons DIV8. Arrows indicate GFP-Rab5 positive organelles. Scale bar is 5 μm.
B. Straightened images of first frame from A (upper panel) and kymographs (middle panel) of GFP-Rab5 dynamics in axons of i3Neurons DIV23–25 and hippocampal neurons DIV8. Traced events (lower panel) are color coded for ease of interpretation. Scale bar is 5 μm, total time (vertical length) of kymograph is 2 minutes.
C. Motility fractioned into retrograde, anterograde and non-motile events per neuron. Bar graph with mean ± S.E.M., two-way ANOVA(p>0.05). N: hippo = 25, i3 = 17 neurons.
D. Density of GFP-Rab5 organelles. Scatter plot with mean ± S.E.M., Mann Whitney test (p=0.0016). N: hippo = 25, i3 = 20 neurons.
E. Retrograde Net Velocity of GFP-Rab5 organelles. Scatter plot with mean ± S.E.M., Mann-Whitney test (p=0.7285). N: hippo = 120, i3 = 26 organelles.
F. Anterograde Net Velocity of GFP-Rab5 organelles. Scatter plot with mean ± S.E.M., Mann-Whitney test (p=0.1371). N: hippo = 104, i3 = 20 organelles.
G. Representative images of GFP-Rab5 in dendrites of i3Neurons DIV23–25 and hippocampal neurons DIV8. Arrows indicate GFP-Rab5 positive organelles. Scale bar is 5 μm.
H. Straightened images of first frame from G (upper panel) and kymographs (middle panel) of GFP-Rab5 dynamics in dendrites of i3Neurons DIV23–25 and hippocampal neurons DIV8. Traced events (lower panel) are color coded for ease of interpretation. Scale bar is 5 μm, total time (vertical length) of kymograph is 2 minutes.
I. Motility fractioned into retrograde, anterograde and non-motile events per neuron. Bar graph with mean ± S.E.M., two-way ANOVA(p>0.05). N: hippo = 22, i3 = 22 neurons
J. Density of GFP-Rab5 organelles. Scatter plot with mean ± S.E.M., Mann Whitney test (p=0.1220). N: hippo = 23, i3 = 22 neurons.
K. Retrograde Net Velocity of GFP-Rab5 organelles. Scatter plot with mean ± S.E.M., Mann-Whitney test (p=0.0643). N: hippo = 89, i3 = 95 organelles.
L. Anterograde Net Velocity of GFP-Rab5 organelles. Scatter plot with mean ± S.E.M., Mann-Whitney test (p=0.0959). N: hippo = 46, i3 = 76 organelles.
Late endosome / lysosome motility is similar in i3Neurons and hippocampal neurons, but with distinct differences
After sorting of cargo in the early endosomal stage, vesicles mature to late endosomes through the exchange of proteins and lipids. Late endosomes can then fuse with degradative lysosomes or be trafficked back to the trans-Golgi network. Since late endosomes and lysosomes fuse, it is difficult to distinguish between individual compartments without multiple markers. Here we used Rab7 as a marker for late endosomes, and LAMP1 as a marker for late endosomes/lysosomes.14,34 We expressed GFP-Rab7 or LAMP1-mNeonGreen to investigate the dynamics of Rab7 and LAMP1 vesicles in i3Neurons and rat hippocampal neurons.
In axons of hippocampal neurons, Rab7 vesicles had a strong retrograde bias, with about 50% retrograde, 30% non-motile and 20% anterograde motility (Figure 4A–C). In i3Neurons, we observed more stationary/bidirectional motility with 60% non-motile, 30% retrograde and 10% anterograde vesicles (Figure 4A–C). Despite the higher number of stationary vesicles, Rab7 organelles in i3Neurons still had more retrograde than anterograde motility. The density and net velocities of axonal Rab7 vesicles were similar in hippocampal neurons and i3Neurons (Figure 4D–F). In dendrites of both i3Neurons and hippocampal neurons, Rab7 endosomes displayed a lower motility with ~80% of organelles showing a net motility of 10 μm or less (Figure 4G–I). Organelle density was slightly higher than in axons (Figure 4J). Average dendritic velocities were not different between hippocampal neurons and i3Neurons, but were lower than velocities observed in the axon (Figure 4K,L).
Figure 4. Motility of Rab7-positive late endosomes in i3Neurons and hippocampal neurons.

A. Representative images of GFP-Rab7 in axons of i3Neurons DIV23–25 and hippocampal neurons DIV8. Arrows indicate GFP-Rab7 positive organelles. Scale bar is 5 μm.
B. Straightened images of first frame from A (upper panel) and kymographs (middle panel) of GFP-Rab7 dynamics in axons of i3Neurons DIV23–25 and hippocampal neurons DIV8. Traced events (lower panel) are color coded for ease of interpretation. Scale bar is 5 μm, total time (vertical length) of kymograph is 2 minutes.
C. Motility fractioned into retrograde, anterograde and non-motile events per neuron. Bar graph with mean ± S.E.M., two-way ANOVA(retro p=0.0194, non-motile p=0.0022, antero p=0.8679). N: hippo = 22, i3 = 19 neurons.
D. Density of GFP-Rab7 organelles. Scatter plot with mean ± S.E.M., unpaired t-test (p=0.9586). N: hippo = 22, i3 = 19 neurons.
E. Retrograde Net Velocity of GFP-Rab7 organelles. Scatter plot with mean ± S.E.M., Mann-Whitney test (p=0.4784). N: hippo = 100, i3 = 54 organelles.
F. Anterograde Net Velocity of GFP-Rab7 organelles. Scatter plot with mean ± S.E.M., Mann-Whitney test (p=0.2368). N: hippo = 35, i3 = 30 organelles.
G. Representative images of GFP-Rab7 in dendrites of i3Neurons DIV23–25 and hippocampal neurons DIV8. Arrows indicate GFP-Rab7 positive organelles. Scale bar is 5 μm.
H. Straightened images of first frame from G (upper panel) and kymographs (middle panel) of GFP-Rab7 dynamics in dendrites of i3Neurons DIV23–25 and hippocampal neurons DIV8. Traced events (lower panel) are color coded for ease of interpretation. Scale bar is 5 μm, total time (vertical length) of kymograph is 2 minutes.
I. Motility fractioned into retrograde, anterograde and non-motile events per neuron. Bar graph with mean ± S.E.M., two-way ANOVA(p>0.05). N: hippo = 21, i3 = 16 neurons.
J. Density of GFP-Rab7 organelles. Scatter plot with mean ± S.E.M., unpaired t-test (p=0.6405). N: hippo = 21, i3 = 16 neurons.
K. Retrograde Net Velocity of GFP-Rab7 organelles. Scatter plot with mean ± S.E.M., Mann-Whitney test (p=0.7029). N: hippo = 91, i3 = 51 organelles.
L. Anterograde Net Velocity of GFP-Rab7 organelles. Scatter plot with mean ± S.E.M., Mann-Whitney test (p=0.6412). N: hippo = 38, i3 = 43.
In axons of both hippocampal neurons and i3Neurons, LAMP1 organelles were highly motile in both the anterograde and retrograde direction, with only 30% of vesicles displaying stationary/bidirectional motility (Figure 5A–C). In both cell types, there were about 2 organelles per 30 μm axonal length (Figure 5D). While the average retrograde net velocity was not significantly different, LAMP1 vesicles in i3Neurons had a significantly lower anterograde velocity (average of 1.5 μm/sec) than hippocampal neurons (average of 2 μm/sec) (Figure 5F). In dendrites of hippocampal neurons and i3Neurons, LAMP1 vesicles were less motile, with about 50% of vesicles classified as non-motile. The rest were evenly distributed between retrograde and anterograde motility (Figure 5G–I). Organelle density was also similar in both systems, with about 3–4 organelles per 30 μm dendritic length (Figure 5J). There was no difference in the net velocities of dendritic LAMP1 transport (Figure 5K,L).
Figure 5. Motility of LAMP1-positive late endosomes / lysosomes in i3Neurons and hippocampal neurons.

A. Representative images of LAMP1-mNeonGreen in axons of i3Neurons DIV23–25 and hippocampal neurons DIV8. Arrows indicate LAMP1-mNeonGreen positive organelles. Scale bar is 5 μm.
B. Straightened images of first frame from A (upper panel) and kymographs (middle panel) of LAMP1-mNeonGreen dynamics in axons of i3Neurons DIV23–25 and hippocampal neurons DIV8. Traced events (lower panel) are color coded for ease of interpretation. Scale bar is 5 μm, total time (vertical length) of kymograph is 2 minutes.
C. Motility fractioned into retrograde, anterograde and non-motile events per neuron. Bar graph with mean ± S.E.M., two-way ANOVA(p>0.05). N: hippo = 33, i3 = 15 neurons.
D. Density of LAMP1-mNeonGreen organelles. Scatter plot with mean ± S.E.M., unpaired t-test (p=0.4413). N: hippo = 33, i3 = 15 neurons.
E. Retrograde Net Velocity of LAMP1-mNeonGreen organelles. Scatter plot with mean ± S.E.M., Mann-Whitney test (p=0.1074). N: hippo = 57, i3 = 25 organelles.
F. Anterograde Net Velocity of LAMP1-mNeonGreen organelles. Scatter plot with mean ± S.E.M., Mann-Whitney test (p=0.0347). N: hippo = 78, i3 = 29 organelles.
G. Representative images of LAMP1-mNeonGreen in dendrites of i3Neurons DIV23–25 and hippocampal neurons DIV8. Arrows indicate LAMP1-mNeonGreen positive organelles. Scale bar is 5 μm.
H. Straightened images of first frame from G (upper panel) and kymographs (middle panel) of LAMP1-mNeonGreen dynamics in dendrites of i3Neurons DIV23–25 and hippocampal neurons DIV8. Traced events (lower panel) are color coded for ease of interpretation. Scale bar is 5 μm, total time (vertical length) of kymograph is 2 minutes.
I. Motility fractioned into retrograde, anterograde and non-motile events per neuron. Bar graph with mean ± S.E.M., two-way ANOVA(p>0.05). N: hippo = 25, i3 = 15 neurons.
J. Density of LAMP1-mNeonGreen organelles. Scatter plot with mean ± S.E.M., unpaired t-test (p=0.0566). N: hippo = 25, i3 = 15 neurons.
K. Retrograde Net Velocity of LAMP1-mNeonGreen organelles. Scatter plot with mean ± S.E.M., Mann-Whitney test (p=0.3324). N: hippos = 42, i3 = 137 organelles.
L. Anterograde Net Velocity of LAMP1-mNeonGreen organelles. Scatter plot with mean ± S.E.M., Mann-Whitney test (p=0.0741). N: hippo = 32, i3 = 127 organelles.
Together, i3Neurons shared several characteristic features of late endosome/lysosome motility with primary neurons. The majority of mobile axonal Rab7 vesicles moved in the retrograde direction. Axonal LAMP1 vesicles were highly mobile with equal fractions of anterograde, retrograde and bidirectional/stationary organelles. Interestingly, we found a higher number of stationary/bidirectional Rab7 vesicles and a lower anterograde velocity of LAMP1 organelles in axons of i3Neurons. In dendrites of hippocampal neurons and i3Neurons, we detected higher density but lower mobility of Rab7 and LAMP1 vesicles compared with those in the axonal compartment.
Autophagosomes exhibit canonical retrograde motility in i3Neurons
Autophagosomes are another compartment that feeds into the lysosomal pathway.35 Autophagosomes engulf cytoplasmic protein aggregates or damaged organelles and deliver their cargo to lysosomes for degradation. Here, we used GFP-LC3 as a marker for autophagosomes. Lipidated LC3 is incorporated into the growing autophagosome membrane and remains stably associated with the organelle during transport and luminal acidification.36,37 GFP-LC3 is a useful reporter for imaging autophagosome dynamics prior to their acidification, as GFP is quenched in an acidic environment.
In axons of hippocampal neurons, GFP-LC3 vesicles displayed a strong retrograde bias with about 80% moving in the retrograde direction (Figure 6A–C). Autophagosomes in i3Neurons shared this characteristic retrograde motility (Figure 6A–C). GFP-LC3 vesicles in i3Neurons had a slightly higher average retrograde velocity, while anterograde velocity was very similar to that observed in hippocampal neurons (Figure 6E,F). Density of autophagosomes was also similar in the two systems (Figure 6D). We found very few GFP-LC3 vesicles in the dendrites of hippocampal neurons, as previously described38; similarly, we found very few GFP-LC3 vesicles in the dendrites of i3Neurons (data not shown).
Figure 6. Autophagosome dynamics in i3Neurons and hippocampal neurons.

A. Representative images of GFP-LC3 in axons of i3Neurons DIV21 and hippocampal neurons DIV8. Arrows indicate GFP-LC3 positive organelles. Scale bar is 5 μm.
B. Straightened images of first frame from A (upper panel) and kymographs (middle panel) of GFP-LC3 dynamics in axons of i3Neurons DIV21 and hippocampal neurons DIV8. Traced events (lower panel) are color coded for ease of interpretation. Scale bar is 5 μm, total time (vertical length) of kymograph is 2 minutes.
C. Motility fractioned into retrograde, anterograde and non-motile events per neuron. Bar graph with mean ± S.E.M., two-way ANOVA(p>0.05). N: hippo = 25, i3 = 11 neurons.
D. Density of GFP-LC3 organelles. Scatter plot with mean ± S.E.M., unpaired t-test (p=0.5452). N: hippo = 25, i3 = 11 neurons.
E. Retrograde Net Velocity of GFP-LC3 organelles. Scatter plot with mean ± S.E.M., unpaired t-test (p=0.0270). N: hippo = 64, i3 = 15 organelles.
F. Anterograde Net Velocity of GFP-LC3 organelles. Scatter plot with mean ± S.E.M., unpaired t-test (p=0.2280). N: hippo = 7, i3 = 7 organelles.
Recycling endosome motility is similar in axons but different in dendritic compartments
Instead of being degraded via the lysosome pathway, proteins can be delivered to recycling endosomes and trafficked back to the plasma membrane. Rab11 is a well characterized marker of recycling endosomes. In neurons, Rab11-dependent recycling is important for transporting TrkB-BDNF into dendrites and maintaining a pool of TrkB for long-term potentiation maintenance.39,40 We expressed GFP-Rab11 to observe recycling endosome dynamics. In axons, Rab11 vesicles displayed similar motility in hippocampal neurons and i3Neurons. About 50% of Rab11 organelles were non-motile, and approximately 25% were transported in both the anterograde and retrograde direction (Figure 7A–C). We observed 4–5 organelles per 30 μm axonal length in both systems (Figure 7D). There were no differences in the velocity of anterograde or retrograde movements in the axon (Figure 7E,F). While axonal Rab11 motility was similar in hippocampal neurons and i3Neurons, we detected significant differences in the dendritic compartment. In i3Neurons, about 60% of dendritic Rab11 vesicles were stationary. Rab11 vesicles in hippocampal dendrites were much more mobile, with similar fractions of retrograde, anterograde and non-motile vesicles (Figure 7G–I). Organelle density (Figure 7J) as well as anterograde and retrograde velocities of dendritic Rab11 vesicles (Figure 7K,L) were significantly lower in i3Neurons.
Figure 7. Recycling endosome dynamics in i3Neurons and hippocampal neurons.

A. Representative images of GFP-Rab11 in axons of i3Neurons DIV23–25 and hippocampal neurons DIV8. Arrows indicate GFP-Rab11 positive organelles. Scale bar is 5 μm.
B. Straightened images of first frame from A (upper panel) and kymographs (middle panel) of GFP-Rab11 dynamics in axons of i3Neurons DIV23–25 and hippocampal neurons DIV8. Traced events (lower panel) are color coded for ease of interpretation. Scale bar is 5 μm, total time (vertical length) of kymograph is 2 minutes.
C. Motility fractioned into retrograde, anterograde and non-motile events per neuron. Bar graph with mean ± S.E.M., two-way ANOVA(p>0.05). N: hippo = 18, i3 = 17 neurons.
D. Density of GFP-Rab11 organelles. Scatter plot with mean ± S.E.M., unpaired t-test (p=0.07650). N: hippo = 18, i3 = 20 neurons.
E. Retrograde Net Velocity of GFP-Rab11 organelles. Scatter plot with mean ± S.E.M., Mann-Whitney test (p=0.8235). N: hippo = 113, i3 = 168 organelles.
F. Anterograde Net Velocity of GFP-Rab11 organelles. Scatter plot with mean ± S.E.M., Mann-Whitney test (p=0.0584). N: hippo = 123, i3 = 161 organelles.
G. Representative images of GFP-Rab11 in dendrites of i3Neurons DIV23–25 and hippocampal neurons DIV8. Arrows indicate GFP-Rab11 positive organelles. Scale bar is 5 μm.
H. Straightened images of first frame from G (upper panel) and kymographs (middle panel) of GFP-Rab11 dynamics in dendrites of i3Neurons DIV23–25 and hippocampal neurons DIV8. Traced events (lower panel) are color coded for ease of interpretation. Scale bar is 5 μm, total time (vertical length) of kymograph is 2 minutes.
I. Motility fractioned into retrograde, anterograde and non-motile events per neuron. Bar graph with mean ± S.E.M., two-way ANOVA (retro p=0.0085, non-motile p<0.0001, antero p=0.0004). N: hippo = 19, i3 = 18 neurons.
J. Density of GFP-Rab11 organelles. Scatter plot with mean ± S.E.M., unpaired t-test (p=0.0011). N: hippo = 20, i3 = 21 neurons.
K. Retrograde Net Velocity of GFP-Rab11 organelles. Scatter plot with mean ± S.E.M., Mann-Whitney test (p<0.0001). N: hippo = 231, i3 = 179 organelles.
L. Anterograde Net Velocity of GFP-Rab11 organelles. Scatter plot with mean ± S.E.M., Mann-Whitney test (p<0.0001). N: hippo = 262, i3 = 217 organelles.
Motility of axonal mitochondria is age-dependent in i3Neurons
Mitochondria distribution is vital to provide energy to the subcellular compartments of neurons. Here, we evaluated mitochondrial dynamics by expressing Mito-mEmerald. In axons, i3Neurons at DIV21 had more stationary mitochondria (75%) than hippocampal neurons DIV7 (55%, Figure 8A–C). i3Neurons DIV21 had longer mitochondria (Figure 8D) and lower mitochondrial density than hippocampal neurons. We measured ~2–3 mitochondria per 30 μm axonal length in i3Neurons and about 4 mitochondria per 30 μm in hippocampal neurons (Figure 8E). While retrograde velocities of mitochondrial movements were similar, we found slightly lower anterograde net velocities in i3Neurons DIV21 than hippocampal neurons (Figure 8F,G). Axonal mitochondria in i3Neurons also paused less frequently than in hippocampal neurons (Figure 8H). In dendrites, we observed even higher fractions of stationary mitochondria. About 90% of mitochondria were stationary in hippocampal neurons and about 80% were stationary in i3Neurons (Figure 9A–C). Similar to our findings in the axonal compartment, mitochondrial density was lower in dendrites of i3Neurons. Dendritic mitochondria displayed similar net velocities in i3Neurons and hippocampal neurons (Figure 9D–F).
Figure 8. Motility of axonal mitochondria in i3Neurons and hippocampal neurons.

A. Representative images of mito-mEmerald in axons of hippocampal neurons DIV7, i3Neurons DIV7 and DIV21. Arrows indicate mito-mEmerald positive organelles. Scale bar is 5 μm.
B. Straightened images of the first frame from A (upper panel) and kymographs (middle panel) of mito-mEmerald dynamics in axons of hippocampal neurons DIV7, i3Neurons DIV7 and DIV21. Traced events (lower panel) are color coded for ease of interpretation. Scale bar is 5 μm, total time (vertical length) of kymograph is 4 minutes.
C. Motility fractioned into retrograde, anterograde and non-motile events per neuron. Bar graph with mean ± S.E.M., two-way ANOVA with Tukey’s multiple comparisons (non-motile hippo DIV8, i3 DIV21 p=0.004). N: hippo = 22, i3 DIV7 = 31, i3 DIV21 = 17 neurons.
D. Mitochondrial length. Bar graph with mean ± S.E.M., Ordinary one-way ANOVA with Tukey’s multiple comparison test (ns p=0.1041, ***p<0.0001). N: hippo = 433, i3 DIV7 = 388, i3 DIV21 = 236 organelles.
E. Density of mito-mEmerald organelles. Scatter plot with mean ± S.E.M., one-way ANOVA with Tukey’s multiple comparisons test (***p<0.0001, **p=0.0045). N: hippo = 22, i3 DIV7 = 32, i3 DIV21 = 17 neurons.
F. Retrograde Net Velocity of mito-mEmerald organelles. Scatter plot with mean ± S.E.M., one-way ANOVA with Sidak’s multiple comparisons test (p>0.05) N: hippos = 298, i3 DIV7 = 243, i3 DIV21 = 96 organelles.
G. Anterograde Net Velocity of mito-mEmerald organelles. Scatter plot with mean ± S.E.M., one-way ANOVA with Tukey’s multiple comparisons test (p>0.05, except hippo DIV7:i3 DIV21 p<0.0001). N: hippo = 267, i3 DIV7 = 152, i3 DIV21 = 131 organelles.
H. Pause number per mitochondrial run. Bar graph with mean ± S.E.M., Ordinary one-way ANOVA with Tukey’s multiple comparison test (**p=0.0021, ***p<0.0001) N: hippo = 352, i3 DIV7 = 389, i3 DIV21 = 239 organelles.
Figure 9. Motility of dendritic mitochondria in i3Neurons and hippocampal neurons.

A. Representative images of mito-mEmerald in dendrites of hippocampal neurons DIV8 and i3Neurons DIV21. Arrows indicate mito-mEmerald positive organelles. Scale bar is 5 μm.
B. Straightened images of first frame from A (upper panel) and kymographs (middle panel) of mito-mEmerald dynamics in dendrites of hippocampal neurons DIV8 and i3Neurons DIV21. Traced events (lower panel) are color coded for ease of interpretation. Scale bar is 5 μm, total time (vertical length) of kymograph is 2 minutes.
C. Motility fractioned into retrograde, anterograde and non-motile events per neuron. Bar graph with mean ± S.E.M., two-way ANOVA with Sidak’s multiple comparisons test (retro p>0.05, non-motile p=0.0109, antero p>0.05). N: hippo = 34, i3 DIV21 = 29 neurons.
D. Density of mito-mEmerald organelles. Scatter plot with mean ± S.E.M., unpaired t-test (p<0.0001). N: hippo = 34, i3 DIV21 = 29 neurons.
E. Retrograde Net Velocity of mito-mEmerald organelles. Scatter plot with mean ± S.E.M., Mann-Whitney test (p=0.1084). N: hippo = 276, i3 DIV21 = 130 organelles.
F. Anterograde Net Velocity of mito-mEmerald organelles. Scatter plot with mean ± S.E.M., Mann-Whitney test (p=0.0121). N: hippo = 259, i3 DIV21 = 157 organelles.
Previous studies in rodent neurons reported decreased mitochondrial motility at later time points in culture.41 We therefore set out to compare axonal mitochondrial motility in younger i3Neurons DIV7 with rat hippocampal cultures DIV7. Indeed, mitochondrial motility in i3Neurons DIV7 was higher than in i3Neurons DIV21 but similar to hippocampal neurons DIV7 (Figure 8C). Mitochondrial length in i3Neurons DIV7 was lower than in i3Neurons DIV21 but similar to hippocampal neurons DIV7 (Figure 8D). However, mitochondria of i3Neurons DIV7 still displayed lower density and less pausing than mitochondria in hippocampal neurons (Figure 8E,H).
Since we also observed decreased motility of axonal Rab7 and dendritic Rab11 vesicles in i3Neurons DIV23–25 compared to hippocampal neurons DIV8, we performed additional experiments to determine if these differences were related to age in culture. Interestingly, age in culture did not have a strong effect on the motility of either axonal Rab7 or dendritic Rab11 vesicles. Axonal Rab7 and dendritic Rab11 vesicles in i3Neurons DIV8 still displayed a higher fraction of non-motile vesicles than in hippocampal neurons DIV8 (Figure S2).
LAMP1-EGFP knock-in iPSCs and i3Neurons as a tool to study intracellular transport of endogenously-tagged vesicles
Most studies investigating axonal or dendritic transport rely on the overexpression of fluorescently-tagged proteins to visualize intracellular organelles. However, gene-editing in iPSCs allows to tag endogenous proteins with a fluorophore and makes it feasible to study transport of endogenously-labelled organelles in iPSC-derived neurons, offering an elegant and complementary approach to commonly used overexpression models.
Using a ribonuclear protein (RNP) based CRISPR/Cas9 approach, we generated dox-inducible NGN2 iPSCs with an additional knock-in of EGFP to the C-terminus of LAMP1.8 LAMP1-EGFP positive lysosomes/late endosomes appeared as small puncta, bigger ring-like vesicles or tubular structures in undifferentiated knock-in iPSCs (Figure 10A). LAMP1-EGFP positive rings and tubules were relatively stationary, while smaller LAMP1-EGFP vesicles displayed high motility (Suppl. Video 1). Very similar observations were made in a previously generated and highly characterized LAMP1-EGFP knock-in iPSC line by the Allen Institute (https://www.allencell.org/cell-catalog.html).
Figure 10. LAMP1-EGFP knock-in iPSCs and i3Neurons.

A. Undifferentiated LAMP1-EGFP knock-in iPSCs. Insets show tubular (1), punctate (2) and ring-like (3) LAMP1-EGFP structures. Scale bar is 5 μm in overview and 1 μm in insets.
B. Maximum intensity projection of LAMP1-EGFP knock-in i3Neuron at DIV8. The outlined cell was transfected with HaloTag-Stop as a cellular fill. Insets show LAMP1-EGFP puncta in neurites (1, 3) and LAMP1-EGFP rings in the soma (2). Image is shown after deconvolution. Scale bar is 5 μm in overview and 1 μm in insets.
C. Maximum intensity projection of LAMP1-EGFP signal and LAMP1 antibody staining in i3Neurons DIV8. Arrows highlight co-localization of LAMP1 from EGFP signal and antibody staining. Image is shown after deconvolution. Scale bar is 5 μm.
D. Representative time lapse series of axonal LAMP1-EGFP vesicle transport in a LAMP1-EGFP knock-in i3Neuron at DIV8. Arrows highlight the positions of a vesicle moving in the anterograde direction. Scale bar is 5 μm.
E. Representative kymograph of axonal LAMP1-EGFP vesicle transport in a LAMP1-EGFP knock-in i3Neuron DIV8. Scale bars are 5 μm (horizontal) and 20 sec (vertical).
After differentiation to LAMP1-EGFP knock-in i3Neurons, EGFP positive puncta and rings were still easily detectable in the soma (Figure 10B). To validate successful gene editing, we compared the intracellular localization of LAMP1-EGFP with the pattern of LAMP1 antibody labeling. This revealed an extensive colocalization (Figure 10C). The LAMP1-EGFP knock-in resulted in almost no cytosolic background signal, making it technically challenging to trace individual neurites, especially in a pure culture of LAMP1-EGFP knock-in i3Neurons. We therefore diluted LAMP1-EGFP knock-in i3Neurons with LAMP1-WT i3Neurons and transfected the cells with HaloTag-Stop as a cytosolic filler. Similar to our experiments with overexpressed LAMP1-mNeonGreen, we observed small punctate LAMP1-EGFP vesicles in neurites, but no bigger ring- or tube-like structures (Figure 10B, insets 1 and 3). Small axonal LAMP1-EGFP vesicles were relatively dim, but it was feasible to image their transport at a high temporal resolution with our spinning disc confocal setup. Axonal LAMP1-EGFP vesicles were highly mobile and transported in both the anterograde and retrograde direction (Figure 10D,E, Suppl. Video 2), similar to vesicles labelled by overexpressed LAMP1-mNeonGreen.
Discussion
Pioneering work from the Banker lab established primary rodent hippocampal neurons as an outstanding model system to study trafficking in neurons.42,43 The onset of intravital imaging with improved temporal and spatial resolution in model systems including C. elegans, Drosophila, zebrafish, and mouse44 provides another powerful way to study intracellular dynamics. In studies to date, in vitro and in vivo approaches appear to be in broad general agreement in regard to the dynamics of organelle trafficking; see Sleigh et al. (2017)45 for a more thorough discussion. The use of primary neurons has allowed rapid progress in our mechanistic understanding of the molecular motors and cytoskeletal parameters that affect organelle motility in neurons. However, neither the use of primary neurons nor intravital imaging allows the analysis of organelle trafficking in human neurons. Thus, there is substantial interest in developing iPSC-derived neurons as a model system to understand human neurobiology and pathobiology.
As a baseline for researchers intending to use iPSC-derived neurons for trafficking studies in the future, we undertook a careful comparison of organelle motility in i3Neurons as compared to rat hippocampal neurons. Remarkably, we found only limited differences. Specifically, we found no difference between i3Neurons and hippocampal neurons in the motility of Rab5-positive early endosomes, LAMP1-positive late endosomes/lysosomes and LC3-positive autophagosomes. While we did note some differences in the dynamics of axonal Rab7 vesicles and dendritic Rab11 endosomes, these differences were slight.
We found a higher fraction of non-motile Rab7 vesicles in axons of i3Neurons than our hippocampal cultures. This reduced axonal motility of Rab7 vesicles does not appear to reflect changes in autophagosome transport as axonal transport of EGFP-LC3 vesicles was similar in hippocampal neurons and i3Neurons. We also observed similar LAMP1 motility, a marker for more mature late endosomes and lysosomes14, indicating that the reduced retrograde transport of Rab7 vesicles most likely reflects a reduction in motility of less mature, Rab7-only positive late endosomes back to the soma. We found that i3Neurons DIV8 also had a significantly higher fraction of stationary Rab7 vesicles than hippocampal neurons. This suggests that the difference in Rab7 motility is not related to age in culture but may be caused by cell-type intrinsic factors or differences in culture conditions between i3Neurons and hippocampal neurons.
We also found that Rab11 motility in dendrites of i3Neurons was significantly dampened compared to hippocampal neurons. In dendrites, recycling endosomes provide a reserve pool of signaling receptors like TrkB and AMPA receptors that are needed for long-term potentiation maintenance.39,46 We found i3Neurons to have lower dendritic complexity compared to hippocampal neurons, and recent studies have reported a low number of synapses in NGN2 neurons at around 4 weeks in vitro, even in co-culture with astrocytes that have been shown to increase synapse formation.10,13 One possible explanation for the dampened dendritic Rab11 motility could be a lower synaptic activity in i3Neurons that results in a lower stimulation of Rab11 transport.
In contrast to our findings for Rab7 and Rab11, age in culture had a significant effect on mitochondrial motility in i3Neurons. Axonal mitochondria were less motile in i3Neurons at DIV21 than at DIV7. Interestingly, mitochondria in i3Neurons DIV7 displayed very similar motility to mitochondria in hippocampal neurons DIV7. Our observation of reduced mitochondrial motility at later time points in culture is consistent with previous reports from rodent neurons. Mouse cortical neurons DIV28 have 95% stationary mitochondria compared to 60% at DIV7.41 In vivo, studies in mice, zebrafish and drosophila found very low numbers of mobile mitochondria in mature neurons.41,47–49 A study in Drosophila reported decreased mitochondrial motility with age in wing neurons.50 Mice have 90% non-motile mitochondria in axons of cortical layer 2/3 pyramidal neurons as early as postnatal day 10–12.41 The increased fraction of stationary mitochondria in mature neurons in vivo, and at later time points in vitro has been proposed to be associated with the formation of presynaptic sites along the axon. i3Neurons, especially when co-cultured with astrocytes to stimulate more rapid synapse formation, could provide a useful model to study the regulation of mitochondrial motility in more detail in human neurons.
Our study used transient expression of fluorescently-tagged proteins to label organelles of interest and study their intracellular transport. This approach is commonly used and has yielded robust data that are remarkably consistent across model systems and species. Gene editing of iPSCs opens up the exciting possibility of investigating dendritic/axonal transport of endogenously tagged proteins in iPSC-derived neurons. As a proof of concept, we generated LAMP1-EGFP knock-in iPSCs and demonstrated the feasibility of imaging axonal transport of endogenously-tagged LAMP1 vesicles with our spinning disc setup. On one hand, fluorophore knock-in elegantly circumvents the need to overexpress fluorescently-tagged protein and offers a potentially “cleaner” way to study intracellular transport. Transfection of fluorescently-tagged protein results in variable expression levels, where higher protein expression makes it easier to visualize organelles of interest but may affect organelle function. This is particularly relevant if the tagged protein is not only an organelle marker but serves important intracellular functions, so that overexpression of the protein has the potential to alter cellular biology. On the other hand, researchers lose a lot of flexibility in their experimental design when using the knock-in approach instead of overexpression. Generation and validation of a new CRISPR knock-in iPSC line takes at least 2–3 months, even if gRNA sequence and donor plasmid vector are already available. Thus, studying the transport of different organelles becomes very labor- and cost-intensive. This is especially true for studies that aim to investigate the effect of a disease related mutation on intracellular transport, where two different CRISPR edits (i.e., correction of the disease-related mutation + fluorophore knock-in) are necessary to create isogenic control lines. It may be a reasonable approach for future studies to use fluorophore knock-in as a complementary method for validation of overexpression experiments, especially when assessing the transport and function of previously uncharacterized proteins.
In sum, it is our hope that the detailed quantitative analysis of organelle motility in iPSC-derived neurons reported here, and the direct comparisons with similar studies in primary hippocampal neurons, will provide important baseline data for researchers in future. The ability to study organelle trafficking in human iPSC neurons should accelerate studies on disease-associated mutations and possible therapeutic interventions.
Materials and Methods
Human iPSC Culture and Neuronal Differentiation
Human WTC11 iPSCs that harbor a doxycycline-inducible NGN2 transgene at the AAVS1 locus and stably express dCas9-BFP-KRAB (i3N iPSCs) have been previously described.9,51 iPSCs were kept on hESC-qualified Matrigel (Corning) and fed daily with Essential 8 medium. Cytogenetic analysis of G-banded metaphase cells demonstrated a normal male karyotype (Cell Line Genetics).
i3N iPSCs were differentiated into cortical i3Neurons following a previously described protocol.10 In brief, i3N iPSCs were dissociated with Accutase (STEMCELL Technologies) and plated on Matrigel-coated dishes in induction medium (DMEM/F12 medium containing 2 μg/mL doxycycline, 1% N2-supplement [Gibco], 1% NEAA [Gibco] and 1% GlutaMAX [Gibco]). After three days, pre-differentiated i3Neurons were dispersed using Accutase and plated on poly-L-ornithine (Sigma) coated 35 mm glass-bottom imaging dishes (P35G-1.5–20-C; MatTek) at a density of 300,000 cells per dish. i3Neurons were cultured in BrainPhys Neuronal Medium (STEMCELL Technologies), supplemented with 2% B27 (Gibco), 10 ng/mL BDNF (PeproTech), 10 ng/mL NT-3 (PeproTech), and 1 μg/mL Laminin (Corning). Every 3–4 days, 40% of the media was replaced with fresh media.
Primary Rat Hippocampal Neurons
E18 rat hippocampal neurons were obtained in suspension from the Neuron Culture Service Center at the University of Pennsylvania and plated on poly-L-lysine coated 35 mm glass-bottom imaging dishes (P35G-1.5–20-C; MatTek) at a density of 250,000 cells per dish. Hippocampal neurons were cultured in neurobasal media, supplemented with 2% B-27 (GIBCO), 58 mM glucose (Sigma), 2 mM GlutaMAX (GIBCO), 100 U/mL penicillin and 100 mg/mL streptomycin (Sigma). Every 3–4 days, 40% of the media was replaced with fresh media supplemented with 1 μM AraC.
Generation of LAMP1-EGFP knock-in iPSCs
One million Accutase-dissociated iPSCs were plated on one well of a Matrigel-coated 6-well plate in mTeSR1 media (STEMCELL Technologies). RNP complexes were formed following manufacturers recommendations using 12 μL of 1 μM HiFi Cas9 (IDT) and 12 μL of 1 μM synthetic sgRNA (Synthego, sgRNA sequence: GTGCACCAGGCTAGATAGTC). For transfection, RNP complexes were mixed with 2 μg LAMP1-EGFP donor plasmid (Addgene #101782), 0.4 μg pCE-mp53DD (dominant-negative p53, Addgene #41856) and 4 μL Lipofectamine Stem in 200 μL OptiMEM medium.
Cells were split on the day after transfection with Accutase and plated in 6 wells of a 6-well plate. After 4 days, GFP-positive cells were sorted via FACS and 10,000 GFP+ cells were plated on a Matrigel-coated 10 cm dish. Cells were grown for 10 days, until individual colonies reached ~ 1 mm in diameter. Individual colonies were picked and screened for successful gene editing. To identify GFP-tagged clones without plasmid backbone integration, we performed PCR reactions with primers for the GFP tag (5′-GCCGACAAGCAGAAGAACG-3′, 5′-GGGTGTTCTGCTGGTAGTGG-3′) and the ampicillin resistance gene of the vector backbone (5′- TTTCCGTGTCGCCCTTATTCC −3′, 5′- ATGTAACCCACTCGTGCACCC −3′), similar to a previously reported approach.8 Out of 24 picked colonies, 11 clones were successfully GFP-tagged while lacking plasmid backbone integration (2 clones were negative for GFP, 11 clones showed integration of the plasmid backbone).
For live-imaging, 200,000 Accutase-dissociated LAMP1-EGFP knock-in iPSCs were plated on 35 mm glass-bottom imaging dishes (MatTek) coated with phenol-red free Matrigel (Corning). Cells were imaged for 1 min at a frame rate of 3 frames per second with the spinning disc confocal setup described below.
Transfection of neuronal cells
All plasmids used human PGK1 promoter to initiate transcription. Plasmids used for neuronal live-imaging in this publication include: mito-mEmerald, LAMP1-mNeonGreen, EGFP-LC3 (plasmids will be added to Addgene), EGFP-Rab5 (modified from CMV-EGFP-Rab5, gift from M. Zerial, Max Planck Institute Dresden, Germany), EGFP-Rab7 (modified from CMV-EGFP-Rab7, Addgene), EGFP-Rab11 (modified from CMV-EGFP-Rab11a, gift from Margaret Chou, University of Pennsylvania, PA).
We found that transfection of i3Neurons with Lipofectamine Stem results in a relatively low, but sufficient transfection efficiency. A low transfection efficiency is advantageous for live-imaging experiments, as it makes it easy for the experimentalist to trace neurites and determine the directionality of transport.
For transfection of each imaging dish, 1 μg plasmid was mixed with 3 μL Lipofectamine Stem in 200 μL OptiMEM medium (i3Neurons) or mixed with 8 μL Lipofectamine 2000 in 300 μL Neurobasal medium (hippocampal neurons). Following 10 min (i3Neurons) or 20 min (hippocampal) incubation time of the Lipofectamine-DNA mix, conditioned culture media was removed from each imaging dish and reserved at 37°C. Conditioned media was replaced with 2 mL fresh culture media and the Lipofectamine-DNA mix was added dropwise to the cells. Imaging dishes were placed in the 37°C, 5% CO2 incubator for 45 minutes. Then, Lipofectamine-DNA containing media was removed and replaced with the conditioned media collected earlier.
Live-Imaging
Live-Imaging of i3Neurons was performed on DIV7–8 or DIV21–25. i3Neurons were transfected 24 h (mCherry-EB3), 48 h (Mito-mEmerald, EGFP-Rab5, EGFP-Rab7, LAMP1-mNeonGreen, EGFP-Rab11) or 72 h (EGFP-LC3) before imaging. i3Neurons were imaged in low-fluorescence Hibernate A media (BrainBits), supplemented with 2% B27, 10 ng/mL BDNF and 10 ng/mL NT-3. Live-Imaging of rat hippocampal neurons was performed on DIV7 or DIV8. Hippocampal neurons were transfected 24 h [EGFP-LC3, Mito-mEmerald (dendrites)] or 48 h [Mito-mEmerald (axons), EGFP-Rab5, EGFP-Rab7, LAMP1-mNeonGreen, EGFP-Rab11] before imaging. Hippocampal neurons were imaged in low-fluorescence Hibernate E media (BrainBits), supplemented with 2% B27 and 2 mM GlutaMAX.
LAMP1-EGFP i3Neurons were diluted 1:5 with non-fluorescent i3Neurons for live-imaging. Cells were transfected with Halo-Stop that was used as a cytosplasmic filler to identify individual cells and determine the directionality of their axons.
Neurons were imaged in an environmental chamber at 37 °C on a PerkinElmer UltraView Vox Spinning Disk Confocal system with a Nikon Eclipse Ti inverted microscope. Mitochondria (axons) and EB3-comets were imaged using a Plan Apochromat 60× 1.40 NA oil immersion objective. Rab-, LAMP1- and LC3- vesicles as well as mitochondria in dendrites were imaged using an Apochromat 100× 1.49 NA oil-immersion objective. Images were acquired with a Hamamatsu EMCCD C9100–50 camera driven by Volocity software. Axons and dendrites were identified based on morphological parameters (axons: at least ~300 μm length with uniform diameter; dendrites: branching close to the soma, tapering diameter with distance from the soma).52 Time lapse recordings were acquired at a framerate of 2 seconds per frame for 10 minutes (EB3-mCherry), 1 second per frame for 5 minutes (mito-mEmerald in axons) or 2 frames per second for 2 minutes (mito-mEmerald in dendrites, EGFP-LC3, LAMP1-mNeonGreen, EGFP-Rab5, EGFP-Rab7, EGFP-Rab11). Phase-contrast images of differentiating i3Neurons were recorded with an inverted DMI6000B microscope (Leica) using a HC Plan Apo 20× 0.70 NA PH2 dry objective and Leica LAS-X software.
Quantification of neurite number and axon length
i3Neurons and hippocampal neurons were transfected with GFP fill to asses neuron morphology. Neurons were imaged with an inverted DMI6000B microscope (Leica) using a HC Plan Apo 20× 0.70 NA PH2 dry objective and Leica LAS-X software. Images were stitched together using the FIJI plugin, Pairwise Stitching53, to view whole neuron. To quantify neurite number, stitched images were analyzed using FIJI plugin, Simple Neurite Tracer with Sholl Analysis.20,54 Axons were manually traced and measured using FIJI segmented line and ROI manger tool.
Immunofluorescence
For MAP2 and Ankyrin G staining, i3Neurons cultured on poly-L-ornithine coated 35 mm imaging dishes were fixed on DIV7 or DIV28 in PBS containing 4% paraformaldehyde and 4% sucrose for 9 minutes. Dishes were washed three times with PBS and blocked/permeabilized with blocking solution (PBS with 5% normal goat serum and 1% bovine serum albumin) + 0.1% Triton X. Primary antibodies against MAP2 (MAB3418, Millipore, 1:200 or AB5622, Millipore, 1:1000) and Ankyrin G (sc-28561, Santa Cruz, 1:200 or #75–146, NeuroMab, 1:1000) were incubated for 1 hour at room temperature in blocking solution. After removing primary antibodies and washing three times with PBS, cells were incubated with fluorophore-conjugated secondary antibodies (1:1000 anti-mouse Alexa 555, anti-rabbit Alexa 633; Invitrogen) for 1 hour at room temperature in blocking solution. Nuclei were stained with Hoechst dye (Thermo Fisher). Following three washes with PBS, dishes were mounted with 18 mm round coverslips using ProLong Glass Antifade Mountant (Invitrogen).
LAMP1-EGFP knock-in i3Neurons were fixed on DIV8 in −20°C Methanol for 5 min. Dishes were washed three times with PBS and blocked with blocking solution (PBS with 5% normal goat serum and 1% bovine serum albumin). Primary antibody against LAMP1 (#24170, Abcam, 1:1000) was incubated for 1 hour at room temperature in blocking solution. After removing primary antibodies and washing three times with PBS, cells were incubated with fluorophore-conjugated secondary antibodies (1:1000 anti-rabbit Alexa 555) for 1 hour at room temperature in blocking solution. Nuclei were stained with Hoechst dye (Thermo Fisher). Following three washes, cells were imaged in PBS.
Images were acquired as z-Stacks with a step size of 0.1 μm on the spinning disk setup described above. Images shown in Figure 10B and C were deconvolved using Huygens Professional software. Maximum intensity projections were generated using open-source software ImageJ.
Quantification and Statistical Analysis
Kymographs were generated using the Multiple Kymograph plugin for FIJI (line width 3 for axons and 5 for dendrites). Tracks of individual organelles were manually traced using a custom MATLAB GUI (Kymograph Suite). Motile vesicles (e.g., anterograde or retrograde) were defined by net displacement >10 μm while non-motile (bidirectional/stationary) vesicles were defined by net displacement <10 μm. Retrograde or anterograde net velocities are velocities of all individual vesicles moving in the net retrograde or anterograde direction, without binning into “non-motile” or “motile” vesicles by the net displacement cutoff. Density was determined by manually counting organelles in the first frame of movies and measuring the length of observed neurite length in video. Data was normalized to 30 μm of neurite length (instead of 50 or 100 μm) to avoid extrapolation of data in the shorter dendrites. Straightened images of the first acquired frame were generated using the Straighten function in ImageJ.
All statistical analyses were performed with GraphPad Prism. Student’s t test or Mann-Whitney test was used when comparing two data sets, as indicated, while a two-way analysis of variance (ANOVA) was used with multiple data sets. For all experiments, data was analyzed from at least three independent replicates. Statistical significance is noted as follows: ns, p > 0.05; *, p < 0.05; **, p < 0.01; ***, p < 0.001. Figure legends contain specific p-value for that figure.
Supplementary Material
Supplementary Video 1: Live-Imaging of undifferentiated LAMP1-EGFP knock-in iPSCs. Acquired at 3 frames per second for 1 min, Video is playing at 20 fps.
Supplementary Video 2: Live-Imaging of axonal LAMP1-EGFP vesicle transport in a LAMP1-EGFP knock-in i3Neuron at DIV8. Retrograde is to the left. Acquired at 3 frames per second for 3 min, video is playing at 20 fps.
Figure S1. Number of Axon Initial Segments (AIS) in i3Neurons DIV7
A. Maximum intensity projection of an i3Neuron DIV7 stained with MAP2 (green), AnkG (magenta) and Hoechst DNA stain (blue). Arrows highlight AIS, marked by increased AnkG staining. Scale bar is 10 μm.
B. Maximum intensity projection of a i3Neuron DIV7 with two AIS. Arrows highlight AIS, marked by increased AnkG staining. Scale bar is 10 μm.
C. Quantification of AIS number in i3Neurons DIV7. N=55 cells.
Figure S2. Motility of axonal Rab7 vesicles and dendritic Rab11 vesicles in i3Neurons DIV8
A. Motility of axonal Rab7 vesicles fractioned into retrograde, anterograde and non-motile events per neuron. Bar graph with mean ± S.E.M., two-way ANOVA with Tukey’s multiple comparisons test (retro [ns p>0.05, *=0.0149], non-motile [*p=0.0168, **p=0.0016], antero [ns p>0.05]). N: hippo = 22, i3 DIV8 = 23, i3 DIV23–25 = 19 neurons. Data for hippo DIV8 and i3 DIV23–25 repeated from Figure 4.
B. Motility of dendritic Rab11 fractioned into retrograde, anterograde and non-motile events per neuron. Bar graph with mean ± S.E.M., two-way ANOVA with Tukey’s multiple comparisons test (retro [**p=0.0072, *p=0.031], non-motile [***p<0.0001,], antero [hippo-i3DIV8 p=0.0074, hippo-i3DIV23–25 p=0.0033]). N: hippo = 19, i3 DIV8 = 20, i3 DIV23–25 = 18 neurons. Data for hippo DIV8 and i3 DIV23–25 repeated from Figure 7.
Synopsis:
Induced pluripotent stem cells (iPSCs) hold promise to revolutionize studies of intracellular transport in human neurons. Here, we describe an approach for live-imaging axonal and dendritic transport in iPSC-derived cortical neurons. We characterize the motility of endosomes, autophagosomes and mitochondria. Comparing transport parameters of these organelles with data from rat hippocampal neurons, we uncover remarkable similarities. Furthermore, we generated LAMP1-EGFP knock-in iPSCs and show that knock-in neurons can be used to study transport of endogenously labeled vesicles.
Acknowledgements
We thank Jean Ann Maguire and the staff of the Human Pluripotent Stem Cell Core at the Children’s Hospital of Philadelphia for expertise in the generation of CRISPR knock-in iPSCs, and Katie Copley for critical review of the manuscript. This work was supported by the German Research Foundation (DFG; grant BO 5434/1-1 to C.A. Boecker), the National Institutes of Health (grant R37 NS060698 to E.L.F. Holzbaur and grant T32 GM07229 to E.R. Gallagher), the Michael J. Fox Foundation (Grant #15100 to E.L.F. Holzbaur), and, in part, by the Intramural Research Program, National Institute of Neurological Disorders and Stroke, National Institutes of Health (M.E. Ward). The authors declare no competing financial interests.
References:
- 1.Millecamps S, Julien JP. Axonal transport deficits and neurodegenerative diseases. Nat Rev Neurosci. 2013;14(3):161–176. doi: 10.1038/nrn3380 [DOI] [PubMed] [Google Scholar]
- 2.Ghiretti AE, Thies E, Tokito MK, et al. Activity-Dependent Regulation of Distinct Transport and Cytoskeletal Remodeling Functions of the Dendritic Kinesin KIF21B. Neuron. 2016;92(4):857–872. doi: 10.1016/j.neuron.2016.10.003 [DOI] [PMC free article] [PubMed] [Google Scholar]
- 3.Ayloo S, Guedes-Dias P, Ghiretti AE, Holzbaur ELF. Dynein efficiently navigates the dendritic cytoskeleton to drive the retrograde trafficking of BDNF/TrkB signaling endosomes. Mol Biol Cell. 2017;28(19):2543–2554. doi: 10.1091/mbc.e17-01-0068 [DOI] [PMC free article] [PubMed] [Google Scholar]
- 4.Tas RP, Chazeau A, Cloin BMC, Lambers MLA, Hoogenraad CC, Kapitein LC. Differentiation between Oppositely Oriented Microtubules Controls Polarized Neuronal Transport. Neuron. 2017;96(6):1264–1271.e5. doi: 10.1016/j.neuron.2017.11.018 [DOI] [PMC free article] [PubMed] [Google Scholar]
- 5.Nirschl JJ, Ghiretti AE, Holzbaur ELF. The impact of cytoskeletal organization on the local regulation of neuronal transport. Nat Rev Neurosci. 2017;18(10):585–597. doi: 10.1038/nrn.2017.100 [DOI] [PMC free article] [PubMed] [Google Scholar]
- 6.Staahl BT, Benekareddy M, Coulon-Bainier C, et al. Efficient genome editing in the mouse brain by local delivery of engineered Cas9 ribonucleoprotein complexes. Nat Biotechnol. 2017;35(5):431–434. doi: 10.1038/nbt.3806 [DOI] [PMC free article] [PubMed] [Google Scholar]
- 7.Savell KE, Bach SV, Zipperly ME, et al. A Neuron-Optimized CRISPR/dCas9 Activation System for Robust and Specific Gene Regulation. eNeuro. 2019;6(1):ENEURO.0495–18.2019. doi: 10.1523/ENEURO.0495-18.2019 [DOI] [PMC free article] [PubMed] [Google Scholar]
- 8.Roberts B, Haupt A, Tucker A, et al. Systematic gene tagging using CRISPR/Cas9 in human stem cells to illuminate cell organization. Mol Biol Cell. 2017;28(21):2854–2874. doi: 10.1091/mbc.e17-03-0209 [DOI] [PMC free article] [PubMed] [Google Scholar]
- 9.Wang C, Ward ME, Chen R, et al. Scalable Production of iPSC-Derived Human Neurons to Identify Tau-Lowering Compounds by High-Content Screening. Stem Cell Reports. 2017;9(4):1221–1233. doi: 10.1016/j.stemcr.2017.08.019 [DOI] [PMC free article] [PubMed] [Google Scholar]
- 10.Fernandopulle MS, Prestil R, Grunseich C, Wang C, Gan L, Ward ME. Transcription Factor-Mediated Differentiation of Human iPSCs into Neurons. Curr Protoc Cell Biol. 2018;79(1):e51. doi: 10.1002/cpcb.51 [DOI] [PMC free article] [PubMed] [Google Scholar]
- 11.Zhang Y, Pak C, Han Y, et al. Rapid Single-Step Induction of Functional Neurons from Human Pluripotent Stem Cells. Neuron. 2013;78(5):785–798. doi: 10.1016/j.neuron.2013.05.029 [DOI] [PMC free article] [PubMed] [Google Scholar]
- 12.Rhee HJ, Shaib AH, Rehbach K, et al. An Autaptic Culture System for Standardized Analyses of iPSC-Derived Human Neurons. Cell Rep. 2019;27(7):2212–2228.e7. doi: 10.1016/j.celrep.2019.04.059 [DOI] [PubMed] [Google Scholar]
- 13.Meijer M, Rehbach K, Brunner JW, et al. A Single-Cell Model for Synaptic Transmission and Plasticity in Human iPSC-Derived Neurons. Cell Rep. 2019;27(7):2199–2211.e6. doi: 10.1016/j.celrep.2019.04.058 [DOI] [PubMed] [Google Scholar]
- 14.Yap CC, Digilio L, McMahon LP, Garcia ADR, Winckler B. Degradation of dendritic cargos requires Rab7-dependent transport to somatic lysosomes. J Cell Biol. 2018;217(9):3141–3159. doi: 10.1083/jcb.201711039 [DOI] [PMC free article] [PubMed] [Google Scholar]
- 15.Olenick MA, Dominguez R, Holzbaur ELF. Dynein activator Hook1 is required for trafficking of BDNF-signaling endosomes in neurons. J Cell Biol. 2019;218(1):220–233. doi: 10.1083/jcb.201805016 [DOI] [PMC free article] [PubMed] [Google Scholar]
- 16.Farías GG, Guardia CM, De Pace R, Britt DJ, Bonifacino JS. BORC/kinesin-1 ensemble drives polarized transport of lysosomes into the axon. Proc Natl Acad Sci. 2017;114(14):E2955–E2964. doi: 10.1073/pnas.1616363114 [DOI] [PMC free article] [PubMed] [Google Scholar]
- 17.Carlson-Stevermer J, McLean PJ, Delenclos M, et al. CRISPR/Cas9 editing of APP C-terminus attenuates β-cleavage and promotes α-cleavage. Nat Commun. 2018;10(1):1–11. doi: 10.1038/s41467-018-07971-8 [DOI] [PMC free article] [PubMed] [Google Scholar]
- 18.Cai Q, Lu L, Tian JH, Zhu YB, Qiao H, Sheng ZH. Snapin-regulated late endosomal transport is critical for efficient autophagy-lysosomal function in neurons. Neuron. 2010;68(1):73–86. doi: 10.1016/j.neuron.2010.09.022 [DOI] [PMC free article] [PubMed] [Google Scholar]
- 19.Kuijpers M, van de Willige D, Freal A, et al. Dynein Regulator NDEL1 Controls Polarized Cargo Transport at the Axon Initial Segment. Neuron. 2016;89(3):461–471. doi: 10.1016/j.neuron.2016.01.022 [DOI] [PubMed] [Google Scholar]
- 20.Ferreira TA, Blackman AV, Oyrer J, et al. Neuronal morphometry directly from bitmap images. Nat Methods. 2014;11(10):982–984. doi: 10.1038/nmeth.3125 [DOI] [PMC free article] [PubMed] [Google Scholar]
- 21.Rooney GE, Goodwin AF, Depeille P, et al. Human iPS Cell-Derived Neurons Uncover the Impact of Increased Ras Signaling in Costello Syndrome. J Neurosci. 2016;36(1):142–152. doi: 10.1523/jneurosci.1547-15.2016 [DOI] [PMC free article] [PubMed] [Google Scholar]
- 22.Klim JR, Williams LA, Limone F, et al. ALS-implicated protein TDP-43 sustains levels of STMN2, a mediator of motor neuron growth and repair. Nat Neurosci. 2019;22(2):167–179. doi: 10.1038/s41593-018-0300-4 [DOI] [PMC free article] [PubMed] [Google Scholar]
- 23.Deshpande A, Yadav S, Dao DQ, et al. Cellular Phenotypes in Human iPSC-Derived Neurons from a Genetic Model of Autism Spectrum Disorder. Cell Rep. 2017;21(10):2678–2687. doi: 10.1016/j.celrep.2017.11.037 [DOI] [PMC free article] [PubMed] [Google Scholar]
- 24.Ren Y, Jiang H, Hu Z, et al. Parkin Mutations Reduce the Complexity of Neuronal Processes in iPSC-Derived Human Neurons. Stem Cells. 2015;33(1):68–78. doi: 10.1002/stem.1854 [DOI] [PMC free article] [PubMed] [Google Scholar]
- 25.Forrest MP, Zhang H, Moy W, et al. Open Chromatin Profiling in hiPSC-Derived Neurons Prioritizes Functional Noncoding Psychiatric Risk Variants and Highlights Neurodevelopmental Loci. Cell Stem Cell. 2017;21(3):305–318.e8. doi: 10.1016/j.stem.2017.07.008 [DOI] [PMC free article] [PubMed] [Google Scholar]
- 26.Keil KP, Sethi S, Wilson MD, Chen H, Lein PJ. In vivo and in vitro sex differences in the dendritic morphology of developing murine hippocampal and cortical neurons. Sci Rep. 2017;7(1):1–15. doi: 10.1038/s41598-017-08459-z [DOI] [PMC free article] [PubMed] [Google Scholar]
- 27.Sethi S, Keil KP, Lein PJ. Species and Sex Differences in the Morphogenic Response of Primary Rodent Neurons to 3,3′-Dichlorobiphenyl (PCB 11). Toxics. 2017;6(1):4. doi: 10.3390/toxics6010004 [DOI] [PMC free article] [PubMed] [Google Scholar]
- 28.Stepanova T, Slemmer J, Hoogenraad CC, et al. Visualization of Microtubule Growth in Cultured Neurons via the Use of EB3-GFP (End-Binding Protein 3-Green Fluorescent Protein). J Neurosci. 2003;23(7):2655–2664. doi: 10.1523/JNEUROSCI.23-07-02655.2003 [DOI] [PMC free article] [PubMed] [Google Scholar]
- 29.Baas PW, Deitch JS, Black MM, Banker GA. Polarity orientation of microtubules in hippocampal neurons: uniformity in the axon and nonuniformity in the dendrite. Proc Natl Acad Sci. 1988;85(21):8335–8339. doi: 10.1073/pnas.85.21.8335 [DOI] [PMC free article] [PubMed] [Google Scholar]
- 30.Kleele T, Marinković P, Williams PR, et al. An assay to image neuronal microtubule dynamics in mice. Nat Commun. 2014;5:4827. doi: 10.1038/ncomms5827 [DOI] [PMC free article] [PubMed] [Google Scholar]
- 31.Nirschl JJ, Magiera MM, Lazarus JE, Janke C, Holzbaur ELF. α-Tubulin Tyrosination and CLIP-170 Phosphorylation Regulate the Initiation of Dynein-Driven Transport in Neurons. Cell Rep. 2016;14(11):2637–2652. doi: 10.1016/j.celrep.2016.02.046 [DOI] [PMC free article] [PubMed] [Google Scholar]
- 32.Guedes-Dias P, Nirschl JJ, Abreu N, et al. Kinesin-3 Responds to Local Microtubule Dynamics to Target Synaptic Cargo Delivery to the Presynapse Article Kinesin-3 Responds to Local Microtubule Dynamics to Target Synaptic Cargo Delivery to the Presynapse. Curr Biol. 2018;29:1–15. doi: 10.1016/j.cub.2018.11.065 [DOI] [PMC free article] [PubMed] [Google Scholar]
- 33.Deinhardt K, Salinas S, Verastegui C, et al. Rab5 and Rab7 Control Endocytic Sorting along the Axonal Retrograde Transport Pathway. Neuron. 2006;52(2):293–305. doi: 10.1016/j.neuron.2006.08.018 [DOI] [PubMed] [Google Scholar]
- 34.Cheng X-T, Xie Y-X, Zhou B, Huang N, Farfel-Becker T, Sheng Z-H. Characterization of LAMP1-labeled nondegradative lysosomal and endocytic compartments in neurons. J Cell Biol. 2018;217(9):3127–3139. doi: 10.1083/jcb.201711083 [DOI] [PMC free article] [PubMed] [Google Scholar]
- 35.Boecker CA, Holzbaur EL. Vesicular degradation pathways in neurons: at the crossroads of autophagy and endo-lysosomal degradation. Curr Opin Neurobiol. 2019;57:94–101. doi: 10.1016/j.conb.2019.01.005 [DOI] [PMC free article] [PubMed] [Google Scholar]
- 36.Kabeya Y, Mizushima N, Ueno T, et al. LC3, a mammalian homologue of yeast Apg8p, is localized in autophagosome membranes after processing. EMBO J. 2000;19(21):5720–5728. doi: 10.1093/emboj/19.21.5720 [DOI] [PMC free article] [PubMed] [Google Scholar]
- 37.Maday S, Wallace KE, Holzbaur ELF. Autophagosomes initiate distally and mature during transport toward the cell soma in primary neurons. J Cell Biol. 2012;196(4):407–417. doi: 10.1083/jcb.201106120 [DOI] [PMC free article] [PubMed] [Google Scholar]
- 38.Maday S, Holzbaur ELF. Compartment-Specific Regulation of Autophagy in Primary Neurons. J Neurosci. 2016;36(22):5933–5945. doi: 10.1523/JNEUROSCI.4401-15.2016 [DOI] [PMC free article] [PubMed] [Google Scholar]
- 39.Huang S-H, Wang J, Sui W-H, et al. BDNF-Dependent Recycling Facilitates TrkB Translocation to Postsynaptic Density during LTP via a Rab11-Dependent Pathway. J Neurosci. 2013;33(21):9214–9230. doi: 10.1523/JNEUROSCI.3256-12.2013 [DOI] [PMC free article] [PubMed] [Google Scholar]
- 40.Lazo OM, Gonzalez A, Ascaño M, Kuruvilla R, Couve A, Bronfman FC. BDNF Regulates Rab11-Mediated Recycling Endosome Dynamics to Induce Dendritic Branching. J Neurosci. 2013;33(14):6112–6122. doi: 10.1523/JNEUROSCI.4630-12.2013 [DOI] [PMC free article] [PubMed] [Google Scholar]
- 41.Lewis TL, Turi GF, Kwon SK, Losonczy A, Polleux F. Progressive Decrease of Mitochondrial Motility during Maturation of Cortical Axons In Vitro and In Vivo. Curr Biol. 2016;26(19):2602–2608. doi: 10.1016/j.cub.2016.07.064 [DOI] [PMC free article] [PubMed] [Google Scholar]
- 42.Banker GA, Cowan WM. Rat hippocampal neurons in dispersed cell culture. Brain Res. 1977;126(3):397–425. doi: 10.1016/0006-8993(77)90594-7 [DOI] [PubMed] [Google Scholar]
- 43.Davis L, Banker GA, Steward O. Selective dendritic transport of RNA in hippocampal neurons in culture. Nature. 1987;330(6147):477–479. doi: 10.1038/330477a0 [DOI] [PubMed] [Google Scholar]
- 44.Liu TL, Upadhyayula S, Milkie DE, et al. Observing the cell in its native state: Imaging subcellular dynamics in multicellular organisms. Science (80- ). 2018;360(6386). doi: 10.1126/science.aaq1392 [DOI] [PMC free article] [PubMed] [Google Scholar]
- 45.Sleigh JN, Vagnoni A, Twelvetrees AE, Schiavo G. Methodological advances in imaging intravital axonal transport. F1000Research. 2017;6(0):200. doi: 10.12688/f1000research.10433.1 [DOI] [PMC free article] [PubMed] [Google Scholar]
- 46.Park M, Penick EC, Edwards JG, Kauer JA, Ehlers MD. Recycling endosomes supply AMPA receptors for LTP. Science. 2004;305(5692):1972–1975. doi: 10.1126/science.1102026 [DOI] [PubMed] [Google Scholar]
- 47.Misgeld T, Kerschensteiner M, Bareyre FM, Burgess RW, Lichtman JW. Imaging axonal transport of mitochondria in vivo. Nat Methods. 2007;4(7):559–561. doi: 10.1038/nmeth1055 [DOI] [PubMed] [Google Scholar]
- 48.Plucinska G, Paquet D, Hruscha A, et al. In Vivo Imaging of Disease-Related Mitochondrial Dynamics in a Vertebrate Model System. J Neurosci. 2012;32(46):16203–16212. doi: 10.1523/jneurosci.1327-12.2012 [DOI] [PMC free article] [PubMed] [Google Scholar]
- 49.Sung H, Tandarich LC, Nguyen K, Hollenbeck PJ. Compartmentalized Regulation of Parkin-Mediated Mitochondrial Quality Control in the Drosophila Nervous System In Vivo. J Neurosci. 2016;36(28):7375–7391. doi: 10.1523/JNEUROSCI.0633-16.2016 [DOI] [PMC free article] [PubMed] [Google Scholar]
- 50.Vagnoni A, Hoffmann PC, Bullock SL. Reducing Lissencephaly-1 levels augments mitochondrial transport and has a protective effect in adult Drosophila neurons. J Cell Sci. 2016;129(1):178–190. doi: 10.1242/jcs.179184 [DOI] [PMC free article] [PubMed] [Google Scholar]
- 51.Zhang Y-J, Guo L, Gonzales PK, et al. Heterochromatin anomalies and double-stranded RNA accumulation underlie C9orf72 poly(PR) toxicity. Science (80- ). 2019;363(6428):eaav2606. doi: 10.1126/science.aav2606 [DOI] [PMC free article] [PubMed] [Google Scholar]
- 52.Kaech S, Banker G. Culturing hippocampal neurons. Nat Protoc. 2006;1(5):2406–2415. doi: 10.1038/nprot.2006.356 [DOI] [PubMed] [Google Scholar]
- 53.Preibisch S, Saalfeld S, Tomancak P. Globally optimal stitching of tiled 3D microscopic image acquisitions. Bioinformatics. 2009;25(11):1463–1465. doi: 10.1093/bioinformatics/btp184 [DOI] [PMC free article] [PubMed] [Google Scholar]
- 54.Longair MH, Baker DA, Armstrong JD. Simple neurite tracer: Open source software for reconstruction, visualization and analysis of neuronal processes. Bioinformatics. 2011;27(17):2453–2454. doi: 10.1093/bioinformatics/btr390 [DOI] [PubMed] [Google Scholar]
Associated Data
This section collects any data citations, data availability statements, or supplementary materials included in this article.
Supplementary Materials
Supplementary Video 1: Live-Imaging of undifferentiated LAMP1-EGFP knock-in iPSCs. Acquired at 3 frames per second for 1 min, Video is playing at 20 fps.
Supplementary Video 2: Live-Imaging of axonal LAMP1-EGFP vesicle transport in a LAMP1-EGFP knock-in i3Neuron at DIV8. Retrograde is to the left. Acquired at 3 frames per second for 3 min, video is playing at 20 fps.
Figure S1. Number of Axon Initial Segments (AIS) in i3Neurons DIV7
A. Maximum intensity projection of an i3Neuron DIV7 stained with MAP2 (green), AnkG (magenta) and Hoechst DNA stain (blue). Arrows highlight AIS, marked by increased AnkG staining. Scale bar is 10 μm.
B. Maximum intensity projection of a i3Neuron DIV7 with two AIS. Arrows highlight AIS, marked by increased AnkG staining. Scale bar is 10 μm.
C. Quantification of AIS number in i3Neurons DIV7. N=55 cells.
Figure S2. Motility of axonal Rab7 vesicles and dendritic Rab11 vesicles in i3Neurons DIV8
A. Motility of axonal Rab7 vesicles fractioned into retrograde, anterograde and non-motile events per neuron. Bar graph with mean ± S.E.M., two-way ANOVA with Tukey’s multiple comparisons test (retro [ns p>0.05, *=0.0149], non-motile [*p=0.0168, **p=0.0016], antero [ns p>0.05]). N: hippo = 22, i3 DIV8 = 23, i3 DIV23–25 = 19 neurons. Data for hippo DIV8 and i3 DIV23–25 repeated from Figure 4.
B. Motility of dendritic Rab11 fractioned into retrograde, anterograde and non-motile events per neuron. Bar graph with mean ± S.E.M., two-way ANOVA with Tukey’s multiple comparisons test (retro [**p=0.0072, *p=0.031], non-motile [***p<0.0001,], antero [hippo-i3DIV8 p=0.0074, hippo-i3DIV23–25 p=0.0033]). N: hippo = 19, i3 DIV8 = 20, i3 DIV23–25 = 18 neurons. Data for hippo DIV8 and i3 DIV23–25 repeated from Figure 7.