

Abstract
Background
Chronic hepatitis B has serious effects on morbidity and mortality. Alfa interferon has been shown to increase the rates of HBeAg‐clearance as well as seroconversion to anti‐HBe, but response rates are unsatisfactory. Glucocorticosteroid pretreatment may increase the response to alfa interferon.
Objectives
The objectives were to assess the effects of the sequential combination of glucocorticosteroids and alfa interferon versus alfa interferon alone in hepatitis B 'e' antigen positive chronic hepatitis B on mortality, virological response, biochemical response, liver histology, quality of life, and adverse events.
Search methods
Eligible trials were identified through searches of The Cochrane Hepato‐Biliary Controlled Trials Register (May 2005), The Cochrane Central Register of Controlled Trials in The Cochrane Library (Issue 2, 2005), MEDLINE (1950 to May 2005), EMBASE (Excerpta Medica Database) (1980 to May 2005), BIOSIS (1969 to May 2005), and reference lists of relevant articles. Further trials were sought through correspondence with authors of trials and pharmaceutical companies.
Selection criteria
Randomised clinical trials comparing identical alfa interferon treatment regimens with and without glucocorticosteroid pretreatment for hepatitis B 'e' antigen positive chronic hepatitis. We included trials irrespective blinding, publication status, or language.
Data collection and analysis
Three authors selected the trials independently and one extracted the data, which were then validated. We performed assessments of the outcome measures at the end of treatment and at six months and at maximal follow‐up after the end of treatment with alfa interferon.
Main results
We included a total of 13 randomised trials with 790 patients. Loss of hepatitis B 'e' antigen (OR 1.41, 95% confidence interval 1.03 to 1.92, P = 0.03) and hepatitis B virus DNA (OR = 1.51, 95% confidence interval 1.12 to 2.05, P = 0.008) were significantly more frequent among patients treated with the sequential combination of glucocorticosteroids and alfa interferon than among patients treated with alfa interferon alone. Glucocorticosteroid pretreatment did not significantly influence seroconversion from hepatitis B 'e' antigen to antibodies to hepatitis B 'e' antigen, loss of hepatitis B surface antigen, normalisation of alanine aminotransferase/aspartate aminotransferase activities, and severity of adverse events. Glucocorticosteroid pretreatment did not significantly affect mortality and adverse events. The effect of glucocorticosteroid pretreatment on liver histology and quality of life could not be assessed due to insufficient data.
Authors' conclusions
Pretreatment with glucocorticosteroids before treatment with alfa interferon in patients with hepatitis B 'e' antigen positive chronic hepatitis B may be more effective than treatment with alfa interferon alone with regard to loss of hepatitis B 'e' antigen and hepatitis B virus DNA, but evidence for effect on clinical outcomes is lacking.
Plain language summary
Glucocorticosteroid pretreatment may increase virologic response to interferon in hepatitis B 'e' antigen positive chronic hepatitis B
Interferon is an established treatment for chronic infection with hepatitis B virus. Although it is effective, response rates are not satisfactory. In order to increase response rates glucocorticosteroid withdrawal therapy has been proposed as a pretreatment strategy. The objectives of this review were to assess the effects of the sequential combination of glucocorticosteroids and interferon compared to interferon alone in the treatment of chronic hepatitis B. Glucocorticosteroid pretreatment was associated with a significantly higher frequency of loss of hepatitis B markers (HBeAg and HBV DNA), but had no significant effect on clinical outcomes.
Background
Alfa interferon (IFN) treatment is an established treatment for chronic hepatitis B (Lok 2001). Seroconversion from hepatitis B 'e' antigen (HBeAg) to antibody to HBeAg (anti‐HBe) is seen in approximately 35% of patients following treatment with IFN as opposed to 10% to 20% receiving no treatment (Brook 1989; Hoofnagle 1988; Saracco 1989). Meta‐analyses of the classical type (Wong 1993) and meta‐analyses based on individual patient data (Krogsgaard 1994) have shown that IFN increases the probability of loss of HBeAg by a factor two‐three depending on the total IFN dose. Although the effect of IFN seems indisputable, response rates are, from a clinical point of view, unsatisfactory. Pretreatment with glucocorticosteroids is one of the proposed ways to increase the response to IFN treatment.
The rationale for glucocorticosteroid pretreatment therapy stems from an early clinical observation that patients with chronic hepatitis B virus (HBV) infection often cleared markers of viral replication following tapering or discontinuing glucocorticosteroid treatment (Scullard 1979; Müller 1981; Weller 1982). In order to examine the effect of glucocorticosteroid withdrawal on its own, Nair et al (Nair 1986) found that 16 of 20 patients withdrawn from a short course of prednisone (a glucocorticosteroid) had a transient transaminase flare‐up followed by HBV DNA and HBeAg loss in 14 and 10 patients, respectively. Hence studies were designed to combine the effects of glucocorticosteroid withdrawal and IFN therapy. In 1990 Perrillo et al (Perrillo 1990) reported the results of a large multicentre trial examining the effect of prednisone withdrawal therapy followed by IFN 2b at 5 megaunits (MU) daily. This study did not demonstrate any beneficial effect of prednisone pretreatment, although there seemed to be a tendency towards an effect of pretreatment in patients with lower levels of transaminases. These findings were confirmed in a smaller European study (Fevery 1990). A meta‐analysis (Cohard 1994) of published studies of prednisone and IFN in chronic hepatitis B, including seven published studies directly comparing IFN with and without pre‐treatment, did not demonstrate a significant increase in efficacy of IFN when pretreatment was added. However, a later European multicentre trial (Krogsgaard 1996) showed that adult patients with chronic hepatitis B treated with human lymphoblastoid interferon 10 MU thrice weekly benefit from pretreatment with relatively low doses of prednisolone (another glucocorticosteroid) administered in a four week tapering regimen followed by a two week period of no treatment. Irrespective of the serological end point chosen (HBeAg disappearance or HBeAg to anti‐HBe seroconversion) the survival analysis demonstrated a significant effect of prednisolone pretreatment. By adding prednisolone pretreatment, the overall response rate increased from 28% to 44% for HBeAg disappearance and 23% to 38% for HBeAg to anti‐HBe seroconversion. In the light of these conflicting findings and in the absence of a systematic review the value of glucocorticosteroid pretreatment remains enigmatic for patients with HBeAg‐positive chronic hepatitis B.
Objectives
The objectives were to assess the effects of the sequential combination of glucocorticosteroids and IFN compared to IFN alone in chronic hepatitis B on mortality, active viral replication, biochemical disease activity, liver histology, quality of life, and adverse events.
Methods
Criteria for considering studies for this review
Types of studies
We sought to identify all randomised trials comparing identical IFN treatment regimens with and without glucocorticosteroid pretreatment. In order to embark upon a pragmatic approach and in the light of the anticipated limited number of trials carried out, the present systematic review included trials using any type of IFN and any type of glucocorticosteroid. Initially, in order to exclude trials with a potentially biased treatment allocation we planned only to include studies in which specified concealed randomisation was employed (see below under 'Methodology of included studies'). The randomised trials could be open, single blinded or double blinded.
Types of participants
Patients of either gender with HBeAg‐positive chronic hepatitis B infection (HBsAg positive and HBeAg positive more than six months), active inflammatory disease (activities of aspartate aminotransferase or alanine aminotransferase elevated above the upper limit of the normal range), and liver biopsy findings compatible with a diagnosis of chronic hepatitis B. No patient exclusion criteria was applied, apart from the fact that this review does not include HBeAg‐negative patients with chronic hepatitis B, that is, patients in which the precore mutant virus predominates (Lok 2001).
Types of interventions
The review includes randomised comparisons between glucocorticosteroids followed by IFN versus IFN alone. Only studies comparing identical regimens of IFN treatment with or without preceding glucocorticosteroid treatment were considered for inclusion. No limitations were applied regarding IFN type, IFN treatment regimen, glucocorticosteroid type, and glucocorticosteroid treatment regimen.
Types of outcome measures
The following outcome measures were evaluated, in spite of the fact that data were sparse on some or several. (1) All cause mortality. (2) Virological response criteria: loss of HBeAg, HBeAg to anti‐HBe seroconversion, loss of HBV DNA, and loss of hepatitis B surface antigen (HBsAg). (3) Biochemical response criteria: normalisation of aspartate aminotransferase (AST) levels or normalisation of alanine aminotransferase (ALT) levels. (4) Liver histology: comparisons of post‐treatment liver biopsies concentrating on changes in inflammation, histological scores, and overall appearance (chronic persistent hepatitis, chronic active hepatitis or cirrhosis). (5) Quality of life. (6) Adverse events: adverse events as well as serious adverse events defined as any untoward medical occurrence in a patient in either of the two described regimens which did not necessarily have a causal relationship with the treatment, but did, however, result in a dose reduction or discontinuation of treatment. Serious adverse events were defined according to the ICH guidelines (ICHGCP 1997) as any event that: • led to death, • were life‐threatening, • required inpatient hospitalisation or prolongation of existing hospitalisation, • resulted in persistent or significant disability or congenital anomaly/birth defect, • any important medical event, which may have jeopardised the patient or required intervention to prevent it.
The assessments were performed at maximal follow‐up (all outcome measures) and at 6 and 12 months following the end of treatment (virological response, biochemical response, liver histology, quality of life, and adverse events).
Search methods for identification of studies
We searched The Cochrane Hepato‐Biliary Group Controlled Trials Register (May 2005), The Cochrane Central Register of Controlled Trials in The Cochrane Library (Issue 2, 2005), MEDLINE (1950 to May 2005), EMBASE (Excerpta Medica Database) (1980 to May 2005), and BIOSIS (1969 to May 2005) (seeAppendix 1). In addition, we scanned reference lists from review articles retrieved from these searches in order to identify additional trials. Trials were also sought through correspondence with authors of trials and pharmaceutical manufactures of interferon.
Data collection and analysis
Methods used to select trials for inclusion Three of the authors (MM, KK, and TP) independently selected the trials included in the review. Disagreements were solved through discussion.
Assessment of methodological quality We assessed the methodological quality of the randomised clinical trials by using four components (Schultz 1995; Moher 1998; Kjaergard 2001):
Generation of the allocation sequence
Adequate, if the allocation sequence was generated by a computer or random number table. Drawing of lots, tossing of a coin, shuffling of cards, or throwing dice were considered as adequate if a person who had not been otherwise involved in the recruitment of participants performed the procedure.
Unclear, if the trial was described as randomised, but the method used for the allocation sequence generation was not described.
Inadequate, if a system involving dates, names, or admittance numbers were used for the allocation of patients. These studies are known as quasi‐randomised and were excluded from the present review.
Allocation concealment
Adequate, if the allocation of patients involved a central independent unit, on‐site locked computer, identically appearing numbered drug bottles or containers prepared by an independent pharmacist or investigator, or sealed envelopes.
Unclear, if the trial was described as randomised, but the method used to conceal the allocation was not described.
Inadequate, if the allocation sequence was known to the investigators who assigned participants or if the study was quasi‐randomised.
Blinding (or masking)
Adequate, if the trial was described as double blind and the method of blinding involved identical placebo or active drug.
Unclear, if the trial was described as double blind, but the method of blinding was not described.
Not performed, if the trial was not double blind.
Follow‐up
Adequate, if the numbers and reasons for dropouts and withdrawals in all intervention groups were described or if it was specified that there were no dropouts or withdrawals.
Unclear, if the report gave the impression that there had been no dropouts or withdrawals, but this was not specifically stated.
Inadequate, if the number or reasons for dropouts and withdrawals were not described.
If two of three components (generation of the allocation sequence, allocation concealment and blinding) were adequate, the trial was categorised as a high quality trial. If less than two components were adequate, the trial was categorised as a low quality trial.
Methods used to collect data from included trials One author (MTM) extracted data, which were validated by another author (KK). Data on the number of patients with each outcome event, by allocated treatment group, irrespective of compliance or follow‐up were sought to allow an intention‐to‐treat analysis. If the above data were not available in the publications, further information was sought by correspondence with the principal investigator of the trial.
Methods used to synthesise data All analyses were performed according to the intention‐to‐treat method. No randomised patient was excluded. For all outcome measures, irrespective of the cause, patients with incomplete or missing data were considered treatment failures. Meta‐analysis was performed using the Peto and the Der Simonian and Laird methods, depending on absence or presence of significant heterogeneity (P < 0.1).
Sensitivity analyses were performed according to: ‐ Pretreatment levels of ALT and/or AST. ‐ Ethnic origin. ‐ Age at onset of HBV infection. ‐ Trials employing the lower median dose of glucocorticosteroids and the group of trials employing the upper median dose of glucocorticosteroids. ‐ The individual types of IFN administered (human lymphoblastoid IFN and recombinant IFN).
As a further measure of the robustness of the observed treatment effect (if any), the following sensitivity analyses were added during the conduct of the review before any analyses were performed: ‐ Trials including children and trials including adults. ‐ Trials with short follow‐up (less than six months), intermediate follow‐up (six months), and trials with long follow‐up (more than six months). ‐ Trial employing a total IFN dose of less than 200 MU and trials employing more than 200 MU. ‐ The methodological quality of trials.
However, due to the paucity of trials in this field, non‐significant as well as significant differences were to be interpreted with caution.
Results
Description of studies
Initially 912 publications were identified by the electronic searches. Full text searching, reading of bibliographies, and additional search strategies identified no further publications. By reading titles and abstracts, 871 of the publications were excluded primarily because they were duplicates retrieved from different databases, non‐clinical studies, or had study objectives different from those specified in the protocol. This left us with 41 publications, which are described in this review (see 'Characteristics of included studies' and 'Characteristics of excluded studies'). For three studies we could not get sufficient information neither from the report of the studies nor from the authors, and now for this update we have moved them from 'Studies awaiting assessment' to 'Excluded studies' (Omata 1985; Fevery 1990; Guan 1995).
A total of 13 trials described in 19 publications were included in this review comprising a total of 790 patients. The average sample size was 61 patients ranging from 9 to 200 patients. Six trials (Giacchino 1995; Gregorio 1996; Lai 1991; Lopez 1996; Vajro 1996; Özen 1998) included only children (mean age eight years), whereas the rest included adults (mean age 37 years). Two trials (Lopez 1996; Perez 1993) did not report the male/female ratio and one study (Liaw 1994) included only males. Thus, out of 731 patients there were 78% males and 22% females.
All included patients were HBeAg positive and had active viral replication that was ascertained by a positive test for HBV DNA (12 trials) or DNA polymerase (Cianciara 1992). Histological entry criteria were reported in ten trials varying from inflammation on liver biopsy to chronic hepatitis or chronic active or persistent hepatitis and/or cirrhosis. Three trials (Krogsgaard 1996; Liaw 1994; Perez 1993) included altogether 38 patients with cirrhosis out of a total of 326 patients, whereas four trials including 180 patients (Giacchino 1995; Gregorio 1996; Reichen 1994; Cianciara 1992) stated that they excluded patients with cirrhosis. The remaining six trials including 284 patients (Lok 1992; Lopez 1996; Perrillo 1990; Vajro 1996; Lai 1991; Özen 1998) did not report on cirrhosis among included patients. Eight trials excluded patients with concomitant HIV and/or hepatitis D virus infection, ten trials excluded patients who had received immunosuppressive or antiviral treatment, and seven trials excluded patients with other severe medical illnesses. Biochemical disease activity was reported as means, medians, and multiples of the upper normal limit of ALT and/or AST levels. These differences made it impossible to calculate an average of the entry ALT/AST levels for all included trials. However, in seven trials (Cianciara 1992; Liaw 1994; Perez 1993; Perrillo 1990; Reichen 1994; Vajro 1996; Özen 1998) the mean ALT level for patients at inclusion ranged from 90 international units (IU)/L to 239 IU/L, the total mean ALT level being 186 IU/L.
The treatment regimens were almost similar in the majority of the trials. First, patients received glucocorticosteroids or placebo (nine trials) or no treatment (four trials) for four to six weeks followed by a two‐week drug‐free period and then they received IFN subcutaneously for 12 to 16 weeks.
In order to perform sensitivity analyses according to glucocorticosteroid dose, IFN dose, and entry ALT or AST activities some approximations were made. Thus, an adult person was considered to weigh 70 kg and to have a surface area of 1.75 square meters (sqm). Weight and surface area for the children was calculated from growth and weight charts using the median or mean age reported in the individual trials. The calculated median TOTAL glucocorticosteroid dose given during the pretreatment phase was 16.8 mg/kg (range: 10.5 to 50 mg/kg) and the calculated median TOTAL IFN dose administered was 222 MU/sqm (range: 45 to 1560 MU/sqm) (additional Table 10). In the analysis of the influence of entry ALT or AST activities on the therapeutic outcome, the trials were divided into those with ALT or AST activities either above or below a level of 90 IU/L.
1. Total doses of glucocorticosteroids and interferon administered.
| Trial | Gluco (mg/kg) | IFN (MU/sqm) |
| Cianciara 1992 | 13,3 | 217 |
| Giacchino 1995 | 14,7 | 325 |
| Gregorio 1996 | 28 | 190 |
| Krogsgaard 1996 | 13,3 | 217 |
| Lai 1991 | 16,8 | 80 |
| Liaw 1994 | 10,5 | 222 |
| Lok 1992 | 18 | 274 |
| Lopez 1996 | 12,25 | 144 |
| Perez 1993 | 24 | 274 |
| Perrillo 1990 | 24 | 320 |
| Reichen 1994 | 15 | 45 |
| Vajro 1996 | 28 | 1560 |
| Özen 1998 | 50 | 360 |
Two studies (Perez 1993; Lopez 1996) only reported data obtained at the end of IFN treatment. In the remaining 11 trials the maximal follow‐up after the end of IFN treatment was six or more months.
Risk of bias in included studies
Six trials (Cianciara 1992; Giacchino 1995; Lopez 1996; Perez 1993; Vajro 1996; Özen 1998) were considered to be of a low‐methodological quality and seven trials (Gregorio 1996; Krogsgaard 1996; Lai 1991; Liaw 1994; Lok 1992; Perrillo 1990; Reichen 1994) were considered to be of a high‐methodological quality.
A few trials distinguished themselves by a study design, which may have influenced the interpretation of data. Two trials (Lopez 1996; Perez 1993) reported different follow‐up time for the two intervention groups. In the Lopez 1996 trial some of the reported outcomes were measured even before the end of IFN treatment. In the Perez 1993 trial patients were allocated to a control group that received no treatment and to a group receiving sequential combination of glucocorticosteroid and IFN (gluco+IFN). These two groups were followed simultaneously. When the treatment of the gluco+IFN group ended, the patients from the untreated control group started treatment with IFN, thus serving as the control+IFN group. This review compares the gluco+IFN group with the control+IFN group, which in the Perez trial implies that the data in the two arms are obtained with a phase difference. One trial (Cianciara 1992) mentioned the randomisation of patients only in the title and reports nothing further on how the patients were allocated.
Our protocol stated that only trials employing a specified concealed randomisation were going to be included. However, as seven trials used inadequate (that is, did not report the method used) or unclear methods of allocation concealment, this exclusion criterion would have left us with very few trials for analyses. Before embarking on the statistical analyses we therefore decided to include also trials with inadequate and unclear methods of allocation concealment and to perform a sensitivity analysis with regard to the methodological quality of allocation concealment.
Effects of interventions
We used a fixed‐effect model (Peto) in all analyses as there was no significant heterogeneity (P > 0.1) between trials in the overall analyses as well as in most sensitivity analyses. Trials were significantly heterogeneous regarding the following outcomes: loss of HBV DNA in trials of low quality; loss of HBeAg and HBV DNA in low‐dose IFN trials; and loss of HBeAg and HBV DNA in trials reporting data at the end of IFN treatment. However, none of these subgroups showed any significant difference between gluco+IFN and control+IFN.
Overall results
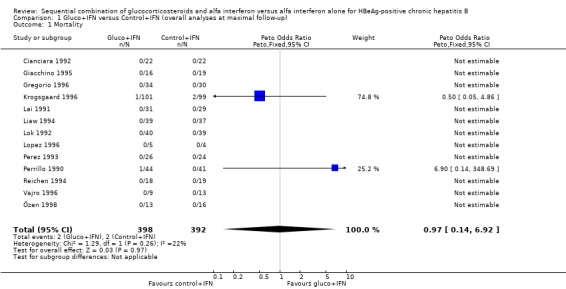
Mortality All 13 trials were included in the mortality analysis. Total number of reported deaths were four ‐ two in each intervention group ‐ corresponding to a mortality rate of 0.5%. There was no significant difference between the gluco+IFN and control+IFN treatment regimen.
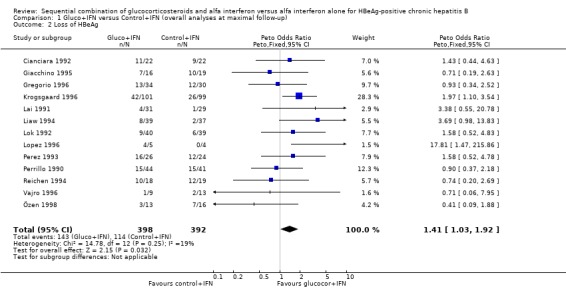
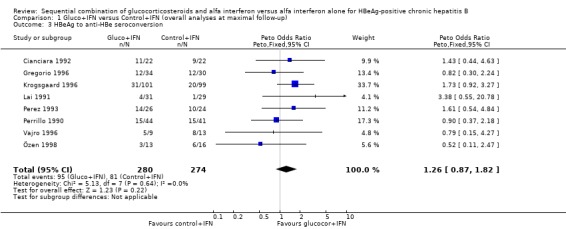
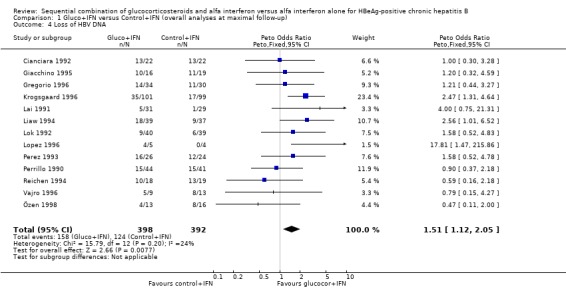
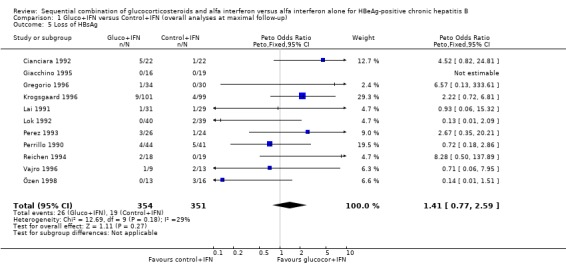
Virological response Loss of HBeAg was reported in all 13 trials, and changes in viral replication were in 12 trials reported as loss of HBV DNA and in one trial (Cianciara 1992) as loss of HBV DNA‐polymerase activity. In spite of the different measures of viral replication the Cianciara trial was nevertheless included in the loss of HBV DNA analysis. Seroconversion from HBeAg to anti‐HBe was reported in eight trials, and loss of HBsAg in 11 trials.
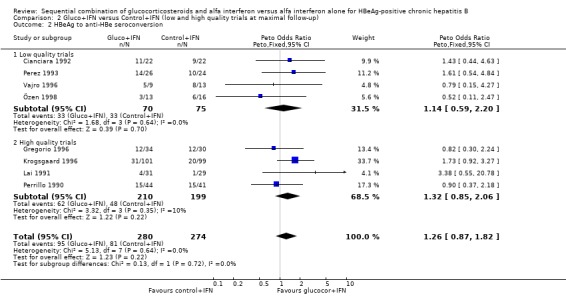
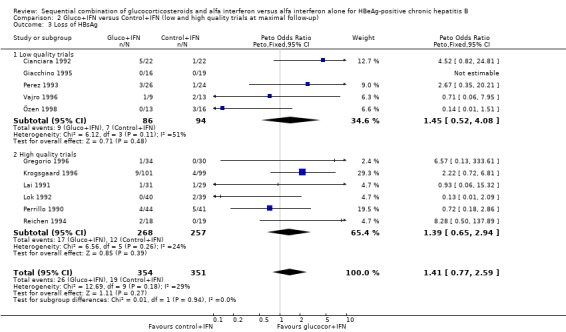
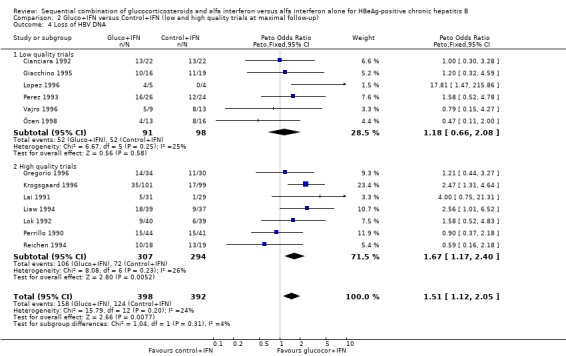
HBeAg (OR 1.41, 95% confidence interval (CI) 1.03 to 1.92, P = 0.03) and HBV DNA (OR = 1.51, 95% CI 1.12 to 2.05, P = 0.008) was cleared significantly more often in the gluco+IFN treated patients than in the control+IFN treated patients. There was no significant difference with regard to seroconversion from HBeAg to anti‐HBe (OR = 1.26, 95% CI 0.87 to 1.82, P = 0.2) and loss of HBsAg (OR = 1.41, 95% CI 0.77 to 2.59, P = 0.3) between the two intervention groups. Although there was no significant heterogeneity between the trials we also analysed the outcomes for HBeAg and HBV DNA loss using a random‐effects model. In the random‐effects analyses the differences between gluco+IFN and control+IFN were no longer statistically significant for loss of HBeAg and HBV DNA.
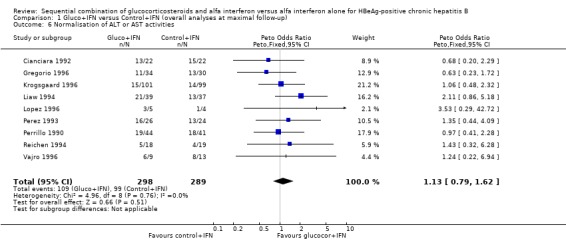
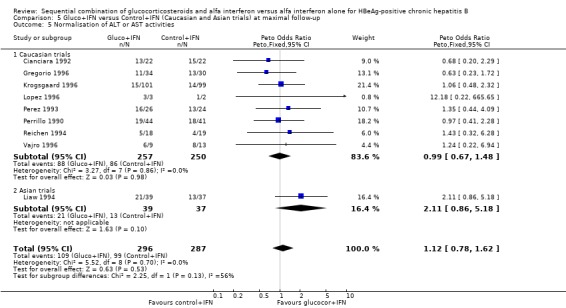
Biochemical response Eight trials reported normalisation of ALT levels, and one trial (Gregorio 1996) reported normalisation of AST levels. Two trials (Özen 1998; Giacchino 1995) reported biochemical response as continuous data (mean ± SD) only. As they had measured ALT and AST, respectively, these data were not compared. In one trial (Lopez 1996) some patients had normal baseline ALT levels, therefore analysis was performed using data only from patients with elevated ALT levels.
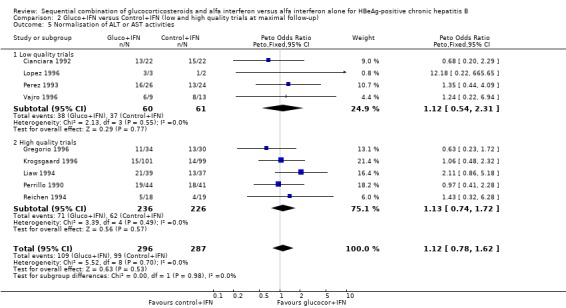
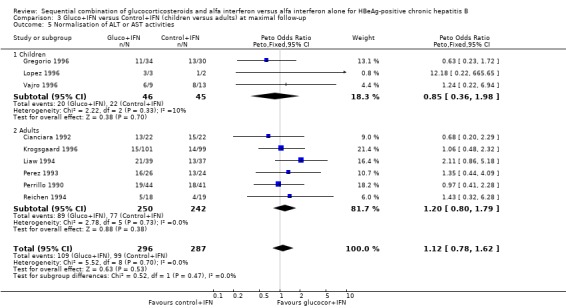
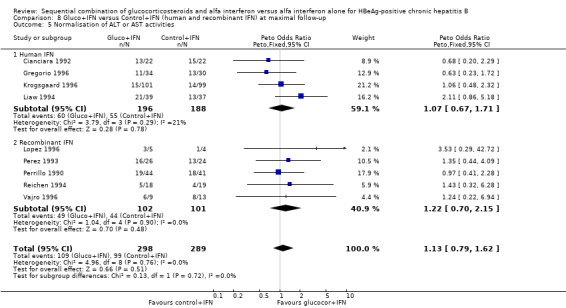
There was no significant difference between the gluco+IFN and control+IFN groups with regard to normalisation of ALT or AST activities (OR = 1.13, 95% CI 0.79 to 1.62, P = 0.5).
Liver histology Changes in liver histology between the intervention groups were reported in only three trials (Reichen 1994; Liaw 1994; Giacchino 1995). Only Liaw et al and Reichen et al used the Knodell histological activity index (HAI) and reported data as a mean score ± SD. However, because of different histological scores and subgrouping of patients in responders and non‐responders, it was not possible to make any summary analysis of these trials. Liaw et al and Reichen et al found a higher HAI score in non‐responders (both gluco+IFN and control+IFN) compared to responders. When non‐responders and responders were summarised and stratified according to intervention groups it appeared that the HAI score was slightly higher in the control+IFN group compared to gluco+IFN. The Giacchino trial used a different scoring system but reported similar findings. The reported data did not suffice for statistical analysis and the differences were small. The remaining ten trials did not report histological data according to the intervention groups, but only as changes in responders versus non‐responders. Correspondence with the authors led to no retrieval of further histological data.
Quality of life None of the 13 included trials reported any data on quality of life.
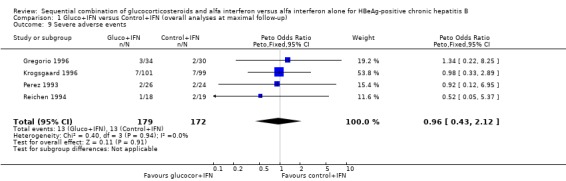
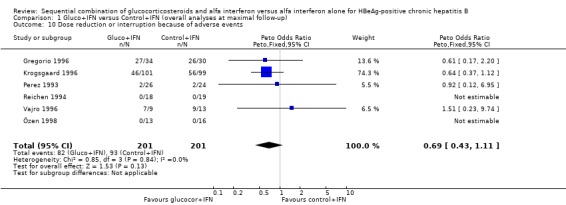
Adverse events Data on adverse events were very heterogeneously reported and difficult to quantify. Most trials reported only the types of adverse events, not mentioning the number of patients in each intervention group who experienced these adverse events. In our analyses we have therefore only been able to include six trials that report the number of patients who required dose reduction or interruption because of adverse events, and four trials that reported what they defined as severe adverse events. There was no significant difference between the two intervention groups regarding these two outcomes (P = 0.13 and P = 0.9, respectively), although slightly fewer patients needed dose modifications in the gluco+IFN group. This difference rested mainly on one trial (Krogsgaard 1996).
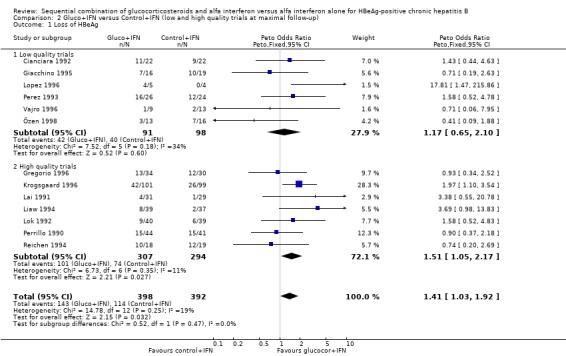
Sensitivity analyses Low‐ and high‐methodological quality The significant difference in loss of HBeAg and HBV DNA seen in the overall analysis was also significant in the trials that were of a high‐methodological quality with odds ratios of 1.51 (95% CI 1.03 to 1.92) and 1.67 (95% CI 1.17 to 2.40), respectively, in favour of gluco+IFN. No significant differences in outcomes were seen between the two interventions in the group of low quality trials.
Age at onset of HBV infection We were unable to extract data for this analysis.
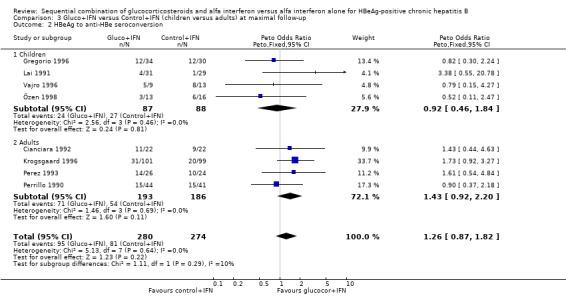
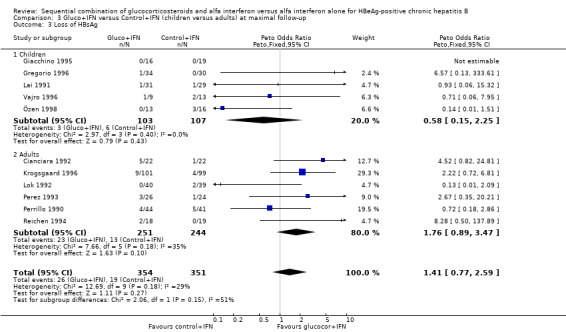
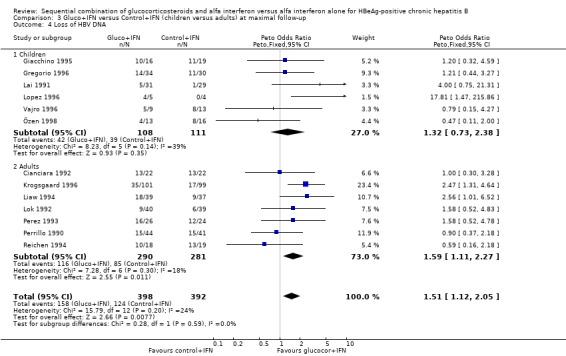
Children and adults In the trials including adults, gluco+IFN led to a significantly more frequent loss of HBeAg (OR = 1.56, 95% CI 1.09 to 2.23, P = 0.02) and HBV DNA (OR = 1.59, 95% CI 1.11 to 2.27, P = 0.01). In the trials including children, trends in favour of gluco+IFN were observed for loss of HBeAg and HBV DNA, but they did not reach statistically significance. In contrast there was among children a trend in favour of control+IFN with regard to seroconversion of HBeAg to anti‐HBe, loss of HBsAg, and normalisation of ALT or AST activities.
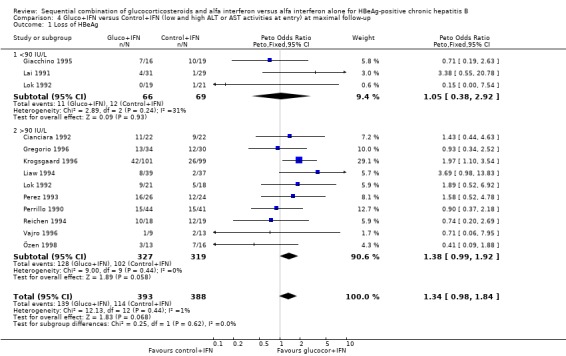
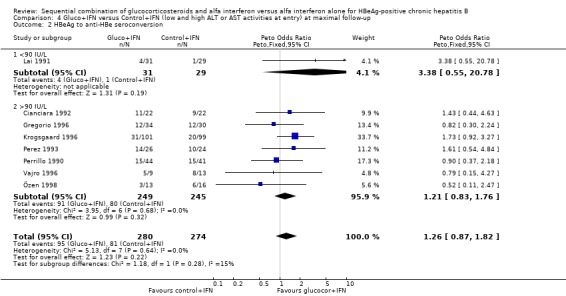
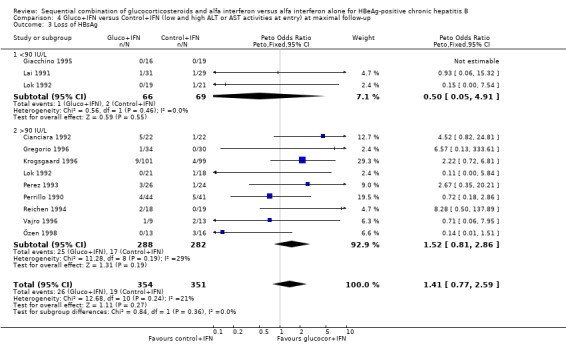
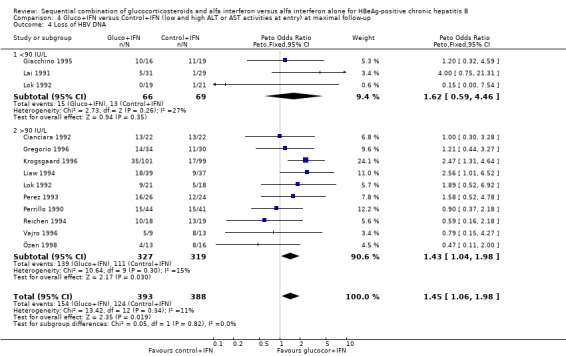
Low and high entry ALT or AST activities The Lopez trial (Lopez 1996) was excluded from this analysis because of insufficient reporting on entry ALT and AST levels. One trial (Lok 1992) stratified patients before randomisation according to their entry ALT levels. Data from this trial therefore appear both in the low ALT level and in the high ALT level group of trials. In three trials with low entry ALT or AST activities (including the Lok trial), the two interventions did not lead to significant differences in the outcomes. There was, however, a trend in favour of gluco+IFN with regard to loss of HBeAg, HBeAg to anti‐HBe seroconversion, and loss of HBV DNA. In ten trials with high entry ALT or AST activities (including the Lok trial), there was a trend towards gluco+IFN treatment being better on all outcomes, except normalisation of ALT and AST activities. This trend was statistically significant with regard to loss of HBV DNA (OR = 1.43, 95% CI 1.04 to 1.98, P = 0.03).
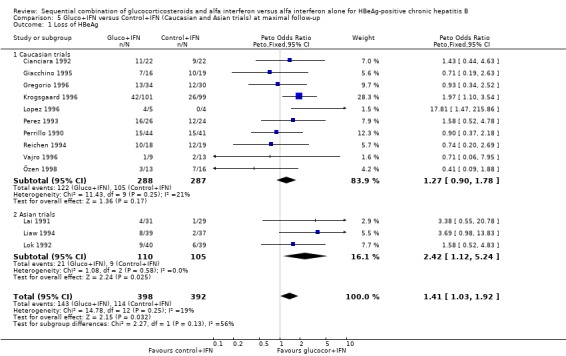
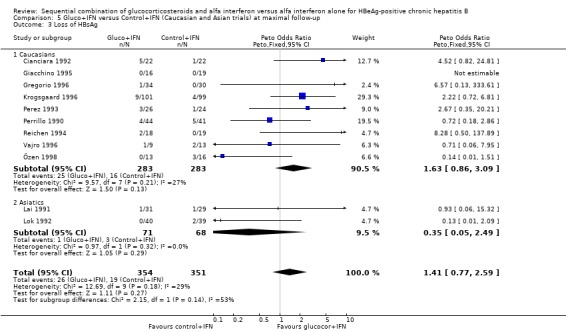
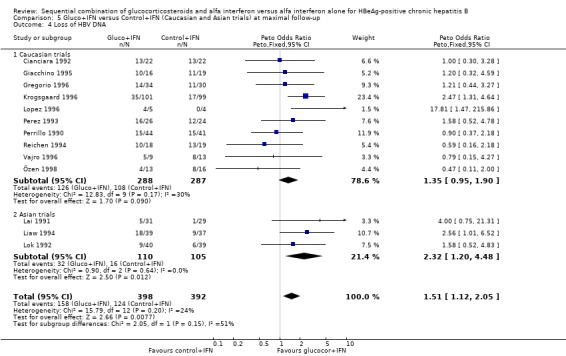
Asians and Caucasians Three trials comprising 215 patients included only Asians (Liaw 1994; Lok 1992; Lai 1991). The other trials included mainly Caucasians, but also a few Asians and Africans. Three trials reported to have included a total of 27 Asians and Africans (Giacchino 1995; Gregorio 1996; Krogsgaard 1996); two trials included only Caucasians (Perez 1993; Vajro 1996); and five trials comprising 204 patients did not report the ethnic origin of included patients, which were considered to be Caucasians (Cianciara 1992; Lopez 1996; Perrillo 1990; Reichen 1994; Özen 1998).
In the trials including only Asians, gluco+IFN led to a significantly higher loss of HBeAg (OR = 2.42, 95% CI 1.12 to 5.24, P = 0.02) and HBV DNA (OR = 2.32, 95% CI 1.20 to 4.48, P = 0.01) compared to control+IFN treated patients. In the trials including mainly Caucasians, the same trends were observed, but they did not reach statistical significance.
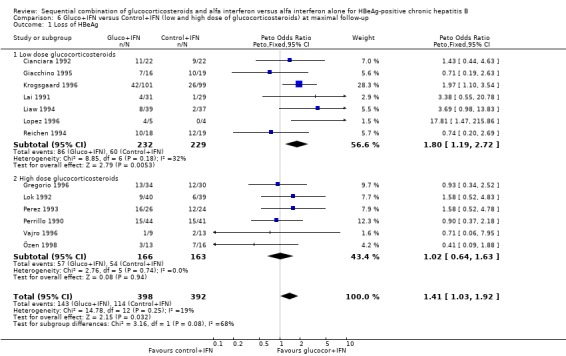
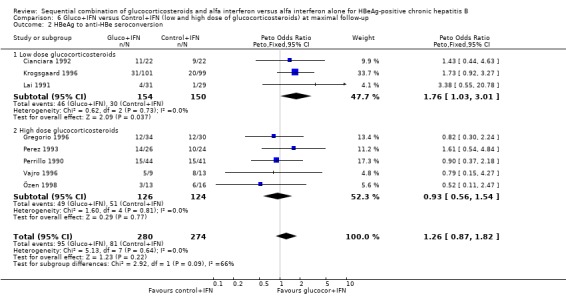
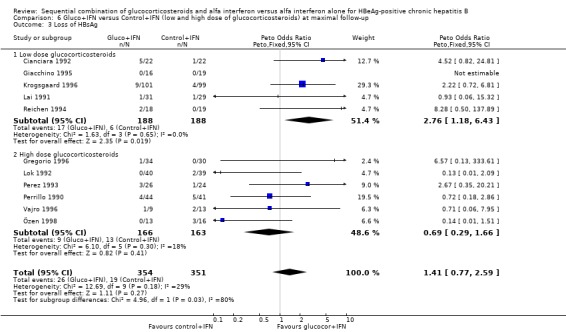
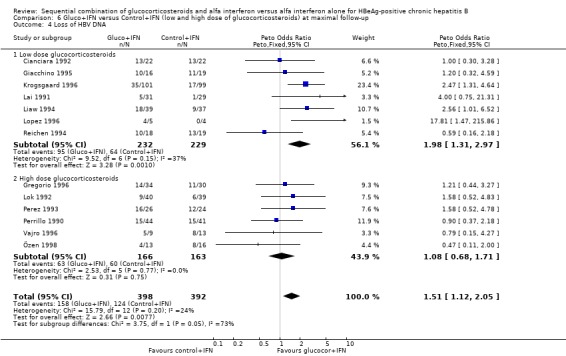
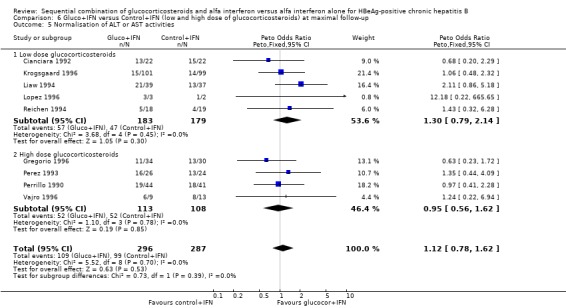
Low‐ and high‐glucocorticosteroid dose In the trials employing a low dose of glucocorticosteroids (range of total dose 10.5 to 16.8 mg/kg), gluco+IFN led to a significantly higher loss of HBeAg (OR = 1.80, 95% CI 1.19 to 2.72, P = 0.005), seroconversion from HBeAg to anti‐HBe (OR = 1.76, 95% CI 1.03 to 3.01, P = 0.04), loss of HBsAg (OR = 2.76, 95% CI 1.18 to 6.43, P = 0.02), and loss of HBV DNA (OR = 1.98, 95% CI 1.31 to 2.97, P = 0.001) compared to patients treated with control+IFN.
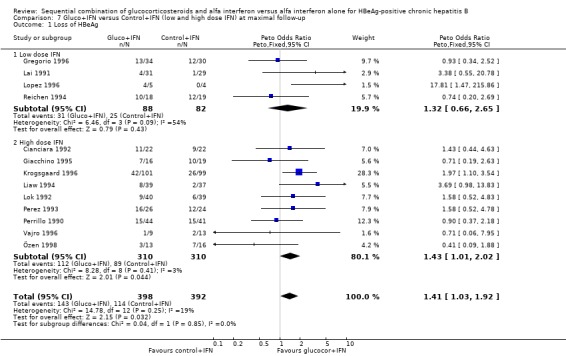
In the trials administrating a higher glucocorticosteroid dose (range of total dose 18 to 50 mg/kg), gluco+IFN did not result in significantly better results regarding any of the studied outcomes. Low‐ and high‐IFN dose In the trials employing high dose IFN (more than 200 MU/sqm), gluco+IFN led to a significantly higher loss of HBeAg (OR = 1.43, 95% CI 1.01 to 2.02, P = 0.04) and HBV DNA (OR = 1.52, 95% CI 1.08 to 2.14, P = 0.02) compared to control+IFN treated patients.
In the trials employing low‐dose IFN (equal to or less than 200 MU/sqm), the same trends were observed for all outcomes, except for normalisation of ALT and AST activities, but they did not reach statistical significance.
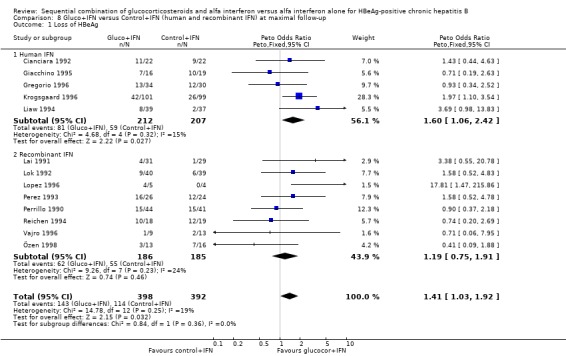
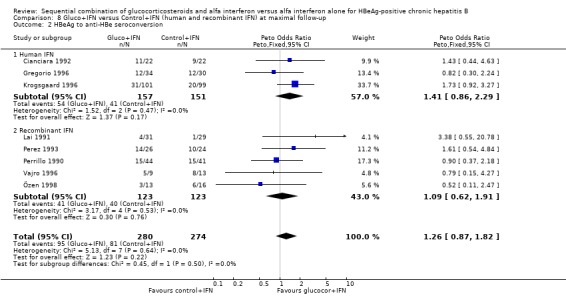
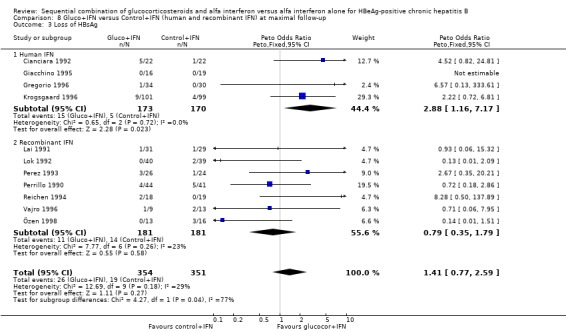
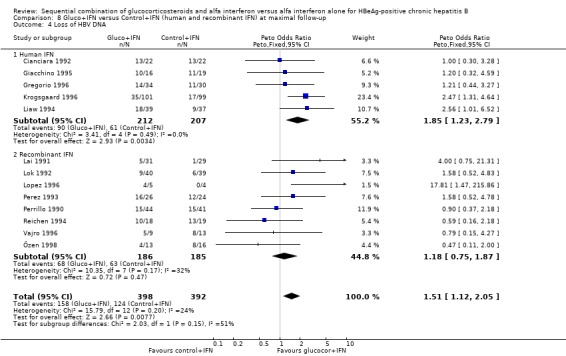
Recombinant and human IFN In the trials employing human lymphoblastoid IFN, gluco+IFN led to a significantly higher loss of HBeAg (OR = 1.60, 95% CI 1.06 to 2.42, P = 0.03), HBsAg (OR = 2.88, 95% CI 1.16 to 7.17, P = 0.02), and HBV DNA (OR = 1.85, 95% CI 1.23 to 2.79, P = 0.003) compared to control+IFN treated patients. In the trials employing recombinant IFN, the same trends were observed for all outcomes, except for loss of HBsAg, but the results did not reach statistical significance.
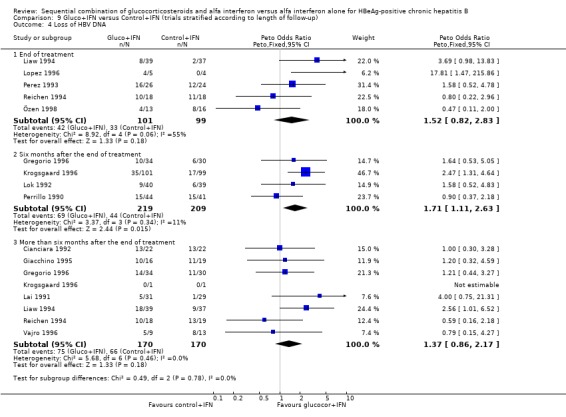
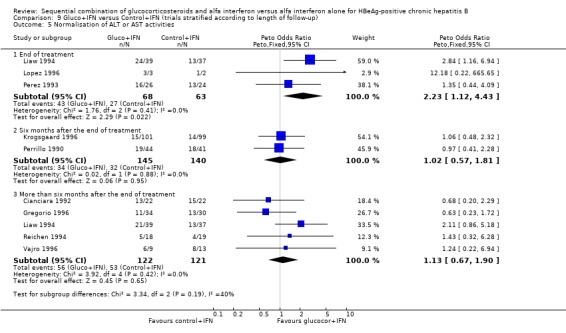
Duration of follow‐up Sensitivity analyses were performed with stratification of trials into three groups according to the time the outcomes were measured: at the end of IFN treatment (end of treatment response), six months after the end of IFN treatment, and more than six months after the end of IFN treatment (sustained response).
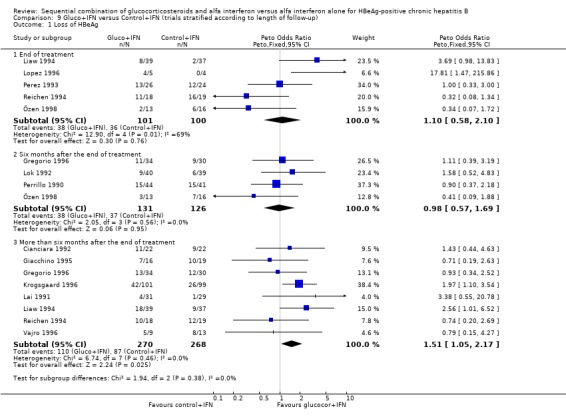
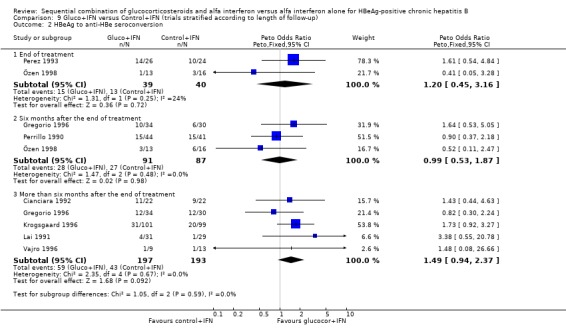
At the end of treatment, gluco+IFN did not significantly affect the loss of HBeAg, seroconversion from HBeAg to anti‐HBe, loss of HBsAg, or loss of HBV DNA. However, gluco+IFN led to significantly higher normalisation of ALT or AST activities compared to patients receiving control+IFN (OR 2.23, 95% CI 1.12 to 4.43, P = 0.02).
Six months after the end of treatment, gluco+IFN did not significantly affect the loss of HBeAg, seroconversion from HBeAg to anti‐HBe, loss of HBsAg, or normalisation of ALT/AST levels. However, gluco+IFN led to significantly higher loss of HBV DNA compared to patients receiving control+IFN (OR 1.71, 95% CI 1.11 to 2.63, P = 0.01).
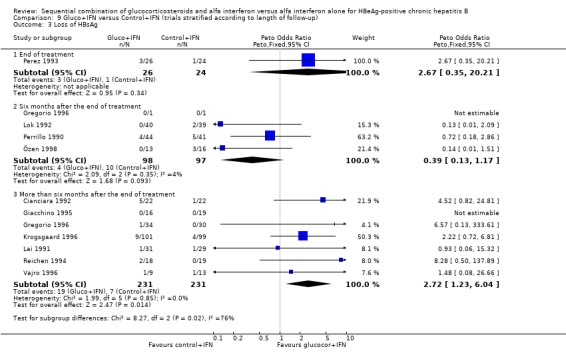
In the trials with more than six months follow‐up both HBeAg (OR 1.51, 95% CI 1.05 to 2.17, P = 0.02) and HBsAg (OR 2.72, 95% CI 1.23 to 6.04, P = 0.01) were lost significantly more frequent among patients receiving gluco+IFN than among control+IFN treated patients. However, in these trials no significant differences were found regarding HBeAg to anti‐HBe seroconversion, loss of HBV DNA, or ALT/AST normalisation.
Discussion
This review indicates that HBeAg positive patients with chronic hepatitis B respond better to the gluco+IFN regimen than to the control+IFN regimen with regard to loss of HBeAg and HBV DNA. This result appeared in analyses using the fixed‐effect model as no statistical heterogeneity was observed. However, visual inspection of the trial results indicated heterogeneity. When we analysed the data with a random effect model the significant effects of gluco+IFN disappeared, but showed a trend towards a beneficial effect. We were unable to detect any significant effect of gluco+IFN versus IFN on liver biochemistry, liver histology, quality of life, and mortality.
The result from the overall analysis may be influenced by many different trial characteristics other than the different treatment regimens. Thus, the overall results analyse trials including children and trials including adults and outcomes reported at the end of treatment together with outcomes obtained after a long period of follow‐up. We therefore performed a series of sensitivity analyses in order to examine how robust the overall results were and they are discussed below.
All the patients included in the present review were HBeAg positive. Accordingly, we do not know how glucocorticosteroid pretreatment affects HBsAg positive patients who are HBeAg negative, that is, patients in which the precore mutant virus predominates. Such patients are especially prevalent in the Mediterranean countries and Asia (Lok 2001).
Methodological quality The significant higher loss of HBeAg and HBV DNA seen in the overall analyses reappears in the sensitivity analysis of trials of high‐methodological quality. This is an interesting observation as trials of low‐methodological quality usually overestimate the intervention effect significantly (Schulz 1994; Moher 1998; Kjaergard 2001). It is therefore likely that the observed differences between the gluco+IFN group and control+IFN group are real and not overestimated.
Children and adults The effect of gluco+IFN is apparent in the trials including adults with a significant beneficial effect on loss of HBeAg and HBV DNA, and a positive trend in favour for gluco+IFN on all other outcomes. This was in contrast to the trials including children, where no significant results were obtained and no consistent trend was observed. The results of the trials including adults confirm the findings of the overall analysis regarding loss of HBeAg and HBV DNA. The inconclusive findings of the trials including children are consistent with other reviews stating that data on treatment in children are too limited to reach firm conclusions about the best management of chronic hepatitis B in children (Merican 2000). A possible explanation for a different response to glucocorticosteroid pretreatment in children compared to adults could be that children have a different immune response to the infection and thereby different activity of the disease (Merican 2000; Lok 2000). However, there was no apparent difference between children and adults with respect to biochemical disease activity at entry (additional Table 11). Another explanation for a different response to treatment could be that too few children have been entered into trials studying this topic.
2. Entry ALT or AST activities in the included trials.
| Trial | Gluco+IFN | Control+IFN | All patients |
| Cianciara 1992 | Mean ALT 91,2 IU/L | Mean ALT 88,6 IU/L | Mean ALT 91 IU/L |
| Giacchino 1995 | Median AST: 60 IU/L | Median AST: 53 IU/L | Median ALT: 85 |
| Gregorio 1996 | Median ALT: 85 IU/L | Median ALT: 120 IU/L | |
| Krogsgaard 1996 | 2.60 x upper normal limit | 2.64 x upper normal limit | |
| Lai 1991 | Median ALT: 14 IU/L | Median ALT: 12 IU/L | |
| Liaw 1994 | Mean ALT: 231 IU/L | Mean ALT 260 IU/L | Mean ALT 246 IU/L |
| Lok 1992 | Patients stratified before randomisation in high ALT median 141 IU/L (range: 62‐530) and low ALT median 21 IU/L (range: 7‐55) | Patients stratified before randomisation in high ALT median 141 IU/L (range: 52‐530) and low ALT median 20 IU/L (range: 10‐55) | |
| Lopez 1996 | 3/5 had high ALT levels | 2/4 patients had high ALT levels | |
| Perez 1993 | 1.5 x upper normal limit (>100 IU/L) | 1.5 x upper normal limit (>100 IU/L) | |
| Perrillo 1990 | 152 IU/L | 183 IU/L | 167 IU/L |
| Reichen 1994 | 193 IU/L | 283 IU/L | 237 IU/L |
| Vajro 1996 | 238 IU/L | 119 IU/L | 181 IU/L |
| Özen 1998 | 178 IU/L | 175 IU/L | 177 IU/L |
Low and high ALT or AST activities This review does not find any differences in the response to treatment between patients with low and patients with high ALT or AST activities at entry. The predictive value of liver enzyme levels regarding the response to treatment has been much debated and it has been demonstrated that patients with high transaminase activities benefit more from treatment with IFN compared to patients with low transaminase activities (Cohard 1994; Krogsgaard 1994; Merican 2000). It has also been suggested that patients with low ALT activities may benefit more from a glucocorticosteroid pretreatment regimen (Cohard 1994; Merican 2000). However, the results of the present systematic review do not support these findings.
Asians and Caucasians Although a small proportion of the patients in the Caucasian trials was either Asians or Africans we grouped the included trials into Caucasian and Asian trials in order to examine if any differences in outcome responses occurred. It appears from this analysis that the significant outcomes regarding loss of HBeAg and HBV DNA rest mainly on the Asian trials. Among the Caucasian trials, however, there is also a trend in favour of gluco+IFN. Publication bias may be geographically influenced (Vickers 1998). We are not able to say whether the ethnic origin of the patients and/or the geographical origin of the trials are the explanations for the small differences in response to treatment. The differences may also be due to other characteristics of the trials.
Low‐ and high‐glucocorticosteroid dose It is worth noticing that there apparently are no therapeutic gains in increasing the glucocorticosteroid dose. We cannot exclude that this is a chance finding as we have no 'head‐to‐head' trials evaluating low‐dose glucocorticosteroid pretreatment versus high dose glucocorticosteroid pretreatment. On the other hand, we observed this trend in all four viral marker outcomes. An explanation could be that the low‐dose glucocorticosteroid pretreatment were able to give sufficient flare up in viral replication for the ensuing IFN to work, but without suppressing the immune system and thereby hampering the efficacy of IFN. Any recommendations of a glucocorticosteroid pretreatment regimen should thus imply the administration of low doses of glucocorticosteroid in total doses of 10 to 15 mg/kg for four to six weeks. A possible treatment regimen could be: 0.6 mg/kg/day for two weeks, 0.45 mg/kg/day for one week, and 0.25 mg/kg for one week. Low‐ and high‐IFN dose The increased loss of HBeAg and HBV DNA in the high dose IFN trials is consistent with the findings of another meta‐analysis investigating the efficacy of IFN treatment in chronic hepatitis B. This meta‐analysis found a higher disappearance rate of HBeAg in patients receiving a total IFN dose of more than 200 MU/sqm (Krogsgaard 1994).
Recombinant and human IFN Trials that used recombinant IFN and trials that used human lymphoblastoid IFN contributed equally much to the overall outcome. One outcome deserves mentioning: the loss of HBsAg. Loss of HBsAg is significantly more often observed in gluco+IFN group of patients treated with human lymphoblastoid IFN than in the group of trials that used recombinant IFN, where there was a trend in favour of treatment with IFN alone. A reason for this apparently better effect of human lymphoblastoid IFN compared to recombinant IFN may be that human lymphoblastoid IFN consists of up to 15 different subtypes of IFN, thus one or more of these subtypes may work better in the sequential combination glucocorticosteroid and IFN (Krogsgaard 1996).
Duration of follow‐up The significant differences between gluco+IFN and control+IFN regarding loss of HBeAg and HBV DNA that appears in the trials with long follow‐up reduce the risk that the observed benefit of the gluco+IFN treatment is ascribed to a temporary loss of viral markers followed by virological relapse. Normalisation of ALT or AST activities is normally observed after seroconversion from HBeAg to anti‐HBe. This review did not observe a significant difference in seroconversion rates between the two interventions, which together with a short total follow‐up may explain why the virological response in favour of gluco+IFN (loss of HBeAg and HBV DNA) is not accompanied by a normalisation of ALT or AST activities.
Liver histology and mortality This review could not demonstrate any significant effects of gluco+IFN on liver histology or mortality. There was a paucity of data on these outcomes. We are therefore not able to say if the demonstrated effects on viral hepatitis B markers can be turned into clinically meaningful outcomes for the patients.
Quality of life There were no reports on quality of life in any of the trials. A reason for this may be that patients with chronic hepatitis B often have few or no symptoms, and the purpose of treatment is in the long‐term to reduce the mortality from hepatocellular carcinoma and cirrhosis. However, these long‐term outcomes could not be assessed within the follow‐up of the included trials, which in no case was longer than 12 months. All the trials use surrogate outcomes in order to estimate the efficacy of the treatment, presuming that clearance of viral markers, normalisation of transaminase activities, and improvement in liver histology in the end will lead to a lower incidence of hepatocellular carcinoma and cirrhosis. However, these surrogate outcomes are in themselves of no immediate interest to the patient and do not report anything on his quality of life, but only on the probability for developing cirrhosis and hepatocellular carcinoma in the future. A reliable assessment of quality of life would require a much longer follow‐up time than in the trials included in this review.
Adverse events It appeared that there was no significant difference between the treatment regimens regarding the frequency of severe adverse events and dose reduction/interruption. Further, it seems that adverse events mostly were induced by IFN, although it could not be evaluated. In addition, the loss of both HBeAg and HBV DNA were more pronounced in the low‐dose glucocorticosteroid trials. Randomised clinical trials including few patients are insufficient in ruling out seldom adverse events. Glucocorticosteroids are connected with a number of adverse effects and could cause deleterious effects in patients with a poor functional reserve (Lok 2001).
The differences that appear in the sensitivity analyses are probably influenced by many other trial characteristics and the data should be interpreted with caution. However, the sensitivity analyses are useful in order to examine possible biases in the overall analyses. Thus, it is unlikely that the difference in loss of HBeAg and HBV DNA between the two interventions stems from trials of a low‐methodological quality or from trials with a short follow‐up that would include later relapsers as responders to treatment.
Authors' conclusions
Implications for practice.
Sequential treatment with glucocorticosteroids and IFN for HBeAg positive chronic hepatitis B may be more effective than IFN monotherapy on loss of hepatitis B 'e' antigen and hepatitis B virus DNA. However, there is no evidence that sequential treatment with glucocorticosteroids and IFN affects liver biochemistry, liver histology, quality of life, or mortality of chronic hepatitis B, and glucocorticosteroid pretreatment may be associated with seldom, severe adverse events. Therefore, sequential treatment with glucocorticosteroids and IFN for chronic hepatitis B should await evidence on positive effects on clinical outcome measures.
Implications for research.
This review calls for confirmatory trials in children as well as in adults with HBeAg positive as well as HBeAg negative chronic hepatitis B. The potentials of treatment strategies that work by modifying the immune system should be further explored on equal terms with antiviral drugs that target the virus itself. The trials ought to examine long‐term effects and include patient relevant outcome measures. Future randomised clinical trials ought to examine the effects of glucocorticosteroid pretreatment combined with IFN and/or a nucleoside analogue versus placebo glucocorticosteroid pretreatment combined with IFN and/or a nucleoside analogue, depending on which treatment (IFN, nucleoside analogue, or the combination of IFN and a nucleoside analogue) is demonstrated the most optimal. Trials investigating the effects of drugs like glucocorticosteroids and IFN should report more thoroughly and systematically on the frequency and severity of adverse events and should use more effective measures to conceal allocation as well as blinding during treatment. Investigators should adhere to the guidelines for the reporting of trials (www.consort‐statement.org).
What's new
| Date | Event | Description |
|---|---|---|
| 9 November 2008 | Amended | Converted to new review format. |
Notes
For the update of the review (April 2005), one randomised clinical trial (Tupasi 2002) was found but it did not fulfil the inclusion criteria. See 'Table of excluded studies'. Three studies were moved from 'Studies awaiting assessment' to 'Excluded studies' because it was uncertain whether they were randomised clinical trials, and it was not possible to establish contact with the authors.
The protocol for this systematic review was first published in The Cochrane Library, Issue 3, 1997. It was prepared by Krogsgaard K, Zarski JP, Mathurin P, and Poynard T.
Mellerup M and Gluud C revised the protocol in 2001 and published it in The Cochrane Library Issue 3, 2001 together with Krogsgaard K, Mathurin P, and Poynard T. The revision was due to the fact that the group of authors has been rearranged as well as the old version needed amendments regarding several points.
Acknowledgements
Jean Pierre Zarsky was involved in the revision of the initial protocol. Lech Hilgertner and Peter Smith helped in translating some of the included trials. Dimitrinka Nikolova and Sarah Frederiksen are thanked for help in identifying studies for this review. Rosanna Simonetti , the Contact Editor, is thanked for helpful comments.
Appendices
Appendix 1. Search strategies
| Database | Searched | Strategy |
| The Cochrane Hepato‐Biliary Group Controlled Trials Register | May 2005 | interferon AND (glucocorticosteroid* OR glucocorticoid* OR corticosteroid* OR corticoid* OR steroid* OR predniso*) AND 'chronic hepatitis B' |
| The Cochrane Central Register of Controlled Trials in The Cochrane Library | Issue 2, 2005 | #1 ALPHA‐INTERFERON explode all trees (MeSH)1441 #2 (interferon and (alpha or alfa))3505 #3 GLUCOCORTICOIDS explode all trees (MeSH)1755 #4 CORTICOSTEROIDS explode all trees (MeSH)5149 #5 STEROIDS explode all trees (MeSH)24818 #6 PREDNISOLONE explode all trees (MeSH)2450 #7 PREDNISONE explode all trees (MeSH)2114 #8 (glucocorticosteroid* or glucocorticoid* or corticosteroid* or corticoid* or steroid* or predniso*)21160 #9 CHRONIC HEPATITIS B explode all trees (MeSH)210 #10 (chronic next hepatitis next b)893 #11 (#1 or #2)3505 #12 (#3 or #4 or #5 or #6 or #7 or #8)37888 #13 (#9 or #10)930 #14 (#11 and #12 and #13)67 |
| MEDLINE | 1950 to May 2005 | #1 13851 explode "Interferon‐alpha"/ all subheadings #2 40276 interferon and al*a #3 40276 #1 or #2 #4 28215 explode "Glucocorticoids"/ all subheadings #5 133387 explode "Adrenal‐Cortex‐Hormones"/ all subheadings #6 489062 explode "Steroids"/ all subheadings #7 24716 explode "Prednisone"/ all subheadings #8 30539 explode "Prednisolone"/ all subheadings #9 300327 glucocorticosteroid* or glucocorticoid* or corticosteroid* or corticoid* or steroid* or predniso* #10 656202 #4 or #5 or #6 or #7 or #8 or #9 #11 2885 explode "Hepatitis‐B‐Chronic"/ all subheadings #12 6243 chronic hepatitis b #13 6243 #11 or #12 #14 109 #3 and #10 and #13 #15 500798 random* or placebo* or blind* or meta‐analysis #16 33 #14 and #15 |
| EMBASE | 1980 to May 2005 | #1 22399 explode "alpha‐interferon"/ all subheadings #2 52056 interferon and al*a #3 52056 #1 or #2 #4 226381 explode "glucocorticoid"/ all subheadings #5 289904 explode "corticosteroid"/ all subheadings #6 307575 explode "steroid"/ all subheadings #7 58687 explode "prednisone"/ all subheadings #8 39710 explode "prednisolone"/ all subheadings #9 301271 glucocorticosteroid* or glucocorticoid* or corticosteroid* or corticoid* or steroid* or predniso* #10 480065 #4 or #5 or #6 or #7 or #8 or #9 #11 20197 explode "hepatitis‐B"/ all subheadings #12 4371 chronic hepatitis b #13 21160 #11 or #12 #14 433 #3 and #10 and #13 #15 427249 random* or placebo* or blind* or meta‐analysis #16 94 #14 and #15 |
| BIOSIS | 1969 to May 2005 | #1 46566 interferon and al*a #2 4367 explode "Glucocorticoid‐drug" #3 669994 glucocorticosteroid* or glucocorticoid* or corticosteroid* or corticoid* or steroid* or predniso* #4 669994 #2 or #3 #5 6240 chronic hepatitis b #6 95 #1 and #4 and #5 #7 361800 random* or placebo* or blind* or meta‐analysis #8 34 #6 and #7 |
Data and analyses
Comparison 1. Gluco+IFN versus Control+IFN (overall analyses at maximal follow‐up).
| Outcome or subgroup title | No. of studies | No. of participants | Statistical method | Effect size |
|---|---|---|---|---|
| 1 Mortality | 13 | 790 | Peto Odds Ratio (Peto, Fixed, 95% CI) | 0.97 [0.14, 6.92] |
| 2 Loss of HBeAg | 13 | 790 | Peto Odds Ratio (Peto, Fixed, 95% CI) | 1.41 [1.03, 1.92] |
| 3 HBeAg to anti‐HBe seroconversion | 8 | 554 | Peto Odds Ratio (Peto, Fixed, 95% CI) | 1.26 [0.87, 1.82] |
| 4 Loss of HBV DNA | 13 | 790 | Peto Odds Ratio (Peto, Fixed, 95% CI) | 1.51 [1.12, 2.05] |
| 5 Loss of HBsAg | 11 | 705 | Peto Odds Ratio (Peto, Fixed, 95% CI) | 1.41 [0.77, 2.59] |
| 6 Normalisation of ALT or AST activities | 9 | 587 | Peto Odds Ratio (Peto, Fixed, 95% CI) | 1.13 [0.79, 1.62] |
| 7 Liver histology | 0 | 0 | Peto Odds Ratio (Peto, Fixed, 95% CI) | 0.0 [0.0, 0.0] |
| 8 Quality of life | 0 | 0 | Peto Odds Ratio (Peto, Fixed, 95% CI) | 0.0 [0.0, 0.0] |
| 9 Severe adverse events | 4 | 351 | Peto Odds Ratio (Peto, Fixed, 95% CI) | 0.96 [0.43, 2.12] |
| 10 Dose reduction or interruption because of adverse events | 6 | 402 | Peto Odds Ratio (Peto, Fixed, 95% CI) | 0.69 [0.43, 1.11] |
1.1. Analysis.
Comparison 1 Gluco+IFN versus Control+IFN (overall analyses at maximal follow‐up), Outcome 1 Mortality.
1.2. Analysis.
Comparison 1 Gluco+IFN versus Control+IFN (overall analyses at maximal follow‐up), Outcome 2 Loss of HBeAg.
1.3. Analysis.
Comparison 1 Gluco+IFN versus Control+IFN (overall analyses at maximal follow‐up), Outcome 3 HBeAg to anti‐HBe seroconversion.
1.4. Analysis.
Comparison 1 Gluco+IFN versus Control+IFN (overall analyses at maximal follow‐up), Outcome 4 Loss of HBV DNA.
1.5. Analysis.
Comparison 1 Gluco+IFN versus Control+IFN (overall analyses at maximal follow‐up), Outcome 5 Loss of HBsAg.
1.6. Analysis.
Comparison 1 Gluco+IFN versus Control+IFN (overall analyses at maximal follow‐up), Outcome 6 Normalisation of ALT or AST activities.
1.9. Analysis.
Comparison 1 Gluco+IFN versus Control+IFN (overall analyses at maximal follow‐up), Outcome 9 Severe adverse events.
1.10. Analysis.
Comparison 1 Gluco+IFN versus Control+IFN (overall analyses at maximal follow‐up), Outcome 10 Dose reduction or interruption because of adverse events.
Comparison 2. Gluco+IFN versus Control+IFN (low and high quality trials at maximal follow‐up).
| Outcome or subgroup title | No. of studies | No. of participants | Statistical method | Effect size |
|---|---|---|---|---|
| 1 Loss of HBeAg | 13 | 790 | Peto Odds Ratio (Peto, Fixed, 95% CI) | 1.41 [1.03, 1.92] |
| 1.1 Low quality trials | 6 | 189 | Peto Odds Ratio (Peto, Fixed, 95% CI) | 1.17 [0.65, 2.10] |
| 1.2 High quality trials | 7 | 601 | Peto Odds Ratio (Peto, Fixed, 95% CI) | 1.51 [1.05, 2.17] |
| 2 HBeAg to anti‐HBe seroconversion | 8 | 554 | Peto Odds Ratio (Peto, Fixed, 95% CI) | 1.26 [0.87, 1.82] |
| 2.1 Low quality trials | 4 | 145 | Peto Odds Ratio (Peto, Fixed, 95% CI) | 1.14 [0.59, 2.20] |
| 2.2 High quality trials | 4 | 409 | Peto Odds Ratio (Peto, Fixed, 95% CI) | 1.32 [0.85, 2.06] |
| 3 Loss of HBsAg | 11 | 705 | Peto Odds Ratio (Peto, Fixed, 95% CI) | 1.41 [0.77, 2.59] |
| 3.1 Low quality trials | 5 | 180 | Peto Odds Ratio (Peto, Fixed, 95% CI) | 1.45 [0.52, 4.08] |
| 3.2 High quality trials | 6 | 525 | Peto Odds Ratio (Peto, Fixed, 95% CI) | 1.39 [0.65, 2.94] |
| 4 Loss of HBV DNA | 13 | 790 | Peto Odds Ratio (Peto, Fixed, 95% CI) | 1.51 [1.12, 2.05] |
| 4.1 Low quality trials | 6 | 189 | Peto Odds Ratio (Peto, Fixed, 95% CI) | 1.18 [0.66, 2.08] |
| 4.2 High quality trials | 7 | 601 | Peto Odds Ratio (Peto, Fixed, 95% CI) | 1.67 [1.17, 2.40] |
| 5 Normalisation of ALT or AST activities | 9 | 583 | Peto Odds Ratio (Peto, Fixed, 95% CI) | 1.12 [0.78, 1.62] |
| 5.1 Low quality trials | 4 | 121 | Peto Odds Ratio (Peto, Fixed, 95% CI) | 1.12 [0.54, 2.31] |
| 5.2 High quality trials | 5 | 462 | Peto Odds Ratio (Peto, Fixed, 95% CI) | 1.13 [0.74, 1.72] |
2.1. Analysis.
Comparison 2 Gluco+IFN versus Control+IFN (low and high quality trials at maximal follow‐up), Outcome 1 Loss of HBeAg.
2.2. Analysis.
Comparison 2 Gluco+IFN versus Control+IFN (low and high quality trials at maximal follow‐up), Outcome 2 HBeAg to anti‐HBe seroconversion.
2.3. Analysis.
Comparison 2 Gluco+IFN versus Control+IFN (low and high quality trials at maximal follow‐up), Outcome 3 Loss of HBsAg.
2.4. Analysis.
Comparison 2 Gluco+IFN versus Control+IFN (low and high quality trials at maximal follow‐up), Outcome 4 Loss of HBV DNA.
2.5. Analysis.
Comparison 2 Gluco+IFN versus Control+IFN (low and high quality trials at maximal follow‐up), Outcome 5 Normalisation of ALT or AST activities.
Comparison 3. Gluco+IFN versus Control+IFN (children versus adults) at maximal follow‐up.
| Outcome or subgroup title | No. of studies | No. of participants | Statistical method | Effect size |
|---|---|---|---|---|
| 1 Loss of HBeAg | 13 | 790 | Peto Odds Ratio (Peto, Fixed, 95% CI) | 1.41 [1.03, 1.92] |
| 1.1 Children | 6 | 219 | Peto Odds Ratio (Peto, Fixed, 95% CI) | 1.04 [0.56, 1.93] |
| 1.2 Adults | 7 | 571 | Peto Odds Ratio (Peto, Fixed, 95% CI) | 1.56 [1.09, 2.23] |
| 2 HBeAg to anti‐HBe seroconversion | 8 | 554 | Peto Odds Ratio (Peto, Fixed, 95% CI) | 1.26 [0.87, 1.82] |
| 2.1 Children | 4 | 175 | Peto Odds Ratio (Peto, Fixed, 95% CI) | 0.92 [0.46, 1.84] |
| 2.2 Adults | 4 | 379 | Peto Odds Ratio (Peto, Fixed, 95% CI) | 1.43 [0.92, 2.20] |
| 3 Loss of HBsAg | 11 | 705 | Peto Odds Ratio (Peto, Fixed, 95% CI) | 1.41 [0.77, 2.59] |
| 3.1 Children | 5 | 210 | Peto Odds Ratio (Peto, Fixed, 95% CI) | 0.58 [0.15, 2.25] |
| 3.2 Adults | 6 | 495 | Peto Odds Ratio (Peto, Fixed, 95% CI) | 1.76 [0.89, 3.47] |
| 4 Loss of HBV DNA | 13 | 790 | Peto Odds Ratio (Peto, Fixed, 95% CI) | 1.51 [1.12, 2.05] |
| 4.1 Children | 6 | 219 | Peto Odds Ratio (Peto, Fixed, 95% CI) | 1.32 [0.73, 2.38] |
| 4.2 Adults | 7 | 571 | Peto Odds Ratio (Peto, Fixed, 95% CI) | 1.59 [1.11, 2.27] |
| 5 Normalisation of ALT or AST activities | 9 | 583 | Peto Odds Ratio (Peto, Fixed, 95% CI) | 1.12 [0.78, 1.62] |
| 5.1 Children | 3 | 91 | Peto Odds Ratio (Peto, Fixed, 95% CI) | 0.85 [0.36, 1.98] |
| 5.2 Adults | 6 | 492 | Peto Odds Ratio (Peto, Fixed, 95% CI) | 1.20 [0.80, 1.79] |
3.1. Analysis.

Comparison 3 Gluco+IFN versus Control+IFN (children versus adults) at maximal follow‐up, Outcome 1 Loss of HBeAg.
3.2. Analysis.
Comparison 3 Gluco+IFN versus Control+IFN (children versus adults) at maximal follow‐up, Outcome 2 HBeAg to anti‐HBe seroconversion.
3.3. Analysis.
Comparison 3 Gluco+IFN versus Control+IFN (children versus adults) at maximal follow‐up, Outcome 3 Loss of HBsAg.
3.4. Analysis.
Comparison 3 Gluco+IFN versus Control+IFN (children versus adults) at maximal follow‐up, Outcome 4 Loss of HBV DNA.
3.5. Analysis.
Comparison 3 Gluco+IFN versus Control+IFN (children versus adults) at maximal follow‐up, Outcome 5 Normalisation of ALT or AST activities.
Comparison 4. Gluco+IFN versus Control+IFN (low and high ALT or AST activities at entry) at maximal follow‐up.
| Outcome or subgroup title | No. of studies | No. of participants | Statistical method | Effect size |
|---|---|---|---|---|
| 1 Loss of HBeAg | 12 | 781 | Peto Odds Ratio (Peto, Fixed, 95% CI) | 1.34 [0.98, 1.84] |
| 1.1 <90 IU/L | 3 | 135 | Peto Odds Ratio (Peto, Fixed, 95% CI) | 1.05 [0.38, 2.92] |
| 1.2 >90 IU/L | 10 | 646 | Peto Odds Ratio (Peto, Fixed, 95% CI) | 1.38 [0.99, 1.92] |
| 2 HBeAg to anti‐HBe seroconversion | 8 | 554 | Peto Odds Ratio (Peto, Fixed, 95% CI) | 1.26 [0.87, 1.82] |
| 2.1 <90 IU/L | 1 | 60 | Peto Odds Ratio (Peto, Fixed, 95% CI) | 3.38 [0.55, 20.78] |
| 2.2 >90 IU/L | 7 | 494 | Peto Odds Ratio (Peto, Fixed, 95% CI) | 1.21 [0.83, 1.76] |
| 3 Loss of HBsAg | 11 | 705 | Peto Odds Ratio (Peto, Fixed, 95% CI) | 1.41 [0.77, 2.59] |
| 3.1 <90 IU/L | 3 | 135 | Peto Odds Ratio (Peto, Fixed, 95% CI) | 0.50 [0.05, 4.91] |
| 3.2 >90 IU/L | 9 | 570 | Peto Odds Ratio (Peto, Fixed, 95% CI) | 1.52 [0.81, 2.86] |
| 4 Loss of HBV DNA | 12 | 781 | Peto Odds Ratio (Peto, Fixed, 95% CI) | 1.45 [1.06, 1.98] |
| 4.1 <90 IU/L | 3 | 135 | Peto Odds Ratio (Peto, Fixed, 95% CI) | 1.62 [0.59, 4.46] |
| 4.2 >90 IU/L | 10 | 646 | Peto Odds Ratio (Peto, Fixed, 95% CI) | 1.43 [1.04, 1.98] |
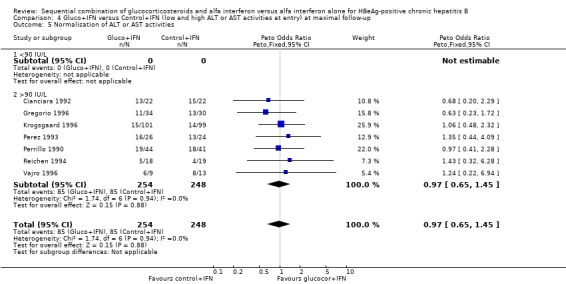
| 5 Normalisation of ALT or AST activities | 7 | 502 | Peto Odds Ratio (Peto, Fixed, 95% CI) | 0.97 [0.65, 1.45] |
| 5.1 <90 IU/L | 0 | 0 | Peto Odds Ratio (Peto, Fixed, 95% CI) | 0.0 [0.0, 0.0] |
| 5.2 >90 IU/L | 7 | 502 | Peto Odds Ratio (Peto, Fixed, 95% CI) | 0.97 [0.65, 1.45] |
4.1. Analysis.
Comparison 4 Gluco+IFN versus Control+IFN (low and high ALT or AST activities at entry) at maximal follow‐up, Outcome 1 Loss of HBeAg.
4.2. Analysis.
Comparison 4 Gluco+IFN versus Control+IFN (low and high ALT or AST activities at entry) at maximal follow‐up, Outcome 2 HBeAg to anti‐HBe seroconversion.
4.3. Analysis.
Comparison 4 Gluco+IFN versus Control+IFN (low and high ALT or AST activities at entry) at maximal follow‐up, Outcome 3 Loss of HBsAg.
4.4. Analysis.
Comparison 4 Gluco+IFN versus Control+IFN (low and high ALT or AST activities at entry) at maximal follow‐up, Outcome 4 Loss of HBV DNA.
4.5. Analysis.
Comparison 4 Gluco+IFN versus Control+IFN (low and high ALT or AST activities at entry) at maximal follow‐up, Outcome 5 Normalisation of ALT or AST activities.
Comparison 5. Gluco+IFN versus Control+IFN (Caucasian and Asian trials) at maximal follow‐up.
| Outcome or subgroup title | No. of studies | No. of participants | Statistical method | Effect size |
|---|---|---|---|---|
| 1 Loss of HBeAg | 13 | 790 | Peto Odds Ratio (Peto, Fixed, 95% CI) | 1.41 [1.03, 1.92] |
| 1.1 Caucasian trials | 10 | 575 | Peto Odds Ratio (Peto, Fixed, 95% CI) | 1.27 [0.90, 1.78] |
| 1.2 Asian trials | 3 | 215 | Peto Odds Ratio (Peto, Fixed, 95% CI) | 2.42 [1.12, 5.24] |
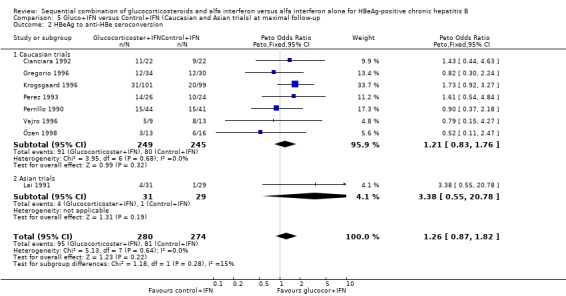
| 2 HBeAg to anti‐HBe seroconversion | 8 | 554 | Peto Odds Ratio (Peto, Fixed, 95% CI) | 1.26 [0.87, 1.82] |
| 2.1 Caucasian trials | 7 | 494 | Peto Odds Ratio (Peto, Fixed, 95% CI) | 1.21 [0.83, 1.76] |
| 2.2 Asian trials | 1 | 60 | Peto Odds Ratio (Peto, Fixed, 95% CI) | 3.38 [0.55, 20.78] |
| 3 Loss of HBsAg | 11 | 705 | Peto Odds Ratio (Peto, Fixed, 95% CI) | 1.41 [0.77, 2.59] |
| 3.1 Caucasians | 9 | 566 | Peto Odds Ratio (Peto, Fixed, 95% CI) | 1.63 [0.86, 3.09] |
| 3.2 Asiatics | 2 | 139 | Peto Odds Ratio (Peto, Fixed, 95% CI) | 0.35 [0.05, 2.49] |
| 4 Loss of HBV DNA | 13 | 790 | Peto Odds Ratio (Peto, Fixed, 95% CI) | 1.51 [1.12, 2.05] |
| 4.1 Caucasian trials | 10 | 575 | Peto Odds Ratio (Peto, Fixed, 95% CI) | 1.35 [0.95, 1.90] |
| 4.2 Asian trials | 3 | 215 | Peto Odds Ratio (Peto, Fixed, 95% CI) | 2.32 [1.20, 4.48] |
| 5 Normalisation of ALT or AST activities | 9 | 583 | Peto Odds Ratio (Peto, Fixed, 95% CI) | 1.12 [0.78, 1.62] |
| 5.1 Caucasian trials | 8 | 507 | Peto Odds Ratio (Peto, Fixed, 95% CI) | 0.99 [0.67, 1.48] |
| 5.2 Asian trials | 1 | 76 | Peto Odds Ratio (Peto, Fixed, 95% CI) | 2.11 [0.86, 5.18] |
5.1. Analysis.
Comparison 5 Gluco+IFN versus Control+IFN (Caucasian and Asian trials) at maximal follow‐up, Outcome 1 Loss of HBeAg.
5.2. Analysis.
Comparison 5 Gluco+IFN versus Control+IFN (Caucasian and Asian trials) at maximal follow‐up, Outcome 2 HBeAg to anti‐HBe seroconversion.
5.3. Analysis.
Comparison 5 Gluco+IFN versus Control+IFN (Caucasian and Asian trials) at maximal follow‐up, Outcome 3 Loss of HBsAg.
5.4. Analysis.
Comparison 5 Gluco+IFN versus Control+IFN (Caucasian and Asian trials) at maximal follow‐up, Outcome 4 Loss of HBV DNA.
5.5. Analysis.
Comparison 5 Gluco+IFN versus Control+IFN (Caucasian and Asian trials) at maximal follow‐up, Outcome 5 Normalisation of ALT or AST activities.
Comparison 6. Gluco+IFN versus Control+IFN (low and high dose of glucocorticosteroids) at maximal follow‐up.
| Outcome or subgroup title | No. of studies | No. of participants | Statistical method | Effect size |
|---|---|---|---|---|
| 1 Loss of HBeAg | 13 | 790 | Peto Odds Ratio (Peto, Fixed, 95% CI) | 1.41 [1.03, 1.92] |
| 1.1 Low dose glucocorticosteroids | 7 | 461 | Peto Odds Ratio (Peto, Fixed, 95% CI) | 1.80 [1.19, 2.72] |
| 1.2 High dose glucocorticosteroids | 6 | 329 | Peto Odds Ratio (Peto, Fixed, 95% CI) | 1.02 [0.64, 1.63] |
| 2 HBeAg to anti‐HBe seroconversion | 8 | 554 | Peto Odds Ratio (Peto, Fixed, 95% CI) | 1.26 [0.87, 1.82] |
| 2.1 Low dose glucocorticosteroids | 3 | 304 | Peto Odds Ratio (Peto, Fixed, 95% CI) | 1.76 [1.03, 3.01] |
| 2.2 High dose glucocorticosteroids | 5 | 250 | Peto Odds Ratio (Peto, Fixed, 95% CI) | 0.93 [0.56, 1.54] |
| 3 Loss of HBsAg | 11 | 705 | Peto Odds Ratio (Peto, Fixed, 95% CI) | 1.41 [0.77, 2.59] |
| 3.1 Low dose glucocorticosteroids | 5 | 376 | Peto Odds Ratio (Peto, Fixed, 95% CI) | 2.76 [1.18, 6.43] |
| 3.2 High dose glucocorticosteroids | 6 | 329 | Peto Odds Ratio (Peto, Fixed, 95% CI) | 0.69 [0.29, 1.66] |
| 4 Loss of HBV DNA | 13 | 790 | Peto Odds Ratio (Peto, Fixed, 95% CI) | 1.51 [1.12, 2.05] |
| 4.1 Low dose glucocorticosteroids | 7 | 461 | Peto Odds Ratio (Peto, Fixed, 95% CI) | 1.98 [1.31, 2.97] |
| 4.2 High dose glucocorticosteroids | 6 | 329 | Peto Odds Ratio (Peto, Fixed, 95% CI) | 1.08 [0.68, 1.71] |
| 5 Normalisation of ALT or AST activities | 9 | 583 | Peto Odds Ratio (Peto, Fixed, 95% CI) | 1.12 [0.78, 1.62] |
| 5.1 Low dose glucocorticosteroids | 5 | 362 | Peto Odds Ratio (Peto, Fixed, 95% CI) | 1.30 [0.79, 2.14] |
| 5.2 High dose glucocorticosteroids | 4 | 221 | Peto Odds Ratio (Peto, Fixed, 95% CI) | 0.95 [0.56, 1.62] |
6.1. Analysis.
Comparison 6 Gluco+IFN versus Control+IFN (low and high dose of glucocorticosteroids) at maximal follow‐up, Outcome 1 Loss of HBeAg.
6.2. Analysis.
Comparison 6 Gluco+IFN versus Control+IFN (low and high dose of glucocorticosteroids) at maximal follow‐up, Outcome 2 HBeAg to anti‐HBe seroconversion.
6.3. Analysis.
Comparison 6 Gluco+IFN versus Control+IFN (low and high dose of glucocorticosteroids) at maximal follow‐up, Outcome 3 Loss of HBsAg.
6.4. Analysis.
Comparison 6 Gluco+IFN versus Control+IFN (low and high dose of glucocorticosteroids) at maximal follow‐up, Outcome 4 Loss of HBV DNA.
6.5. Analysis.
Comparison 6 Gluco+IFN versus Control+IFN (low and high dose of glucocorticosteroids) at maximal follow‐up, Outcome 5 Normalisation of ALT or AST activities.
Comparison 7. Gluco+IFN versus Control+IFN (low and high dose IFN) at maximal follow‐up.
| Outcome or subgroup title | No. of studies | No. of participants | Statistical method | Effect size |
|---|---|---|---|---|
| 1 Loss of HBeAg | 13 | 790 | Peto Odds Ratio (Peto, Fixed, 95% CI) | 1.41 [1.03, 1.92] |
| 1.1 Low dose IFN | 4 | 170 | Peto Odds Ratio (Peto, Fixed, 95% CI) | 1.32 [0.66, 2.65] |
| 1.2 High dose IFN | 9 | 620 | Peto Odds Ratio (Peto, Fixed, 95% CI) | 1.43 [1.01, 2.02] |
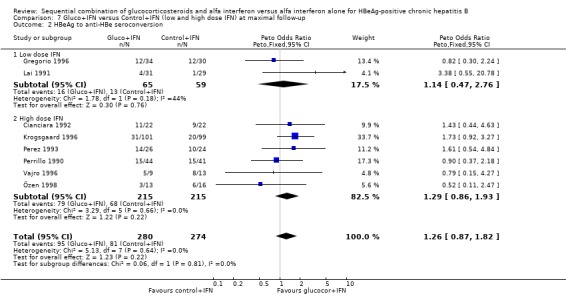
| 2 HBeAg to anti‐HBe seroconversion | 8 | 554 | Peto Odds Ratio (Peto, Fixed, 95% CI) | 1.26 [0.87, 1.82] |
| 2.1 Low dose IFN | 2 | 124 | Peto Odds Ratio (Peto, Fixed, 95% CI) | 1.14 [0.47, 2.76] |
| 2.2 High dose IFN | 6 | 430 | Peto Odds Ratio (Peto, Fixed, 95% CI) | 1.29 [0.86, 1.93] |
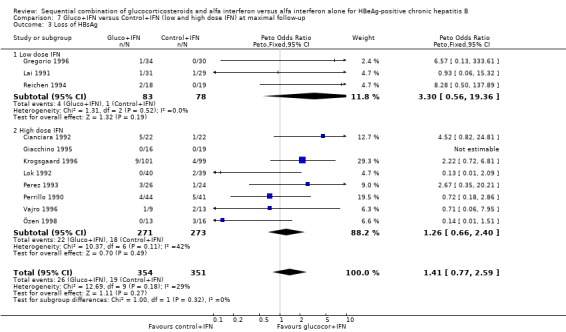
| 3 Loss of HBsAg | 11 | 705 | Peto Odds Ratio (Peto, Fixed, 95% CI) | 1.41 [0.77, 2.59] |
| 3.1 Low dose IFN | 3 | 161 | Peto Odds Ratio (Peto, Fixed, 95% CI) | 3.30 [0.56, 19.36] |
| 3.2 High dose IFN | 8 | 544 | Peto Odds Ratio (Peto, Fixed, 95% CI) | 1.26 [0.66, 2.40] |
| 4 Loss of HBV DNA | 13 | 790 | Peto Odds Ratio (Peto, Fixed, 95% CI) | 1.51 [1.12, 2.05] |
| 4.1 Low dose IFN | 4 | 170 | Peto Odds Ratio (Peto, Fixed, 95% CI) | 1.49 [0.75, 2.96] |
| 4.2 High dose IFN | 9 | 620 | Peto Odds Ratio (Peto, Fixed, 95% CI) | 1.52 [1.08, 2.14] |
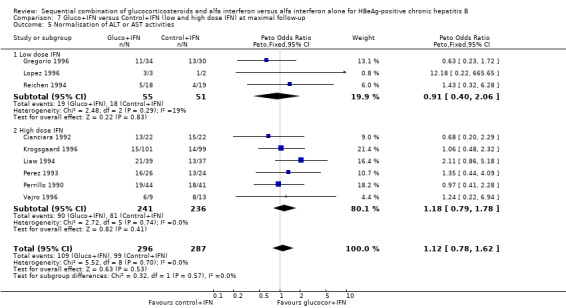
| 5 Normalisation of ALT or AST activities | 9 | 583 | Peto Odds Ratio (Peto, Fixed, 95% CI) | 1.12 [0.78, 1.62] |
| 5.1 Low dose IFN | 3 | 106 | Peto Odds Ratio (Peto, Fixed, 95% CI) | 0.91 [0.40, 2.06] |
| 5.2 High dose IFN | 6 | 477 | Peto Odds Ratio (Peto, Fixed, 95% CI) | 1.18 [0.79, 1.78] |
7.1. Analysis.
Comparison 7 Gluco+IFN versus Control+IFN (low and high dose IFN) at maximal follow‐up, Outcome 1 Loss of HBeAg.
7.2. Analysis.
Comparison 7 Gluco+IFN versus Control+IFN (low and high dose IFN) at maximal follow‐up, Outcome 2 HBeAg to anti‐HBe seroconversion.
7.3. Analysis.
Comparison 7 Gluco+IFN versus Control+IFN (low and high dose IFN) at maximal follow‐up, Outcome 3 Loss of HBsAg.
7.4. Analysis.

Comparison 7 Gluco+IFN versus Control+IFN (low and high dose IFN) at maximal follow‐up, Outcome 4 Loss of HBV DNA.
7.5. Analysis.
Comparison 7 Gluco+IFN versus Control+IFN (low and high dose IFN) at maximal follow‐up, Outcome 5 Normalisation of ALT or AST activities.
Comparison 8. Gluco+IFN versus Control+IFN (human and recombinant IFN) at maximal follow‐up.
| Outcome or subgroup title | No. of studies | No. of participants | Statistical method | Effect size |
|---|---|---|---|---|
| 1 Loss of HBeAg | 13 | 790 | Peto Odds Ratio (Peto, Fixed, 95% CI) | 1.41 [1.03, 1.92] |
| 1.1 Human IFN | 5 | 419 | Peto Odds Ratio (Peto, Fixed, 95% CI) | 1.60 [1.06, 2.42] |
| 1.2 Recombinant IFN | 8 | 371 | Peto Odds Ratio (Peto, Fixed, 95% CI) | 1.19 [0.75, 1.91] |
| 2 HBeAg to anti‐HBe seroconversion | 8 | 554 | Peto Odds Ratio (Peto, Fixed, 95% CI) | 1.26 [0.87, 1.82] |
| 2.1 Human IFN | 3 | 308 | Peto Odds Ratio (Peto, Fixed, 95% CI) | 1.41 [0.86, 2.29] |
| 2.2 Recombinant IFN | 5 | 246 | Peto Odds Ratio (Peto, Fixed, 95% CI) | 1.09 [0.62, 1.91] |
| 3 Loss of HBsAg | 11 | 705 | Peto Odds Ratio (Peto, Fixed, 95% CI) | 1.41 [0.77, 2.59] |
| 3.1 Human IFN | 4 | 343 | Peto Odds Ratio (Peto, Fixed, 95% CI) | 2.88 [1.16, 7.17] |
| 3.2 Recombinant IFN | 7 | 362 | Peto Odds Ratio (Peto, Fixed, 95% CI) | 0.79 [0.35, 1.79] |
| 4 Loss of HBV DNA | 13 | 790 | Peto Odds Ratio (Peto, Fixed, 95% CI) | 1.51 [1.12, 2.05] |
| 4.1 Human IFN | 5 | 419 | Peto Odds Ratio (Peto, Fixed, 95% CI) | 1.85 [1.23, 2.79] |
| 4.2 Recombinant IFN | 8 | 371 | Peto Odds Ratio (Peto, Fixed, 95% CI) | 1.18 [0.75, 1.87] |
| 5 Normalisation of ALT or AST activities | 9 | 587 | Peto Odds Ratio (Peto, Fixed, 95% CI) | 1.13 [0.79, 1.62] |
| 5.1 Human IFN | 4 | 384 | Peto Odds Ratio (Peto, Fixed, 95% CI) | 1.07 [0.67, 1.71] |
| 5.2 Recombinant IFN | 5 | 203 | Peto Odds Ratio (Peto, Fixed, 95% CI) | 1.22 [0.70, 2.15] |
8.1. Analysis.
Comparison 8 Gluco+IFN versus Control+IFN (human and recombinant IFN) at maximal follow‐up, Outcome 1 Loss of HBeAg.
8.2. Analysis.
Comparison 8 Gluco+IFN versus Control+IFN (human and recombinant IFN) at maximal follow‐up, Outcome 2 HBeAg to anti‐HBe seroconversion.
8.3. Analysis.
Comparison 8 Gluco+IFN versus Control+IFN (human and recombinant IFN) at maximal follow‐up, Outcome 3 Loss of HBsAg.
8.4. Analysis.
Comparison 8 Gluco+IFN versus Control+IFN (human and recombinant IFN) at maximal follow‐up, Outcome 4 Loss of HBV DNA.
8.5. Analysis.
Comparison 8 Gluco+IFN versus Control+IFN (human and recombinant IFN) at maximal follow‐up, Outcome 5 Normalisation of ALT or AST activities.
Comparison 9. Gluco+IFN versus Control+IFN (trials stratified according to length of follow‐up).
| Outcome or subgroup title | No. of studies | No. of participants | Statistical method | Effect size |
|---|---|---|---|---|
| 1 Loss of HBeAg | 13 | Peto Odds Ratio (Peto, Fixed, 95% CI) | Subtotals only | |
| 1.1 End of treatment | 5 | 201 | Peto Odds Ratio (Peto, Fixed, 95% CI) | 1.10 [0.58, 2.10] |
| 1.2 Six months after the end of treatment | 4 | 257 | Peto Odds Ratio (Peto, Fixed, 95% CI) | 0.98 [0.57, 1.69] |
| 1.3 More than six months after the end of treatment | 8 | 538 | Peto Odds Ratio (Peto, Fixed, 95% CI) | 1.51 [1.05, 2.17] |
| 2 HBeAg to anti‐HBe seroconversion | 8 | Peto Odds Ratio (Peto, Fixed, 95% CI) | Subtotals only | |
| 2.1 End of treatment | 2 | 79 | Peto Odds Ratio (Peto, Fixed, 95% CI) | 1.20 [0.45, 3.16] |
| 2.2 Six months after the end of treatment | 3 | 178 | Peto Odds Ratio (Peto, Fixed, 95% CI) | 0.99 [0.53, 1.87] |
| 2.3 More than six months after the end of treatment | 5 | 390 | Peto Odds Ratio (Peto, Fixed, 95% CI) | 1.49 [0.94, 2.37] |
| 3 Loss of HBsAg | 11 | Peto Odds Ratio (Peto, Fixed, 95% CI) | Subtotals only | |
| 3.1 End of treatment | 1 | 50 | Peto Odds Ratio (Peto, Fixed, 95% CI) | 2.67 [0.35, 20.21] |
| 3.2 Six months after the end of treatment | 4 | 195 | Peto Odds Ratio (Peto, Fixed, 95% CI) | 0.39 [0.13, 1.17] |
| 3.3 More than six months after the end of treatment | 7 | 462 | Peto Odds Ratio (Peto, Fixed, 95% CI) | 2.72 [1.23, 6.04] |
| 4 Loss of HBV DNA | 13 | Peto Odds Ratio (Peto, Fixed, 95% CI) | Subtotals only | |
| 4.1 End of treatment | 5 | 200 | Peto Odds Ratio (Peto, Fixed, 95% CI) | 1.52 [0.82, 2.83] |
| 4.2 Six months after the end of treatment | 4 | 428 | Peto Odds Ratio (Peto, Fixed, 95% CI) | 1.71 [1.11, 2.63] |
| 4.3 More than six months after the end of treatment | 8 | 340 | Peto Odds Ratio (Peto, Fixed, 95% CI) | 1.37 [0.86, 2.17] |
| 5 Normalisation of ALT or AST activities | 9 | Peto Odds Ratio (Peto, Fixed, 95% CI) | Subtotals only | |
| 5.1 End of treatment | 3 | 131 | Peto Odds Ratio (Peto, Fixed, 95% CI) | 2.23 [1.12, 4.43] |
| 5.2 Six months after the end of treatment | 2 | 285 | Peto Odds Ratio (Peto, Fixed, 95% CI) | 1.02 [0.57, 1.81] |
| 5.3 More than six months after the end of treatment | 5 | 243 | Peto Odds Ratio (Peto, Fixed, 95% CI) | 1.13 [0.67, 1.90] |
9.1. Analysis.
Comparison 9 Gluco+IFN versus Control+IFN (trials stratified according to length of follow‐up), Outcome 1 Loss of HBeAg.
9.2. Analysis.
Comparison 9 Gluco+IFN versus Control+IFN (trials stratified according to length of follow‐up), Outcome 2 HBeAg to anti‐HBe seroconversion.
9.3. Analysis.
Comparison 9 Gluco+IFN versus Control+IFN (trials stratified according to length of follow‐up), Outcome 3 Loss of HBsAg.
9.4. Analysis.
Comparison 9 Gluco+IFN versus Control+IFN (trials stratified according to length of follow‐up), Outcome 4 Loss of HBV DNA.
9.5. Analysis.
Comparison 9 Gluco+IFN versus Control+IFN (trials stratified according to length of follow‐up), Outcome 5 Normalisation of ALT or AST activities.
Characteristics of studies
Characteristics of included studies [ordered by study ID]
Cianciara 1992.
| Methods | Methodological quality Generation of allocation sequence: not reported (unclear). Allocation concealment: not reported (unclear). Double blinding: placebo tablets (adequate). Follow‐up: not described (Inadequate). | |
| Participants | Inclusion criteria of patients
(1) Chronic hepatitis B by histopathological examination.
(2) HBeAg positive.
(3) DNA‐polymerase positive.
(4) Transaminase levels twice above upper normal limit. Exclusion criteria of patients (1) Anti‐HDV positive. (2) Anti‐HIV positive. (3) Age below 18 years. (4) Antiviral or immunomodulating treatment during the last 12 months. (5) Non‐compensated hepatic cirrhosis. (6) Creatinine > 2.3 mg/dL. (7) Heamostasis disturbances. (8) Contraindications to glucocorticosteroids. (9) Acute worsening of hepatic disease. (10) Pregnancy. (11) Respiratory/circulatory insufficiency. Characteristics of included patients Gluco+IFN ‐ 22 patients Mean age: 36.2 Males/females: 18/4 Mean ALT levels: 91.2 IU/L Control+IFN ‐ 22 patients Mean age: 38.3 Males/females: 13/9 Mean ALT levels: 88.6. |
|
| Interventions | Gluco+IFN
4 weeks of prednisolone (0.6 mg/kg/day for 2 weeks, 0.45 mg/kg/day third week and 0.25 mg/kg/day fourth week).
2 weeks rest.
12 weeks IFN (10 MU/day for the first 5 days then thrice weekly for 11 weeks).
Total prednisolone dose: 931 mg/ 4 weeks. Control+IFN 4 weeks of placebo. 2 weeks rest. 12 weeks IFN (10 MU/day for the first 5 days then thrice weekly for 11 weeks). |
|
| Outcomes | Anti‐HBe positivity, Loss of HBeAg, ALT normalisation. Follow‐up period: 12 months after the end of treatment. |
|
| Notes | ||
| Risk of bias | ||
| Bias | Authors' judgement | Support for judgement |
| Allocation concealment? | Unclear risk | B ‐ Unclear |
Giacchino 1995.
| Methods | Methodological quality Generation of allocation sequence: described as randomised (unclear). Allocation concealment: described as double‐blind randomisation (unclear). Double blinding: placebo tablets (adequate). Follow‐up: complete follow up except for liver biopsy where 5 patients declined repeat biopsy (adequate). | |
| Participants | Inclusion criteria of patients
(1) HBV‐DNA, HBsAg and HBeAg positivity for at least 6 months prior to the study.
(2) Histological finding of chronic hepatitis. Exclusion criteria of patients (1) Evidence of delta infection. (2) Coexistent chronic illness including liver disease unrelated to HBV. (3) Cirrhosis. (4) Prolonged prothrombin time. (5) Received antiviral or immunosuppressive therapy in the previous year. Characteristics of included patients Gluco+IFN ‐ 16 patients Mean age: 9.5 years Male/female: 11/5 Median AST 60 IU/liter CAH: 8 CPH: 6 Control+IFN ‐ 19 patients Mean age 9.0 years Male/female: 15/4 Median AST 53 IU/L CAH: 6 CPH: 11 |
|
| Interventions | Gluco+IFN:
4 weeks of prednisolone (3 weeks of 0.6 mg/kg/day and 4th week 0.3 mg/kg/day)
2 weeks of no therapy.
12 weeks of human lymphoblastoid interferon alpha 5 MU/m2/day in the first week then up to 10 MU/m2 three times a week).
Total prednisolone dose: 1029mg/4 weeks. Control+IFN group: 4 weeks of placebo. 2 weeks of no therapy. 12 weeks of human lymphoblastoid interferon alpha 5 MU/m2/day in the first week then up to 10 MU/m2 three times a week). |
|
| Outcomes | HBeAg negativity, HBeAg positivity, HBsAg negativity
HBV‐DNA negativity, AST levels, changes in liver histology (responders versus non‐responders). Follow‐up period: 8 months after the end of treatment. |
|
| Notes | ||
| Risk of bias | ||
| Bias | Authors' judgement | Support for judgement |
| Allocation concealment? | Unclear risk | B ‐ Unclear |
Gregorio 1996.
| Methods | Methodological quality Generation of allocation sequence: randomisation schedules (adequate). Allocation concealment: sealed envelopes (adequate). Double blinding: placebo tablets (adequate). Follow‐up: complete follow up (adequate). | |
| Participants | Inclusion criteria of patients
(1) Age 2‐16 years.
(2) HBV DNA positive (> 10 pg/ml) on at least two occasions taken 1 month apart.
(3) HBeAg positive for at least 6 months.
(4) Inflammatory changes on a liver biopsy taken within 6 months before entry. Exclusion criteria of patients (1) antibodies to HIV. (2) antibodies to HDV. (3) decompensated liver disease. (4) cirrhosis. (5) serious medical illness. (6) other forms of liver disease. Characteristics of included patients Gluco+IFN ‐ 34 patients: Median age: 8,6 years Male/female: 19/15 Median AST: 62 IU/L Median ALT: 85 IU/L Median HBV DNA 2350 pg/ml Chronic hepatitis: 33 Control+IFN ‐ 30 patients Median age: 9.5 Male: 20/10 Median AST: 65 IU/L Median ALT: 120 IU/L (n=25) Median HBV DNA 4400 pg/ml Chronic hepatitis: 27 Control group ‐ 31 patients Median age: 10.9 Male/female: 17/13 Median AST: 45 IU/L Median ALT: 68 IU/L (n=24) Median HBV DNA 1425 pg/ml Chronic hepatitis: 26. |
|
| Interventions | Gluco+IFN group:
4 weeks gradually tapered prednisone 1 mg/kg/day.
2 weeks rest.
12 weeks of IFN: 5 days induction phase followed by 11 weeks of lymphablastoid IFN‐alfa 5 MU/m2 i.m.
Total prednisone dose: 1120/4 weeks. Control+IFN: 4 weeks of placebo. 2 weeks rest. 12 weeks of IFN: 5 days induction phase followed by 11 weeks of lymphablastoid IFN‐alfa 5 MU/m2 i.m. Control group: no treatment. |
|
| Outcomes | Loss of HBV DNA, HBeAg and HBsAg, anti‐HBe seroconversion, biochemical response (only data for responders versus non‐responders), liver histology (data only available for the two INF groups versus the untreated control group). Follow‐up period: 12 to 18 months after the end of treatment. |
|
| Notes | ||
| Risk of bias | ||
| Bias | Authors' judgement | Support for judgement |
| Allocation concealment? | Low risk | A ‐ Adequate |
Krogsgaard 1996.
| Methods | Methodological quality Generation of allocation sequence: described as randomised (unclear). Allocation concealment: sealed envelope procedure (adequate). Double blinding: placebo tablets (adequate). Follow‐up: complete follow up (adequate). | |
| Participants | Inclusion criteria of patients
(1) HBsAg positivity and HBeAg positivity for at least 6 months.
(2) ALT or AST elevated above the upper normal limit on at least two occasions separated by at least 1 month.
(3) Liver biopsy within the preceding 3 months after acute infection showing: CPH or CAH or active cirrhosis.
(4) HBV‐DNA levels at least twice the negative cut‐off value for the assay, determined on at least two occasions separated by at least 1 month. Exclusion criteria of patients (1) Evidence of hepatic decompensation. (2) Presence of antibodies to HIV. (3) Antiviral/immune modulatory therapy within the previous 12 months. (4) Evidence of any neurological dysfunction. (5) Renal failure (creatinine > 200 mmol/l). (6) Other chronic systemic illness. (7) Non‐compensated cardiovascular and/or respiratory abnormalities. (8) Acute exacerbation of the disease in the previous 3 months. (9) Clotting abnormalities precluding a liver biopsy. (10) Contraindication for steroid therapy. (11) Age below 18. (12) In females: inadequate protection against pregnancy during the trial period. Characteristics of included patients All patients ‐ 200 patients HBeAg positivity: 200 HBV‐DNA positivity: 110 HBsAg positivity: 200 Gluco+IFN ‐ 101 patients Mean age: 38.15 Males/females: 86/15 Cirrhosis/CAH: 85 CPH: 16 ALT/AST levels: 2.60 x upper normal limit. Caucasians 93%. Control+IFN ‐ 99 patients Mean age: 38.81 Males/females: 81/18 Cirrhosis/CAH: 82 CPH: 17 ALT/AST levels: 2.64 x upper normal limit. Caucasians 96%. |
|
| Interventions | Gluco+IFN:
Prednisolone 2 weeks of 0.6 mg/kg/day, 1 week of 0.45 mg/kg/day, 1 week of 0.25 mg/kg/day.
Rest phase 2 weeks.
Interferon 10 MU daily for 5 days, 10 MU thrice weekly for 11 weeks.
Total prednisolone dose: 931 mg/4 weeks Control+IFN: Placebo for 4 weeks Rest phase 2 weeks. Interferon 10 MU daily for 5 days, 10 MU thrice weekly for 11 weeks. |
|
| Outcomes | Mortality, HBeAg negativity, anti‐HBe positivity, HBV‐DNA negativity, HBsAg negativity, anti‐HBs positivity, ALT normalisation. Follow‐up period: 12 months after the end of treatment (6 months for HBV DNA and ALT normalisation). |
|
| Notes | Information about loss of HBV DNA and ALT leves were unpublished data. | |
| Risk of bias | ||
| Bias | Authors' judgement | Support for judgement |
| Allocation concealment? | Low risk | A ‐ Adequate |
Lai 1991.
| Methods | Methodological quality Generation of allocation sequence: described as randomised (unclear). Allocation concealment: the code for the prednisone/placebo group was only broken after all the data for these two groups up to 24 weeks i.e. at the completion of therapy, were computerized and rendered unalterable (adequate). Double blinding: placebo tablets (adequate). Follow‐up: not reported (unclear). | |
| Participants | Inclusion criteria of patients
90 children aged 2‐17 years
HBsAg‐, HBeAg‐, and HBV DNA positive on at least 3 occasions, at intervals of at least 1 month, in the 6 months before entry to the trial. Exclusion criteria of patients Other systemic illnesses Anti‐HDV positive Anti‐HIV positive History of antiviral or immunosuppressive therapy Characteristics of included patients Pred+IFN ‐ 31 patients Male/female: 24/7 Median age: 6(2‐17) Median AST: 15 IU/L (11‐54) Median ALT: 14 IU/L (14‐75) Placebo+IFN ‐ 29 patients Male/female: 14/15 Median age: 6.5 (4‐16) Median AST: 14 IU/L (9‐33) Median ALT: 12 IU/L (5‐34) Control ‐ 30 patients Male/female: 16/14 Median age: 6(3‐15) Median AST: 14 IU/L (8‐40) Median ALT: 9 IU/L (6‐98) |
|
| Interventions | Gluco+IFN:
6 weeks of syrup prednisone: 0.6/0.4/0.2 mg/kg every 2 weeks.
2 weeks rest.
16 weeks of IFN: recombinant alfa‐2b interferon at a dose of 5 MU/m2 s.c. weekly for 16 weeks.
Total prednisone dosis: 1176 mg/ 6 weeks. Control+IFN: 6 weeks of syrup placebo: 0.6/0.4/0.2 mg/kg every 2 weeks. 2 weeks rest. 16 weeks of IFN: recombinant alfa‐2b interferon at a dose of 5MU/m2 s.c. weekly for 16 weeks. Control group: 24 weeks of syrup vitamin complex (B1, B6 and C). |
|
| Outcomes | Loss of HBeAg, HBV DNA and HBsAg, anti‐ HBe positivity, anti HBs positivity. Follow‐up period: 12 months after the end of treatment. |
|
| Notes | Serological data are apparently collected during follow up, and at the same time at maximal follow up | |
| Risk of bias | ||
| Bias | Authors' judgement | Support for judgement |
| Allocation concealment? | Low risk | A ‐ Adequate |
Liaw 1994.
| Methods | Methodological quality Generation of allocation sequence: randomisation schedules (adequate). Allocation concealment: randomisation code was held by an independent agent and was not broken until the final evaluation (adequate). Double blinding: placebo tablets (adequate). Follow‐up: complete follow up (adequate). | |
| Participants | Inclusion criteria of patients
(1) Age 16 to 65.
(2) Heterosexual male.
(3) HBsAg positivity for at least 6 months.
(4) HBeAg positivity for at least 6 months.
(5) Raised ALT (N<40 U/liter).
(6) Liver biopsy taken within the past 3 months showing CAH or chronic lobular hepatitis (CLH) with hepatic expression of HBcAg.
(7) HBV‐DNA in serum on at least two occasions 1 month apart before entry.
(8) Patients with cirrhosis were also included. Exclusion criteria of patients (1) Antiviral or immunosuppressive treatment within 1 year prior to to entry. (2) HDV infection. (3) Intravenous drug abuse. (4) Decompensated liver disease or other serious illness which might interfere with this trial. (5) Alphafetoprotein above 100ng/ml concomitant ALT elevation. Characteristics of included patients Patients were stratified according to histologic diagnosis (CAH or CLH) and randomly assigned to one of the following 3 groups: Gluco+IFN ‐ 39 patients Mean age: 32 Mean ALT : 231 U/l Cirrhosis: 7.7 % Control+IFN ‐ 37 patients Mean age: 30 Mean ALT: 260 U/l Cirrhosis: 13.5 % Control group ‐ 40 patients Mean Age: 32 Mean ALT 240U/l Cirrhosis: 12.5 % |
|
| Interventions | Gluco+IFN:
4 weeks of prednisolone: 30 mg/day for 3 weeks then 15 mg/day for the 4th week.
2 weeks of no treatment.
12 weeks of interferon: 5‐day induction 4 MU/m2 for 3 days + 6 MU/m2 for 2 days followed by 6 MU/m2 3 times weekly for 11 weeks.
Total prednisolone dosis: 735 mg/4 weeks. Control+IFN: 4 weeks of matching placebo. 2 weeks of no treatment. 12 weeks of interferon: 5‐day induction 4 MU/m2 for 3 days + 6 MU/m2 for 2 days followed by 6 MU/m2 3 times weekly for 11 weeks. Control group: 18 weeks of placebo capsules. |
|
| Outcomes | Loss of HbeAg and HBV‐DNA, ALT normalisation, changes in Knodell score. Follow‐up period: 12 months after the end of treatment. |
|
| Notes | ||
| Risk of bias | ||
| Bias | Authors' judgement | Support for judgement |
| Allocation concealment? | Low risk | A ‐ Adequate |
Lok 1992.
| Methods | Methodological quality Generation of allocation sequence: described as randomised (unclear). Allocation concealment: (adequate). Double blinding: placebo tablets (adequate). Follow‐up: an unspecified number of patients (>3) had premature termination of treatment (Inadequate). | |
| Participants | Inclusion criteria of patients
113 patients were included.
(1) Ethnic Chinese.
(2) Age 18‐60 years.
(3) HBsAg positive for more than 6 months.
(4) HBeAg positive.
(5) HBV DNA positive.
(6) Stable serum HBV DNA and ALT levels on at least three occasions, 1 month apart during the 6 months before entry. Exclusion criteria of patients 33 patients were excluded due to: (1) Decompensated liver disease. (2) Platelet counts of < 100x109/L. (3) Prothrombin time > 3 seconds longer than control. (4) Severe systemic illness. (5) Immunosuppressive or antiviral therapy within the preceding 12 months. (6) Refusal of contraception in women of childbearing age. (7) Alcoholism. (8) HDV positive. (9) anti‐HIV positive. Characteristics of included patients Gluco+IFN ‐ 40 patients Male/female: 24/16 Mean age: 28 Control+IFN ‐ 39 patients Male/female: 25/14 Mean age: 29 Control group ‐ 36 patients Male/female: 22/14 Mean age: 28. |
|
| Interventions | Gluco+IFN:
6 weeks of oral prednisone: 45/30/15 mg/day each for 2 weeks.
2 weeks rest.
16 weeks IFN: recombinant IFN alfa‐2b 10 MU/thrice weekly s.c.
Total prednisone dosis: 1260 mg/ 6 weeks. Control+IFN: 6 weeks placebo: tapered course of matching oral placebo. 2 weeks rest. 16 weeks IFN: recombinant IFN alfa‐2b 10 MU/thrice weekly s.c. Control group: No treatment. |
|
| Outcomes | Loss of HBV DNA, HBeAg and HBsAg, Biochemical and histological response (only available for responders versus non‐responders). Follow‐up period: 6 months after the end of treatment. |
|
| Notes | Patients with elevated ALT levels were separately randomised from those with normal ALT levels. 6 patients from the control group were re‐randomised to the treatment groups. |
|
| Risk of bias | ||
| Bias | Authors' judgement | Support for judgement |
| Allocation concealment? | Low risk | A ‐ Adequate |
Lopez 1996.
| Methods | Methodological quality Generation of allocation sequence: described as randomised (unclear). Allocation concealment: method of allocation concealment was not reported (unclear). Double blinding: no method of double blinding (unclear). Follow‐up: not reported (unclear). | |
| Participants | Inclusion criteria of patients
(1) 6 months antigen positive and HBV DNA positive.
(2) chronic hepatitis.
(3) no other associated/concurrent illness. Characteristics of included patients Mean age: 7.8. |
|
| Interventions | Gluco+IFN:
3 weeks of prednisone: 1 week of 1 mg/kg/day, 1 week of 0.5 mg/kg/day and 1 week of 0.25 mg/kg/day.
16 weeks of IFN: 3 MU/m2 three times a week
Total prednisone dose: 306 mg/3 weeks (child weight 25 kg). Control+IFN: 3 weeks of a mix of vitamins and minerals. 16 weeks of IFN: 3 MU/m2 three times a week. |
|
| Outcomes | HBeAg negativity, HBV DNA negativity, ALT normalisation, liver histology (only data for responders versus non‐responders). Follow‐up period: Data collected at the end of treatment. |
|
| Notes | Data on virological and biochemical responses are apparently not obtained at the same time. | |
| Risk of bias | ||
| Bias | Authors' judgement | Support for judgement |
| Allocation concealment? | Unclear risk | B ‐ Unclear |
Perez 1993.
| Methods | Methodological quality Generation of allocation sequence: described as randomised (unclear). Allocation concealment: method of allocation concealment was not reported (unclear). Double blinding: no or inadequate methods of blinding (unclear). Follow‐up: 53 included, 4 patients were lost to complete follow up ‐ reasons described (adequate). | |
| Participants | Inclusion criteria of patients
(1) HBeAg and HBV‐DNA positivity for at least six months.
(2) serum ALT activity at least 1.5 times the upper normal limit.
(3) Liver biopsy before treatment compatible with chronic hepatitis. Exclusion criteria of patients (1) Other causes of liver disease. Characteristics of included patients 53 included patients Mean age: 39 Male/females: not reported Cirrhosis: 8/53 CAH: 39/53 CPH: 6/53 Mean ALT >100 IU/l: 53 HBeAg positive: 53 HBV‐DNA positive: 53. |
|
| Interventions | Gluco+IFN :
6 weeks of decreasing doses of prednisone (60, 40, 20 mg daily) every 2 weeks.
2 weeks drug free period.
Interferon alfa‐2b 10 MU 3 times weekly was then administered subcutaneously for 16 consecutive weeks.
Total prednisone dose: 1540 mg/ 6 weeks. Control+IFN: 24 weeks without treatment (functioning as controls for group 1). Interferon alfa‐2b 10 MU 3 times weekly was then administered subcutaneously for 16 consecutive weeks. |
|
| Outcomes | HBeAg negativity, HBV‐DNA negativity, HBsAg negativity, anti‐HBe positivity, ALT normalisation. Follow‐up period: Data collected at the end of treatment. |
|
| Notes | ||
| Risk of bias | ||
| Bias | Authors' judgement | Support for judgement |
| Allocation concealment? | Unclear risk | B ‐ Unclear |
Perrillo 1990.
| Methods | Methodological quality Generation of allocation sequence: (adequate). Allocation concealment: randomisation code unbroken until completion of treatment (adequate). Double blinding: placebo tablets (adequate). Follow‐up: 16 patients were lost to complete. follow up, only 7 are accounted for (inadequate). | |
| Participants | 545 patients were screened for the study, 376 were excluded. Inclusion criteria of patients (1) > 18 years of age. (2) HBsAg + for at least 6 months. (3) HBeAg + on 3 or more occasions, at least 1 month apart, during the 6 months before entry. (4) HBV‐DNA + on 3 or more occasions, at least 1 month apart, during the 6 months before entry. (5) ALT elevation more than 1.3 times the upper normal limit. (6) Evidence of chronic hepatitis on liver biopsy. Exclusion criteria of patients (1) Corticosteroid or antiviral therapy during the previous 12 months. (2) Pregnancy. (3) Other serious medical illnesses that might preclude. completion of the study. (4) Hematocrit values less than 30%. (5) Platelet counts below 70x109/L. (6) Granulocyte counts below 1.5x10⁹/L. (7) Elevated serum creatinine level. (8) Alcoholism or drug abuse. (9) HDV positive. (10) HIV positive. (11) Other potential causes of liver disease. (12) Prothrombin time > 3 seconds longer than normal. (13) Serum albumin level < 30 g/L. (14) Bilirubin level > 2mg/dl. Characteristics of included patients Gluco+IFN ‐ 44 patients Mean age: 40 Male/female: 86/14(%) Mean HBV‐DNA 117 pg/ml Mean ALT: 152 U/L Control+IFN (5 MU) ‐ 41 patients Mean age: 41 Male/female: 80/20 (%) Mean HBV‐DNA: 127 pg/ml Mean ALT: 183 U/L Control+IFN (1 MU) ‐ 41 patients Mean age: 37 Male/female: 88/12 (%) Mean HBV‐DNA: 176 pg/ml Mean ALT: 182 U/L Control group ‐ 43 patients Mean age: 41 Male/female: 84/16 (%) Mean HBV‐DNA: 146 pg/ml Mean ALT 168 U/L. |
|
| Interventions | Gluco+IFN:
6 weeks of prednisone (60/40/20 mg/day every second week).
2 weeks rest.
Interferon 5 MU daily for 16 weeks.
Total prednisone dose: 1540 mg/ 6 weeks. Control+IFN (5 MU) 41 patients Placebo for 6 weeks. 2 weeks rest. Interferon 5 million units daily for 16 weeks. Control+IFN (1 MU) 41 patients Placebo for 6 weeks. 2 weeks rest. Interferon 1 million units daily for 16 weeks. Control group 43 patients No treatment for 24 weeks. |
|
| Outcomes | Mortality, loss of HBV DNA, HBeAg and HBsAg, ALT/AST normalisation, liver histology (only data for responders versus non‐responders) Follow‐up period: 6 months after the end of treatment. |
|
| Notes | ||
| Risk of bias | ||
| Bias | Authors' judgement | Support for judgement |
| Allocation concealment? | Low risk | A ‐ Adequate |
Reichen 1994.
| Methods | Methodological quality Generation of allocation sequence: (adequate) Allocation concealment: central randomisation (adequate). Double blinding: placebo tablets (adequate). Follow‐up: 3 patients lost to follow up, reasons described. Virological data at the end of treatment are not available for 6 patients, no reasons given (adequate). | |
| Participants | Inclusion criteria of patients
(56 out of 88 evaluated patients were included.)
(1) Age 18‐70 years.
(2) ALT at least twice the upper limit of normal.
(3) Replicating HBV infection documented for at least 6 months.
(4) CAH on biopsy. Exclusion criteria of patients (1) Lack of histological activity. (2) Alcohol abuse. (3) Spontaneous seroconversion. (4) Autoimmune liver disease. (5) HIV positivity. (6) Unwilling to participate. (7) Fertile women without adequate contraception. (8) Pregnancy or lactation. (9) Intravenous drug abuse. (10) Decompensated cirrhosis. (11) Hepatocellular carcinoma. (12) Previous interferon therapy and immunosuppressive therapy within the preceding 6 months. Characteristics of included patients All patients were HBsAg and HBeAg positive. Gluco+IFN ‐ 18 patients Male/female: 17/1 Mean age: 38 Mean ALT: 193 IU/L Mean HBV DNA: 416 pg/ml Control+IFN ‐ 19 patients Male/female: 17/2 Mean age: 43 Mean ALT 283 IU/L Mean HBV DNA 1224 pg/ml Control group ‐ 19 patients Male/female: 17/2 Mean age 39 Mean ALT: 311 IU/L Mean HBV DNA: 340 pg/ml. |
|
| Interventions | Gluco+IFN:
4 weeks of prednisone 50 mg for 2 weeks followed by 25 mg for another 2 weeks.
2 weeks drug free interval.
Recombinant interferon alpha‐2b injected subcutaneously at a dose of 1.5 MU three times weekly for 4 months.
Total prednisone dosis: 1050 mg/ 4 weeks Control+IFN: 4 weeks of identical looking placebo tablets. 2 weeks drug free interval. Recombinant interferon alpha‐2b injected subcutaneously at a dose of 1.5 MU three times weekly for 4 months. Control group: 4 weeks of identical looking placebo tablets. 2 weeks drug free interval. Recombinant interferon alpha‐2b injected subcutaneously at a dose of 5 MU three times weekly for 4 months. |
|
| Outcomes | Loss of HBeAg, HBV DNA and HBsAg, ALT levels, liver histology, adverse events. Follow‐up period: 7.5 months after the end of treatment. |
|
| Notes | ||
| Risk of bias | ||
| Bias | Authors' judgement | Support for judgement |
| Allocation concealment? | Low risk | A ‐ Adequate |
Vajro 1996.
| Methods | Methodological quality Generation of allocation sequence: described as randomised but 4 out of 31 patients were re‐allocated after randomisation (unclear). Allocation concealment: described as unblinded allocation (unclear). Double blinding: no or inadequate methods of blinding (unclear). Follow‐up: (adequate). | |
| Participants | Inclusion criteria of patients
(1) Inclusion criteria not described, only patient characteristics. Exclusion criteria of patients (1) Previous antiviral or immunosuppressive therapy. (2) Antibody to HIV. (3) Antibody to HDV. (4) Decompensated liver disease. (5) Autoimmune disease. (6) Other serious illness. (7) Other forms of liver disease. Characteristics of included patients Control+IFN ‐ 13 patients Males/females: 9 Mean age: 6.92 Mean HBV DNA: 300 pg/ml Mean ALT: 238 U/L Histology (knodell): 10.6 Gluco+IFN ‐ 9 patients Males/females: 6 Mean age: 8 Mean HBV DNA: 392 pg/ml Mean ALT: 119 U/L Histology (knodell): 8.2 Control group ‐ 9 patients Males/females: 9 Mean age: 8.91 Mean HBV DNA: 299 pg/ml Mean ALT: 117 U/L Histology (knodell): 7.6. |
|
| Interventions | Gluco+IFN:
6 weeks of prednisone: 2 weeks 1 mg/kg, and 4 weeks tapering.
2 weeks washout.
1 year of IFN: 10 MU/m2 recombinant IFN alfa‐2b three times weekly .
Total prednisone dosis: 1575 mg/6 weeks. Control+IFN: 1 year of IFN: 10 MU/m2 recombinant IFN alfa‐2b three times weekly. Control group: No treatment. |
|
| Outcomes | HBsAg negativity, Anti‐HBs positivity, HBeAg negativity, anti‐HBe positivity, HBV DNA negativity, ALT normalisation, liver histology (IFN treated patients versus non‐treated patients). Follow‐up period: 24 months after the end of treatment. |
|
| Notes | ||
| Risk of bias | ||
| Bias | Authors' judgement | Support for judgement |
| Allocation concealment? | Unclear risk | B ‐ Unclear |
Özen 1998.
| Methods | Methodological quality Generation of allocation sequence: described as randomised (unclear). Allocation concealment: unclear. Double blinding: no or inadequate methods of blinding (unclear). Follow‐up: not reported (unclear). | |
| Participants | Inclusion criteria of patients
HBeAg and HBV DNA positive, ALT levels > 40IU/L, Chronic hepatitis. Exclusion criteria of patients Previously antiviral therapy, lekopenia, thrombocytopenia, elevated serum creatinine level, cirrhosis, other causes of liver disease or malignancy. Characteristics of included patients Gluco+IFN ‐ 13 patients Age: 8.4 male/female: 11/2 Mean ALT: 177.6 Control+IFN ‐ 16 patients Age: 8.2 years male/female: 13/3 Mean ALT: 175.3. |
|
| Interventions | Gluco+IFN:
3 weeks of prednisone 60 mg/day with 1 week tapering followed by 24 weeks of IFN 5 MU/sqm thrice weekly.
Total prednisone dose: 1260 mg. Control+IFN: 24 weeks of IFN 5 MU/sqm thrice weekly. Total IFN dose: 331 MU. |
|
| Outcomes | Loss of HBeAg, loss of HBV DNA, anti‐HBe positivity, ALT levels. Follow‐up period: 6 months after the end of treatment. |
|
| Notes | ||
| Risk of bias | ||
| Bias | Authors' judgement | Support for judgement |
| Allocation concealment? | Unclear risk | B ‐ Unclear |
Characteristics of excluded studies [ordered by study ID]
| Study | Reason for exclusion |
|---|---|
| Brook 1993 | Compared glucocorticosteroid+IFN treatment with no treatment. |
| Fevery 1990 | It was not possible for us to ascertain whether the study was a randomised clinical trial or not. Contact with authors failed. |
| Gonzalez 1995 | This study was initially a randomised clinical trial (RCT). However, the researchers stopped the randomised allocation of patients, as another study (Perrillo 1990) was published showing no benefit from a pretreatment regimen. All subsequently included patients were then allocated to the control+IFN group alone. |
| Guan 1995 | It was not possible for us to ascertain whether the study was a randomised clinical trial or not. Contact with authors failed. |
| Gómez 1996 | Sequential versus concomitant glucocorticosteroid/IFN treatment. This trial design implies glucocorticosteroid in both intervention arms. |
| Leung 1990 | Abstract did not contain data. Correspondence were sought with the primary author, who did no longer have any data. According to Dr. N. Leung the study was never published as it showed no benefit of glucocorticosteroid pretreatment. |
| Liaw 1991 | Comprised only patients with chronic non‐A, non‐B hepatitis. Patients with chronic hepatitis B were excluded. |
| Liaw 1993 | Comprised only patients with chronic non‐A, non‐B hepatitis. Patients with chronic hepatitis B were excluded. |
| Lok 1988 | Compared glucocorticosteroid+IFN treatment with no treatment. |
| Lok/Lai 1990 | Review of 5 RCTs. Two of these RCTs were included (Lai 1991; Lok 1992). Two were excluded (Perrillo 1988; Lok 1988), and finally one study is awaiting assessment (Omata 1985). |
| Mannho 1996 | Concomitant and not sequential administration glucocorticosteroids and IFN. |
| Martin 1998 | Observational study (case series). Patients with mean ALT level less than 3 x the upper normal limit received prednisone pretreatment, and patients with mean ALT level above that level received IFN alone. |
| Monzon 1990 | Preliminary results, data are only available for 6 out of 12 patients. The final publication of these preliminary results could not be retrieved. However, it may be a spin off study of the Gonzales study (Gonzales 1995), but it can not be ascertained at present. |
| Niederau 1992 | Non‐responders in the glucocorticosteroid+IFN group were retreated with a different IFN dose. The follow up time differed between the intervention groups. Therefore it was not possible to extract reliable data. |
| Omata 1985 | It was not possible for us to ascertain whether the study was a randomised clinical trial or not. Contact with authors failed. |
| Paul 1991 | Review of Perrillo 1988 and Perrillo 1990. |
| Perrillo 1988 | Compared glucocorticosteroid+IFN treatment with no treatment. |
| Robson 1992 | Compared glucocorticosteroid+IFN treatment with no treatment. |
| Takano 1992 | Observational study (case series) |
| Tupasi 2002 | Two intervention arms: (1) glucocorticosteroid + IFN (2) Placebo alone. |
| Utili 1994 | Compared glucocorticosteroid+IFN treatment with no treatment. |
Contributions of authors
Martin Mellerup updated the review 22 May 2005.
Martin Mellerup revised the protocol, performed the final searches, selected trials for inclusion, performed data extraction, and drafted the systematic review. Kim Krogsgaard drafted the initial protocol, validated data extraction, supervised the protocol amendment, performed the initial searches, selected trials for inclusion, and revised the systematic review. Philippe Mathurin revised the protocols and the systematic review. Christian Gluud supervised Martin Mellerup's contributions, revised the protocol amendment, and revised the systematic review. Thierry Poynard revised the protocols, selected trials for inclusion, and revised the systematic review.
Sources of support
Internal sources
Copenhagen Hospital Corporation, Denmark.
External sources
Copenhagen Hospital Corporation's Medical Research Council, Denmark.
The 1991 Pharmacy Foundation, Denmark.
Declarations of interest
The authors have no permanent financial contracts with companies producing interferon or glucocorticosteroid preparations. Kim Krogsgaard and Thierry Poynard have been involved in prospective and retrospective studies sponsored by Schering Plough, Roche, Glaxo Wellcome, and AMGEN.
Edited (no change to conclusions)
References
References to studies included in this review
Cianciara 1992 {published data only}
- Cianciara J, Gladysz A, Juszczyk J, Laskus T, Mach G, Simon K, et al. [Treatment of chronic hepatitis B with interferon alpha (Wellferon) with and without previous corticosteroid therapy ‐‐ results of a multicenter, double blind study]. Polskie Archwum Medycyny Wewnetrznej 1992;88(6):430‐40. [PubMed] [Google Scholar]
Giacchino 1995 {published data only}
- Giacchino R, Facco F, Giambartolomei G, Navone C, Timitilli A, Cirillo C, et al. Treatment of children with chronic hepatitis B with a combination of steroids and human lymphoblastoid interferon. Chemioterapia 1988;7 Suppl 3:20‐5. [PubMed] [Google Scholar]
- Giacchino R, Main J, Timitilli A, Giambartolomei G, Facco F, Cirillo C, et al. Dual‐centre, double‐blind, randomised trial of lymphoblastoid interferon alpha with or without steroid pretreatment in children with chronic hepatitis B. Liver 1995;15(3):143‐8. [DOI] [PubMed] [Google Scholar]
Gregorio 1996 {published and unpublished data}
- Gregorio GV, Jara P, Hierro L, Diaz C, Vega A, Vegnente A, et al. Lymphoblastoid interferon alfa with or without steroid pretreatment in children with chronic hepatitis B: a multicenter controlled trial. Hepatology 1996;23(4):700‐7. [DOI] [PubMed] [Google Scholar]
- Gregorio GV, Jones H, Choudhuri K, Vegnente A, Bortolotti F, Mieli VG, et al. Autoantibody prevalence in chronic hepatitis B virus infection: effect in interferon alfa. Hepatology 1996;24(3):520‐3. [MEDLINE: ] [DOI] [PubMed] [Google Scholar]
Krogsgaard 1996 {published and unpublished data}
- Krogsgaard K, Marcellin P, Trepo C, Berthelot P, Sanchez‐Tapias JM, Bassendine M, et al. Prednisolone withdrawal therapy enhances the effect of human lymphoblastoid interferon in chronic hepatitis B. Journal of Hepatology 1996;25:803‐13. [MEDLINE: ] [DOI] [PubMed] [Google Scholar]
Lai 1991 {published data only}
- Lai CL, Lin HJ, Lau JN, Lok AS, Wu PC, Chung HT, et al. Effect of recombinant alpha 2 interferon with or without prednisone in Chinese HBsAg carrier children. The Quarterly Journal of Medicine 1991;78(286):155‐63. [MEDLINE: ] [PubMed] [Google Scholar]
Liaw 1994 {published data only}
- Liaw YF, Lin SM, Chen TJ, Chien RN, Sheen IS, Chu CM. Beneficial effect of prednisolone withdrawal followed by human lymphoblastoid interferon on the treatment of chronic type B hepatitis in Asians: a randomized controlled trial. Journal of Hepatology 1994;20(2):175‐80. [MEDLINE: ] [DOI] [PubMed] [Google Scholar]
- Liaw YF, Lin SM, Sheen IS, Chen TJ, Chu CM. Treatment of chronic type B hepatitis in Southeast Asia. American Journal of Medicine 1988;85(2A):147‐9. [MEDLINE: ] [PubMed] [Google Scholar]
- Yeh C‐T, Sheen I‐S, Chen T‐C, Hsieh S‐Y, Chu C‐M, Liaw Y‐F. Prednisolone modulates the therapeutic effect of interferon to eliminate preferentially the hepatitis B virus precore stop mutant. Journal of Hepatology 2000;32:829‐36. [DOI] [PubMed] [Google Scholar]
Lok 1992 {published data only}
- Lok AS, Lai CL, Lau JN, Chung HT. Randomized controlled trial of alfa‐2b interferon (IFN), with or without prednisone priming in chinese patients with chronic hepatitis B (CHB). AASLD abstracts of papers. 1990; Vol. 12, issue 4:847.
- Lok AS, Wu PC, Lai CL, Lau JY, Leung EK, Wong LS, et al. A controlled trial of interferon with or without prednisone priming for chronic hepatitis B. Gastroenterology 1992;102(6):2091‐7. [MEDLINE: ] [DOI] [PubMed] [Google Scholar]
Lopez 1996 {published data only}
- Lopez C, Hassan I, Gonzalez I, Cortez J, Isava I, Calderon A, et al. Treatment of children with chronic Hepatitis B with Interferon alfa 2b. Preliminary communication [[Tratamiento de ninõs con hepatitis B cronica con interferon alfa 2b. Comunicacion preliminar]]. Revista de la Sociedad Venezolana de Gastroenterologia 1996;50(1):36‐8. [Google Scholar]
Perez 1993 {published data only}
- Perez V, Findor J, Tanno H, Sorda J. A controlled trial of high dose interferon, alone and after prednisone withdrawal, in the treatment of chronic hepatitis B: long term follow up. Gut 1993;34(2 Suppl):S91‐S94. [MEDLINE: ] [DOI] [PMC free article] [PubMed] [Google Scholar]
- Perez V, Tanno H, Villamil F, Fay O. Recombinant interferon alfa‐2b following prednisone withdrawal in the treatment of chronic type B hepatitis. Journal of Hepatology 1990;11 Suppl 1:S113‐S117. [MEDLINE: ] [DOI] [PubMed] [Google Scholar]
Perrillo 1990 {published data only}
- Perrillo RP, Schiff ER, Davis GL, Bodenheimer HC, Lindsay K, Payne J, et al. A randomized, controlled trial of interferon alfa 2b alone and after prednisone withdrawal for the treatment of chronic hepatitis B. New England Journal of Medicine 1990;323:295‐301. [MEDLINE: ] [DOI] [PubMed] [Google Scholar]
Reichen 1994 {published and unpublished data}
- Reichen J, Bianchi L, Frei PC, Male PJ, Lavanchy D, Schmid M. Efficacy of steroid withdrawal and low‐dose interferon treatment in chronic active hepatitis B. Results of a randomized multicenter trial. Swiss Association for the Study of the Liver. Journal of Hepatology 1994;20(2):168‐74. [MEDLINE: ] [DOI] [PubMed] [Google Scholar]
Vajro 1996 {published data only}
- Vajro P, Tedesco M, Fontanella A, Vincenzo A, Vecchione R, Ammendola R, et al. Prolonged and high dose recombinant interferon alpha‐2b alone or after prednisone priming accelerates termination of active viral replication in children with chronic hepatitis B infection. Pediatric Infectious Disease Journal 1996;15(3):223‐31. [MEDLINE: ] [DOI] [PubMed] [Google Scholar]
Özen 1998 {published data only}
- Özen H, Kocak N, Gurakan F, Yuce A. Recombinant interferon‐alpha‐2A with or without steroid pretreatment in children with chronic hepatitis B. The Turkish Journal of Pediatrics 1998;40(4):503‐14. [MEDLINE: ] [PubMed] [Google Scholar]
References to studies excluded from this review
Brook 1993 {published data only}
- Brook MG, Main J, Yap I, Chan G, Karayiannis P, Crossey M, et al. Short report: prednisolone withdrawal followed by lymphoblastoid interferon in the therapy of adult patients with presumed childhood‐acquired chronic hepatitis B virus infection. Alimentary Pharmacology & Therapeutics 1993;7(3):331‐6. [DOI] [PubMed] [Google Scholar]
Fevery 1990 {published data only}
- Fevery J, Elewaut A, Michielsen P, Nevens F, Eyken P, Adler M, et al. Efficacy of interferon alfa‐2b with or without prednisone withdrawal in the treatment of chronic viral hepatitis B. A prospective double‐blind Belgian‐Dutch study. Journal of Hepatology 1990;11:S108‐S112. [MEDLINE: ] [DOI] [PubMed] [Google Scholar]
Gonzalez 1995 {published data only}
- Gonzalez MF, Garcia MC, Garcia BL, Garcia SA, Pajares JM, Moreno OR. Long‐term effect of interferon alpha alone or after prednisone withdrawal in chronic hepatitis B. Interim report and review of the literature. Hepatogastroenterology 1995;42(6):893‐9. [PubMed] [Google Scholar]
Guan 1995 {published data only}
- Guan R, Ho KY, Yap I, Kang JY, Tan CC, Ng C, et al. Treatment of hepatitis B surface antigen carriers in the early stage of the infection using recombinant alpha‐interferon with steroid priming. Alimentary Pharmacology & Therapeutics 1995;9(5):535‐40. [MEDLINE: ] [DOI] [PubMed] [Google Scholar]
Gómez 1996 {published data only}
- Gómez Camacho F, Poyato AG, Vignote MLA, Mata García M, et al. Comparison of two treatment strategies with prednisone and interferon in chronic Hepatitis B [[Comparación de dos esquemas de tratamiento con prednisona interferón en la hepatitis crónica por virus B]]. Revista Espanola de Enfermedades Digestivas 1996;88:185‐90. [PubMed] [Google Scholar]
Leung 1990 {published data only}
- Leung NWY, Lai CT, McGuire LJ, Tam JSL. Recombinant interferon alfa‐2b (INTRON A) treatment following prednisone withdrawal in chronic hepatitis B patients in Hong Kong ‐ a randomized controlled trial. Journal of Hepatology 1990;11 suppl 1:S170. [Google Scholar]
Liaw 1991 {published data only}
- Liaw YF, Sheen IS, Lin Shi‐Ming, Chen TJ. Prednisolone withdrawal followed by recombinant alfa‐interferon in chronic non‐A, non‐B hepatitis: An interim results of a randomized controlled trial. Gastroenterologia Japonica 1991;26 suppl 3:247‐50. [DOI] [PubMed] [Google Scholar]
Liaw 1993 {published data only}
- Liaw YF, Sheen IS, Lin SM, Chen TJ, Chu CM. Effects of prednisolone pretreatment in interferon alfa therapy for patients with chronic non‐A, non‐B (C) hepatitis. Liver 1993;13(1):46‐50. [DOI] [PubMed] [Google Scholar]
Lok 1988 {published data only}
- Lok AS, Lai CL, Wu PC, Leung EK. Long‐term follow‐up in a randomised controlled trial of recombinant alpha 2‐interferon in Chinese patients with chronic hepatitis B infection. Lancet 1988;2(8606):298‐302. [MEDLINE: ] [DOI] [PubMed] [Google Scholar]
Lok/Lai 1990 {published data only}
- Lok AS, Lai CL, Wu PC, Lau JY, Leung EK, Wong LS, et al. Alpha‐interferon treatment in Chinese patients with chronic hepatitis B. Journal of Hepatology 1990;11 Suppl 1:S121‐S125. [DOI] [PubMed] [Google Scholar]
Mannho 1996 {published data only}
- Mannho R, Raimundo M, Serejo F, Ramalho F, Velosa J, Moura MC. Prednisone in chronic hepatitis B, HBeAg positive patients. Hepatology. 24 1996; Vol. 24, issue 4:543.
Martin 1998 {published data only}
- Martin P, Hann HW, Westerberg S, Munoz SJ, Rubin R, Maddrey WC. Interferon‐alpha2b therapy is efficacious in Asian‐Americans with chronic hepatitis B infection: a prospective controlled trial. Digestive Diseases and Sciences 1998;43(4):875‐9. [DOI] [PubMed] [Google Scholar]
Monzon 1990 {published data only}
- Garcia‐Monzon C, Moreno‐Otero R, Garcia‐Buey L, Lopez‐Botet M, Landazuri MO, Sanchez‐Madrid F. Randomized controlled study of the efficacy and immunologic effects of a short course of prednisone followed by alpha‐interferon versus alpha‐interferon alone in the treament of chronic hepatitis B: preliminary results. Journal of Hepatology 1990;11 suppl 1:S168. [Google Scholar]
Niederau 1992 {published data only}
- Niederau C, Heintges T, Niederau M, Stremmel W, Strohmeyer G. Prospective randomized controlled trial of sequential treatment with corticoids and alpha‐interferon versus treatment with interferon alone in patients with chronic active hepatitis B. The European Journal of Medicine 1992;1(7):396‐402. [MEDLINE: ] [PubMed] [Google Scholar]
Omata 1985 {published data only}
- Omata M, Imazeki F, Yokosuka O, Ito Y, Uchiumi K, Mori J, et al. Recombinant leukocyte a interferon treatment in patients with chronic hepatitis B virus infection. Pharmacokinetics, tolerance, and biologic effects. Gastroenterology 1985;88(4):870‐80. [MEDLINE: ] [DOI] [PubMed] [Google Scholar]
Paul 1991 {published data only}
- Paul RG, Roodman ST, Campbell CR, Bodicky CJ, Perrillo RP. HLA class I antigen expression as a measure of response to antiviral therapy of chronic hepatitis B. Hepatology 1991;13(5):820‐5. [PubMed] [Google Scholar]
Perrillo 1988 {published data only}
- Perrillo RP, Regenstein FG, Peters MG, DeSchryver KK, Bodicky CJ, Campbell CR, et al. Prednisone withdrawal followed by recombinant alpha interferon in the treatment of chronic type B hepatitis. A randomized, controlled trial. Annals of Internal Medicine 1988;109(2):95‐100. [DOI] [PubMed] [Google Scholar]
Robson 1992 {published data only}
- Robson SC, Brice E, Rensburg C, Kannemeyer J, Hift RJ, Kirsch RE. Safety and efficacy of interferon alpha‐2b following prednisone withdrawal in the treatment of chronic viral hepatitis B. A case‐controlled, randomised study. South African Medical Journal 1992;82(5):317‐20. [PubMed] [Google Scholar]
Takano 1992 {published data only}
- Takano S, Omata M, Yokosuka O, Imazeki F, Ohto M. Effects of antiviral agents on chronic hepatitis B. Analysis using Cox proportional hazard model. Digestive Diseases and Sciences 1992;37(11):1633‐43. [DOI] [PubMed] [Google Scholar]
Tupasi 2002 {published data only}
- Tupasi TE, Co VM, Clarin MS, Alesna ET, Divinagracia EM, Mangubat NV. Randomized, double‐blind, placebo‐controlled trial of oromucosal low‐dose interferon following prednisone withdrawal for chronic hepatitis B infection in Filipino patients. International Journal of Infectious Diseases 2002;6(1):37‐41. [MEDLINE: ] [DOI] [PubMed] [Google Scholar]
Utili 1994 {published data only}
- Utili R, Sagnelli E, Gaeta GB, Galanti B, Nardiello S, Felaco FM, et al. Treatment of chronic hepatitis B in children with prednisone followed by alfa‐interferon: a controlled randomized study. Journal of Hepatology 1994;20(2):163‐7. [DOI] [PubMed] [Google Scholar]
- Utili R, Sagnelli E, Giusti G, Ruggiero G, Piccinino F, Galanti B, et al. Effect of prednisone priming followed by alfa‐interferon in treatment of children with chronic hepatitis B: an interim analysis of a controlled trial. Archives of Virology. Supplementum 1992;4:277‐80. [MEDLINE: ] [DOI] [PubMed] [Google Scholar]
Additional references
Brook 1989
- Brook GM, Chan, Yap I, Karayiannis P, Lever AML, Jacyna M, et al. Randomised controlled trial of lymphoblastoid interferon alfa in Europid men with chronic hepatitis B virus infection. BMJ 1989;299:652‐6. [MEDLINE: ] [DOI] [PMC free article] [PubMed] [Google Scholar]
Cohard 1994
- Cohard M, Poynard T, Mathurin P, Zarski JP. Prednisone‐interferon combination in the treatment of chronic hepatitis B: direct and indirect meta‐analysis. Hepatology 1994;20:1390‐8. [MEDLINE: ] [DOI] [PubMed] [Google Scholar]
Hoofnagle 1988
- Hoofnagle JH, Peters M, Mullen KD, Brian Jones D, Rustgi V, Bisceglie A, et al. Randomized, controlled trial of recombinant human alpha interferon in patients with chronic hepatitis B. Gastroenterology 1988;95:1318‐25. [MEDLINE: ] [DOI] [PubMed] [Google Scholar]
ICHGCP 1997
- Barnett International ‐ Clinical Training Group. Code of Federal Regualations & ICH Guidelines. Vol. 1, Parexel/Barnett, 1997. [Google Scholar]
Kjaergard 2001
- Kjaergard LL, Villumsen J, Gluud C. Reported methodologic quality and discrepancies between large and small randomized trials in meta‐analyses. Annals of Internal Medicine 2001;135:982‐9. [DOI] [PubMed] [Google Scholar]
Krogsgaard 1994
- Krogsgaard K, Bindslev N, Christensen E, Craxi A, Schlichting P, Schalm S, et al. The treatment effect of alpha interferon in chronic hepatitis B is independent of pre‐treatment variables. Results of a meta‐analysis of individual patient data. Journal of Hepatology 1994;21:646‐55. [MEDLINE: ] [DOI] [PubMed] [Google Scholar]
Lok 2000
- Lok ASF. Hepatitis B infection: pathogenesis and management. Journal of Hepatology 2000;32(Suppl):89‐97. [DOI] [PubMed] [Google Scholar]
Lok 2001
- Lok ASF, McMahon BJ. Chronic hepatitis B. Hepatology 2001;34(6):1225‐41. [DOI] [PubMed] [Google Scholar]
Merican 2000
- Merican I. Treatment of chronic hepatitis B virus infection in special groups of patients: decompensated cirrhosis, immunosuppressed and paediatric patients. Journal of Gastroenterology and Hepatology 2000;15(Suppl):E71‐E78. [DOI] [PubMed] [Google Scholar]
Moher 1998
- Moher D, Pham B, Jones A, Cook DJ, Jadad AR, Moher M, et al. Does quality of reports of randomised trials affect estimates of intervention efficacy reported in meta‐analyses?. Lancet 1998;352(9128):609‐13. [MEDLINE: ] [DOI] [PubMed] [Google Scholar]
Müller 1981
- Müller R, Vido I, Schmidt FW. Rapid withdrawal of immunosuppressive therapy in chronic active hepatitis B infection. Lancet 1981;1:1323‐4. [MEDLINE: ] [DOI] [PubMed] [Google Scholar]
Nair 1986
- Nair PV, Tong MJ, Stevenson D, Roskamp D, Boone C. A pilot study on the effects of prednisone withdrawal on serum hepatitis B virus DNA and HBeAg in chronic active hepatitis B. Hepatology 1986;6:1319‐24. [MEDLINE: ] [DOI] [PubMed] [Google Scholar]
Saracco 1989
- Saracco G, Mazzella G, Rosina F, Cancellieri C, Lattore V, Raise E, et al. A controlled trial of human lymphoblastoid interferon in chronic hepatitis B in Italy. Hepatology 1989;10:336‐41. [MEDLINE: ] [DOI] [PubMed] [Google Scholar]
Schultz 1995
- Schultz KF, Chalmers I, Hayes RJ, Altman DG. Empirical evidence of methodological quality associated with estimates of treatment effects in controlled trials. JAMA 1995;273:408‐12. [DOI] [PubMed] [Google Scholar]
Schulz 1994
- Schulz KF, Chalmers I, Grimes DA, Altman DG. Assessing the quality of randomization from reports of controlled trials published in obstetrics and gynecology journals. JAMA 1994;272(2):125‐8. [MEDLINE: ] [PubMed] [Google Scholar]
Scullard 1979
- Scullard GH, Robinson WS, Merigan TC, Gregory PB. Effect of immunosuppressive therapy on hepatitis B viral infection in patients with chronic hepatitis. Gastroenterology 1979;77:A40. [PubMed] [Google Scholar]
Vickers 1998
- Vickers A, Goyal N, Harland R, Rees R. Do certain countries produce only positive results? A systematic review of controlled trials. Controlled Clinical Trials 1998;19(2):159‐66. [MEDLINE: ] [DOI] [PubMed] [Google Scholar]
Weller 1982
- Weller IV, Bassendine MF, Murray AK, Craxi A, Thomas HC, Sherlock S. Effects of prednisolone/azathioprine in chronic hepatitis B viral infection. Gut 1982;23:650‐5. [MEDLINE: ] [DOI] [PMC free article] [PubMed] [Google Scholar]
Wong 1993
- Wong DK, Cheung AM, O'Rourke K, Naylor CD, Detsky AS, Heathcote J. Effect of alpha‐interferon treatment in patients with hepatitis B e antigen‐positive chronic hepatitis B. A meta‐analysis. Annals of Internal Medicine 1993;119:312‐23. [MEDLINE: ] [DOI] [PubMed] [Google Scholar]
References to other published versions of this review
Krogsgaard 1997
- Krogsgaard K, Zarski JP, Mathurin P, Poynard T. Sequential combination of glucocorticosteroids and alfa interferon versus alfa interferon alone for chronic hepatitis B [Cochrane Protocol]. The Cochrane Library 1997, Issue 3. [Google Scholar]