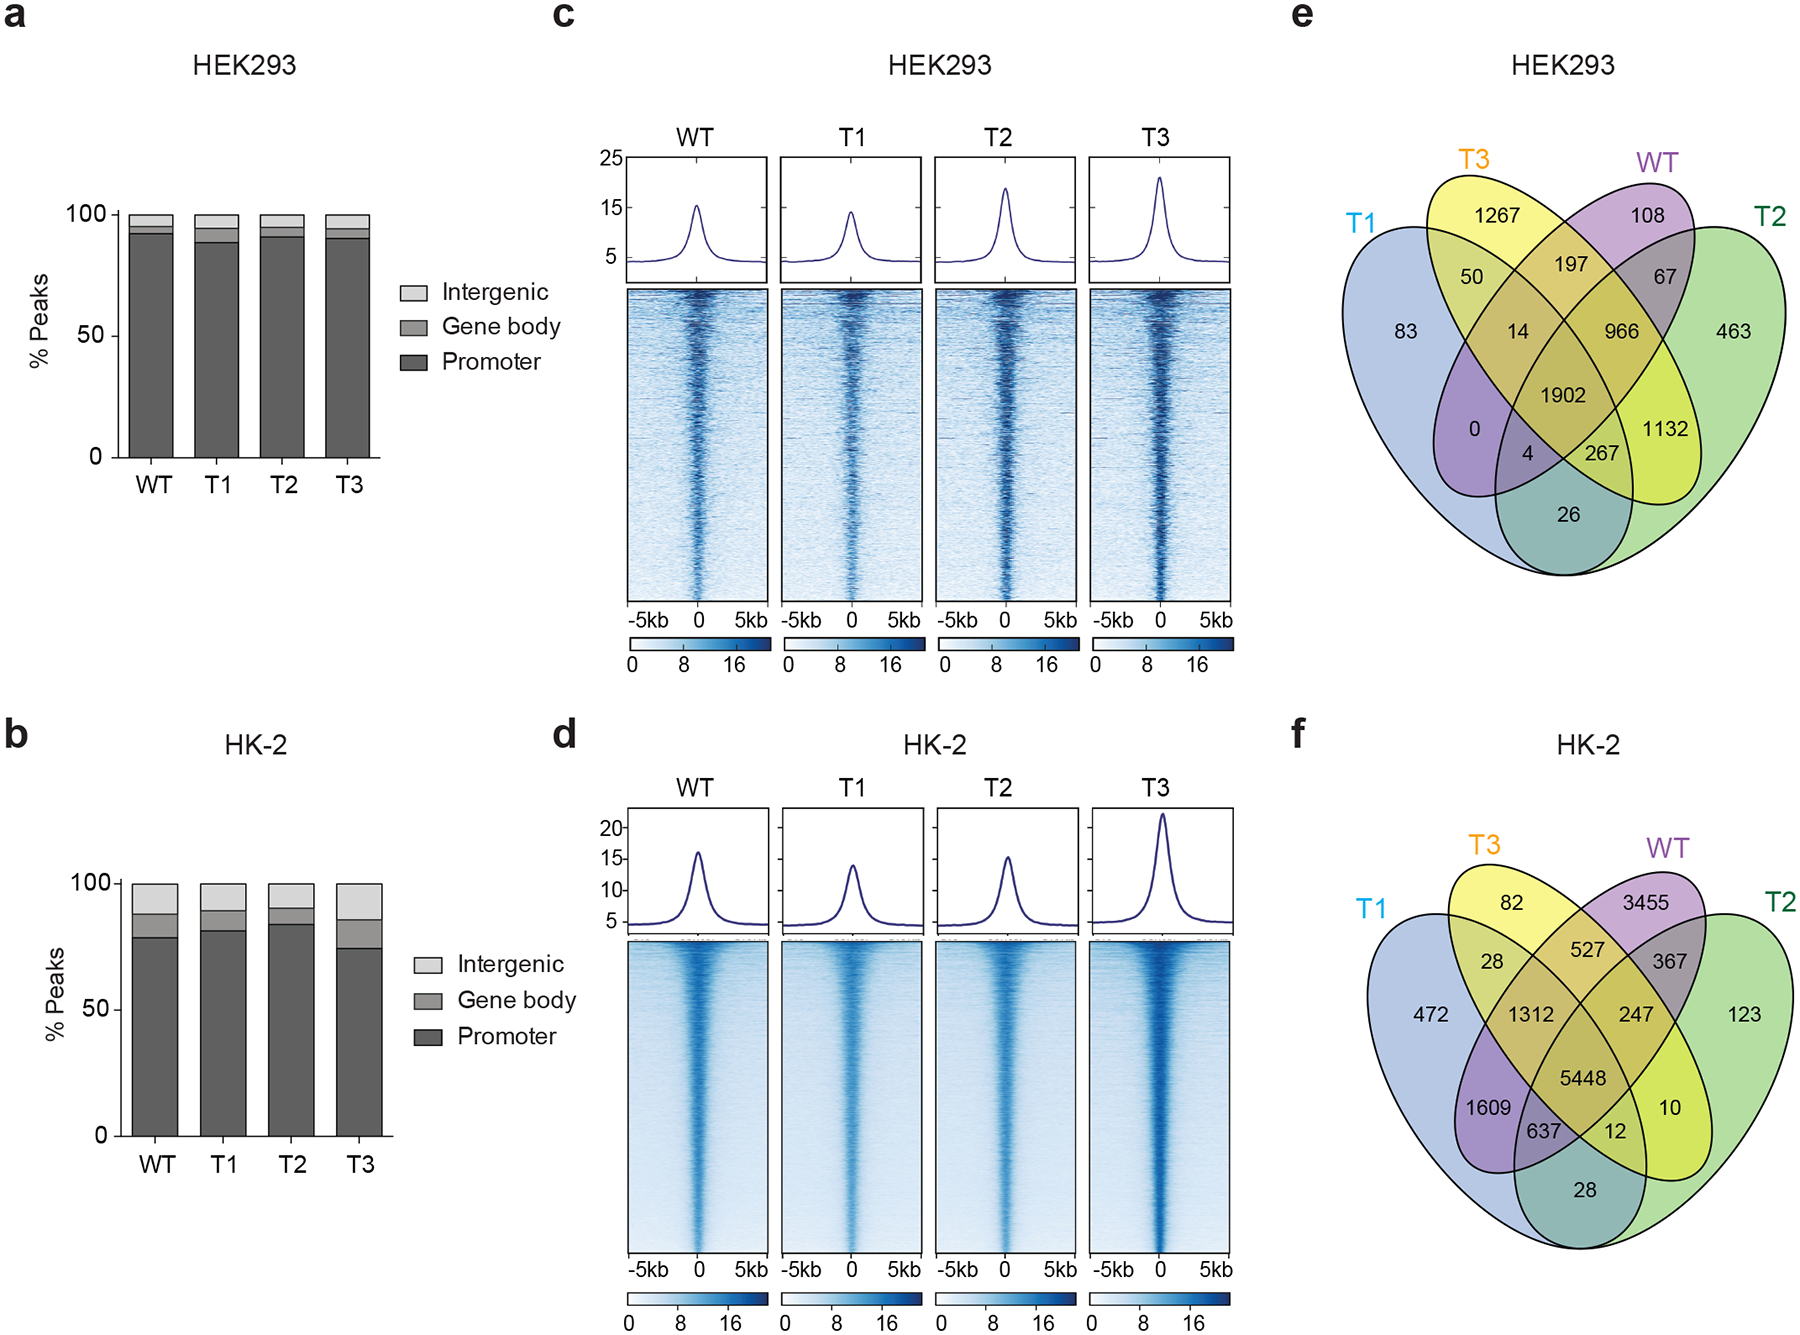
Extended Data Fig. 4 |. ENL mutants occupy largely the same genomic loci as the wild-type protein.

a, b, Bar graphs showing the genomic distribution of Flag–ENL-bound peaks in HEK293 (a) and HK-2 (b) cells. c, d, Heat maps of normalized WT or mutant Flag–ENL ChIP–seq signals in HEK293 (c) and HK-2 (d) cells, centred on ENL-bound peaks across a ±5-kb window. The colour key represents the signal density, with darker colour representing more signal. More details are in Supplementary Tables 4, 5. e, f, Venn diagrams showing the overlap of WT or mutant ENL-bound peaks in HEK293 (e) and HK-2 (f) cells.
