

SUMMARY
Tumor-infiltrating T cells often lose their effector function; however, the mechanisms are incompletely understood. We report that cholesterol in the tumor microenvironment induces CD8+ T-cell expression of immune checkpoints and exhaustion. Tumor tissues enriched with cholesterol and cholesterol content in tumor-infiltrating CD8+ T cells was positively and progressively associated with upregulated T-cell expression of PD-1, 2B4, TIM-3, and LAG-3. Adoptively transferred CD8+ T cells acquired cholesterol, expressed high levels of immune checkpoints, and became exhausted upon entering tumor. Tumor-culture supernatant or cholesterol induced immune checkpoint expression by increasing endoplasmic reticulum (ER) stress in CD8+ T cells. Consequently, the ER-stress sensor XBP1 was activated and regulated PD-1 and 2B4 transcription. Inhibiting XBP1 or reducing cholesterol in CD8+ T cells effectively restored antitumor activity. This study reveals a novel mechanism underlying T cell exhaustion and suggests a new strategy for restoring T cell function by reducing cholesterol to enhance T-cell based immunotherapy.
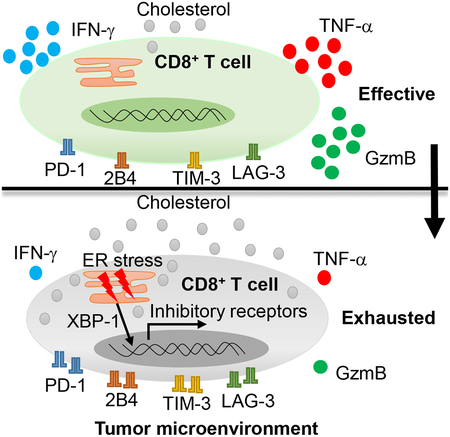
Graphical Abstract
eTOC blurb
Tumor-infiltrating T cells often lose their effector function. Ma et al. show that cholesterol in the tumor microenvironment induces CD8+ T-cell exhaustion in an ER-stress-XBP1 dependent manner. Reducing cholesterol or ER stress enhanced CD8+ T-cell anti-tumor function, highlighting therapeutic avenues to improve T-cell based immunotherapy in the clinic.
INTRODUCTION
Tumor-infiltrating CD8+ T cells are associated with progressive loss of effector function due to prolonged antigen exposure and a suppressive tumor microenvironment (Wherry, 2011). The dysfunctional state of CD8+ T cells is known as exhaustion, and exhausted CD8+ T cells have high expression of inhibitory receptors such as PD-1, LAG-3, TIM-3, 2B4, and CTLA-4 (Wherry, 2011). Unprecedented clinical success in a variety of cancers has been achieved by using antibodies to target immune checkpoints on CD8+ T cells, particularly PD-1 antibodies (Callahan et al., 2016; Ribas and Wolchok, 2018). However, the limited response rate, toxicities, and potential for relapse (Callahan et al., 2016; Dyck and Mills, 2017) emphasize the importance of elucidating mechanisms underlying the regulation of immune checkpoint expression and identifying new strategies to target immune checkpoints.
Genetic and epigenetic mechanisms have been reported to regulate immune checkpoint expression. T-cell receptor activation (Boussiotis, 2016), a myriad of transcription factors, such as STAT3, STAT4, NFATc1, T-bet, and Blimp-1 (Austin et al., 2014; Kao et al., 2011; Lu et al., 2014a) and epigenetic components, including DNA methylation and histone modification (Bally et al., 2016; Stephen et al., 2017) were reported to regulate PD-1 expression. Moreover, T-bet, AP-1, and c-Jun were reported to regulate the expression of TIM-3 (Anderson et al., 2010; Yun et al., 2016). While these findings are important for understanding how expression of T-cell exhaustion-associated immune checkpoints is regulated, factors produced in the immunosuppressive tumor microenvironment that are also involved in the development and maintenance of T-cell exhaustion are of increasing interest as targets of immunometabolic therapy. The tumor microenvironment has unique metabolic restrictions that regulate immune function (McKinney and Smith, 2018; Park et al., 2016). Transforming growth factor-β, a regulatory component of the tumor microenvironment, enhances PD-1 expression on T cells in cancer (Park et al., 2016). VEGF-A, a proangiogenic molecule that tumor cells produce, modulates expression of immune checkpoint molecules, such as PD-1 and TIM-3, on CD8+ T cells in tumors (Voron et al., 2015). In addition, tumor-repopulating cells can induce PD-1 expression on CD8+ T cells by secreting kynurenine (Liu et al., 2018). Whether other mechanisms exist that induce PD-1 expression remains unknown.
Cholesterol is a key component of both membrane lipids and the plasma compartment (Dessi et al., 1994). Cholesterol functions in the antitumor response of T cells and is also associated with breast cancer metastasis and recurrence (Baek et al., 2017; Yang et al., 2016). Our early study showed that IL-9-producing CD8+ T (Tc9) cells exhibit a less exhausted phenotype with superior antitumor function compared with Tc1 cells (Lu et al., 2014b), and cholesterol dampened the Tc9 antitumor function(Ma et al., 2018). However, little is known about the role of cholesterol in the metabolic regulation of T-cell exhaustion and the expression of the related checkpoints. In this study, we showed that cholesterol is enriched in the tumor microenvironment and induces CD8+ T-cell expression of checkpoints and CD8+ T-cell exhaustion.
RESULTS
Expression of immune checkpoints and CD8+ T-cell exhaustion are associated with cholesterol accumulation in the tumor microenvironment
We have been studying lipid metabolism in T-cell function (Ma et al., 2018). Here, when we stained tumor-infiltrating T cells in a murine melanoma model, we discovered that the immune checkpoints expression level on CD8+ T cells positively correlated with total cholesterol content in the cells. In lung B16 tumor-infiltrating CD8+ T cells, the PD-1high2B4high CD8+ T cells had significantly higher cholesterol content than PD-1med2B4med CD8+ T cells, and the PD-1med2B4med CD8+ T cells had significantly higher cholesterol content than PD-1low2B4low CD8+ T cells (Figure 1A). In lymph node (Figure 1B) and spleen (Figure 1C), the PD-1high2B4high CD8+ T cells also had significantly higher cholesterol content than PD-1low2B4low cells, although the cholesterol content of spleen and lymph node T cells was significantly lower than that of tumor-infiltrating CD8+ T cells (Figure 1 A–C). Furthermore, the expression of LAG-3 (Figure 1D) and TIM-3 (Figure 1E) on CD8+ T cells was also positively correlated with PD-1 and 2B4 expression.
Figure 1. The expression of CD8+ T-cell immune checkpoints is positively associated with increasing cholesterol accumulation.

(A-C) B6 mice were injected i.v. with 1 × 10⁵ B16 cells. Tumor-infiltrating (A), lymph node (B) and spleen (C) CD8+ T cells were analyzed for PD-1 and 2B4 expression and for cholesterol content on day 16 after tumor transfer. (D-F) B6 mice were injected i.v. with 1 × 10⁵ B16 cells. Tumor-infiltrating CD8+ T cells were analyzed for the expression of PD-1, 2B4 and LAG-3 (D), TIM-3 (E), and annexin V (F) on day 16 after tumor transfer. (G and H) B6 mice were injected s.c. with 1 × 10⁶ LL2 cells (G) or 5× 10⁶ MC38 cells (H). Tumor-infiltrating CD8+ T cells were analyzed for PD-1 and 2B4 expression, and for cholesterol level on day 10 after tumor transfer. Experiments were performed with at least three biological replicates and are representative of at least three independent experiments. (I and J) Patient colon cancer (I) and myeloma (J) patient tumor-infiltrating CD8+ T cells were analyzed for PD-1 and 2B4 expression and cholesterol level. Data shown are for 1 representative patient each of 4 colon cancer patients (I) and 5 myeloma patients (J). Data are presented as mean ± SEM. *p < 0.05; **p < 0.01; ***p < 0.001.
To confirm that the T cells were functionally exhausted, we sorted the cells out and analyzed apoptosis, cytotoxicity, and proliferation. As expected, the PD-1high2B4high CD8+ T cells were the most exhausted because they had the highest apoptosis rate as compared with PD-1med2B4med and PD-1low2B4low CD8+ T cells (Figure 1F); they also displayed lower cytotoxicity (Figure S1A) and proliferated at a rate similar to PD-1med2B4med T cells (Figure S1B). We also compared the expression of activation markers on these cells. Compared with splenic CD8+ cells, tumor-infiltrating CD8+ cells had lower CD62L expression (Figure S1C, left panel) but higher expression of CD25, CD44 and CD69 (Figure S1D–S1F, left panel). In the tumor-infiltrating CD8+ T cells, CD62L expression did not differ among these populations (Figure S1C, right panel). However, the expression of CD25, CD44, and CD69 progressively increased from PD-1low2B4low to PD-1high2B4high CD8+ T cells (Figure S1D–S1F, right panel). These results suggest a higher activation status for tumor-infiltrating CD8+ T cells as compared with splenic T cells, and for PD-1high2B4high CD8+ T cells in comparison with PD-1low2B4low CD8+ T cells.
To confirm the above findings, we examined CD8+ T cells from the subcutaneous B16 tumor model. Cholesterol content was consistently elevated along with increased expression of PD-1 and 2B4 on tumor-infiltrating (Figure S2A), lymph node (Figure S2B), and spleen (Figure S2C) CD8+ T cells. Similar results were also obtained for two other subcutaneously (s.c.) grown tumor models, LL2 (Figure 1G) and MC38 (Figure 1H).
To determine whether these findings are relevant to human cancers, colon cancer and myeloma patient samples were obtained and analyzed. As we did for the tumor models, we stained human CD8+ T cells for PD-1 and 2B4 expression and categorized them into PD-1low2B4low, PD-1med2B4med and PD-1high2B4high CD8+ T cell populations (Figure 1I and 1J). In colon cancer tissues or myeloma bone marrow, cholesterol accumulation increased as PD-1 and 2B4 expression also increased on CD8+ T cells (Figure 1I, 1J, Figure S3A–S3C). Again, the PD-1high2B4high population of human tumor-infiltrating CD8+ T cells had the highest apoptosis rate in both colon cancer (Figure S3D) and myeloma (Figure S3E and S3F) patient samples, suggesting that they are the most exhausted T-cell population among the three populations.
Taken together, these results suggest that cholesterol content in tumor-infiltrating CD8+ T cells may contribute to their exhaustion phenotype and function in the tumor microenvironment.
CD8+ T cells accumulate cholesterol and become exhausted after homing to the tumor bed
As immune checkpoint expression level and cholesterol accumulation are progressively and positively related in CD8+ T cells, we used an adoptive T-cell transfer model to explore whether the immune checkpoint expression on and cholesterol accumulation in CD8+ T cells change after they home to the tumor bed. First, phenotype of transferred Pmel-1 CD8+ T cells from B16 metastatic lung tumor model was analyzed. In tumor, cholesterol content and PD-1 and 2B4 expression in the transferred Pmel-1 CD8+ T cells were all significantly greater as compared with the T cells in spleen and lymph node tissue (Figure 2A–2C). Moreover, tumor-infiltrating transferred CD8+ T cells underwent apoptosis in greater numbers as compared with splenic T cells (Figure S4A). Consistently, in the tumor-infiltrating, transferred CD8+ T cells, the cholesterol content increased as did expression of PD-1 and 2B4 (Figure S4B) and apoptosis (Figure S4C). To confirm the results, we used s.c. grown B16 (Figure 2D–2F) and MC38 (Figure 2G–2I) tumor models. In both tumor models, tumor-infiltrating, transferred CD8+ T cells showed significantly increased PD-1 and 2B4 expression and higher cholesterol content as compared with the T cells in spleen and draining lymph nodes (Figure 2D–2I). We also collected and examined human colon tumors and the adjacent normal tissues from colon cancer patients to determine the significance of these findings. Consistent with the mouse results, the expression of PD-1 and 2B4 as well as cholesterol content in tumor-infiltrating human CD8+ T cells was significantly higher than in CD8+ T cells from adjacent normal tissues (Figure 2J). Taken together, these results indicate that tumor-specific CD8+ T cells, after homing to tumors, take up and accumulate cholesterol and become exhausted T cells that have increased expression of immune checkpoints.
Figure 2. CD8+ T-cell immune checkpoint expression and cholesterol accumulation are increased upon entry into the tumor microenvironment.

Splenocytes from Pmel-1 mice were differentiated in vitro for 5 days in the presence of hgp10025–33 peptide (1 mg/ml) and IL-2 (10 ng/ml). (A-C) B6 mice were injected i.v. with 1 × 10⁵ B16 cells. At day 12 after tumor inoculation, 2 × 10⁶ CD8+ Pmel-1 T cells were i.v. transferred into the tumor-bearing mice. At day 16, Pmel-1 CD8+ T cells in tumor, draining lymph nodes (DLN), and spleen were analyzed for cholesterol level (A) and PD-1 (B) and 2B4 (C) expression. (D-F) B6 mice were injected s.c. with 1 × 10⁶ B16 cells. At day 12 after tumor inoculation, 2 × 10⁶ CD8+ Pmel-1 T cells were i.v. transferred into the tumor-bearing mice. At day 16, Pmel-1 CD8+ T cells in tumor, draining lymph nodes (DLN), and spleen were analyzed for cholesterol level (D) or PD-1 (E) and 2B4 (F) expression. (G-I) B6 mice were injected s.c. with 5 × 10⁶ MC38-hgp100 tumor cells. At day 12 after tumor inoculation, 2 × 10⁶ Pmel-1 CD8+ T cells were i.v. transferred into tumor-bearing mice. At day 16, CD8+ Pmel-1 T cells in tumor, draining lymph nodes (DLN), and spleen were analyzed for cholesterol level (G) or PD-1 (H) and 2B4 (I) expression. Experiments were performed with at least three biological replicates and are representative of at least two independent experiments. (J) Human colon cancer tissues and the adjacent normal tissues were analyzed for PD-1 and 2B4 expression and cholesterol level. Data shown are 1 representative patient of 2 colon cancer patients. Data are presented as mean ± SEM. *p < 0.05; **p < 0.01; ***p < 0.001.
Tumor tissues have a high cholesterol content that induces T-cell exhaustion
To determine why tumor-infiltrating CD8+ T cells have a higher cholesterol content and upregulated expression of inhibitory receptors compared with T cells in normal tissues, we examined cholesterol content in tumor and normal tissues. In the B16 metastatic lung tumor model, metastatic lung tissue had much a higher cholesterol content compared with normal lung, spleen, and lymph node tissue (Figure 3A). Similar results were obtained in the subcutaneous B16, LL2 and MC38 tumor models (Figure 3A), indicating that tumor tissues are enriched with cholesterol. Next, we determined whether the high tumor cholesterol content induces T-cell exhaustion by upregulating immune checkpoint expression in tumor-infiltrating T cells. Similar to tumor-infiltrating T cells, CD8+ T cells cultured in vitro under standard conditions can also be separated into PD-1low2B4low, PD-1med2B4med and PD-1high2B4high populations and have different cholesterol content levels (Figure S4D) and apoptosis rates (Figure S4E). Culture of CD8+ T cells with the addition of tumor-culture supernatant significantly upregulated PD-1 and 2B4 expression on the T cells (Figure 3B). Adding β-cyclodextrin, which is used to reduce cholesterol content (Yang et al., 2016), to the culture abrogated the effects of the tumor-culture supernatant on the T cells (Figure 3B), indicating that cholesterol in tumor-culture supernatant was responsible for the upregulated expression of the immune checkpoints. Therefore, we next directly examined the effect of cholesterol on immune checkpoint expression on CD8+ T cells and found that cholesterol, in a dose-dependent manner, increased the expression of both PD-1 and 2B4 on CD8+ T cells (Figure 3C and 3D). CD8+ T-cell apoptosis was also increased after cholesterol treatment (Figure S4F). Longer exposure to cholesterol could further induce a much higher PD-1 and 2B4 expression (Figure S4G). Cholesterol also upregulated Pdcd1 mRNA expression in a dose-dependent manner (Figure 3E), suggesting that cholesterol upregulates PD-1 expression at the transcriptional level. We next determined whether cholesterol could induce CD8+ T-cell functional exhaustion. We observed that cholesterol, in a dose-dependent manner, decreased Gzmb, IFN-γ, and TNF-α production in CD8+ T cells (Figure 3F), and also decreased CD8+ T-cell proliferation (Figure S4H). Cholesterol-induced increase in PD-1 and decrease in Ki67 and IFN-γ expressions were irreversible (Figure S4I). Cholesterol treatment slightly decreased the migratory ability of CD8+ T cells (Figure S4J). In addition, we confirmed that cholesterol induced apoptosis in the T cells by cleaved caspase 3 staining (Figure S4K) and increased CD8+ T-cell cholesterol content (Figure S4L), and showed that cholesterol decreased oxygen consumption rate and glycolysis rate in CD8+ T cells (Figure S4M). Analysis of exhaustion-related gene expression profile also verified that cholesterol induced an exhausted phenotype in CD8+ T cells (Figure S4N). More importantly, cholesterol upregulated PD-1 and 2B4 expression on human CD8+ T cells (Figure 3G). Altogether, these results indicate that cholesterol is enriched in tumor tissues and induces T-cell exhaustion by upregulating the expression of immune checkpoints on CD8+ T cells.
Figure 3. Cholesterol within the tumor tissues induces CD8+ T-cell immune checkpoint expression.

(A) Cholesterol content of tumor, spleen and lymph node was measured in four different tumor models: lung metastatic B16, s.c. grown B16, s.c. grown LL2, and s.c. grown MC38 tumor models. Experiments were performed with at least 10 biological replicates and are representative of at least 2 independent experiments. (B) Splenocytes from Pmel-1 mice were differentiated in vitro for 5 days in the presence of hgp10025–33 (1 mg/ml) and IL-2 (10 ng/ml). Tumor supernatant (1 mg tumor in 1 ml T-cell culture medium, filtered) was from s.c. grown B16 tumor. CD8+ T cells were cultured with control T-cell culture medium or with 100 ml tumor supernatant without or with β-cyclodextrin (β-CD, 0.5 mM) as indicated, and expression of PD-1 and 2B4 on the cultured T cells was determined. (C) Splenocytes from Pmel-1 mice were in vitro-differentiated for 5 days in the presence of hgp10025–33 (1 mg/ml) and IL-2 (10 ng/ml). Cholesterol was added to the cultures at the indicated concentrations. T-cell expression of PD-1 and 2B4 was determined 5 days later. (D) Pmel-1 CD8+ T cells were isolated and in vitro stimulated with CD3/CD28 antibodies in the presence of IL-2. Cholesterol was added to the cultures at the indicated concentrations. T-cell expression of PD-1 and 2B4 was examined on day 5. (E) Quantitative RT-PCR analysis of Pdcd1 expression in CD8+ T cells treated with cholesterol as indicated. (F) Pmel-1 CD8+ T cells were in vitro stimulated with CD3/CD28 antibodies in the presence of IL-2 and soluble CD3/CD28 antibodies. Cholesterol was added to the culture at indicated concentrations. T-cell production of Gzmb, IFN-γ, or TNF-α were examined on day 8 by flow. (G) Human CD8+ T cells were isolated from peripheral blood mononuclear cells and in vitro-stimulated with CD3/CD28 beads in the presence of IL-2. Cholesterol was added to the cultures at different concentrations as indicated. T-cell expression of PD-1 and 2B4 was examined on day 12. Experiments were performed with at least three biological replicates, and data shown are representative of at least three independent experiments. Data are presented as mean ± SEM. *p < 0.05; **p < 0.01; ***p < 0.001.
Cholesterol disrupts lipid metabolism and increases ER stress in CD8+ T cells
To elucidate the mechanism underlying cholesterol-induced T-cell exhaustion and immune checkpoint expression, we performed microarray analysis of CD8+ T cells under different cholesterol treatment conditions. In vitro-differentiated CD8+ T cells treated with cholesterol showed a broad change in lipid metabolism-related genes (Figure 4A) and lipid metabolism-associated signaling pathways; e.g., the zymosterol biosynthesis pathway was downregulated, the bile acid biosynthesis pathway was activated, and the adipogenesis pathway was altered (Figure 4B). However, upregulation was greatest in the ER stress-response genes (Figure 4C). In line with this result, Ingenuity Pathway Analysis (IPA) showed that the ER stress signaling pathway was highly activated in cholesterol-treated CD8+ T cells as compared with control CD8+ T cells (Figure 4D). Among these ER stress-response genes with altered activity, XBP1, which is a member of the highly conserved ER stress-response pathway (Cubillos-Ruiz et al., 2015; Tang et al., 2014) and a transcription factor that regulates expression of various target gene sets (Cubillos-Ruiz et al., 2015), was highly upregulated in cholesterol-treated CD8+ T cells (Figure 4C and 4D). Figure 4E shows XBP1-associated genes in CD8+ T cells and their response to cholesterol. To confirm the microarray results, we examined the mRNA expression of XBP1 and XBP1s (spliced form of XBP1) in CD8+ T cells treated with or without cholesterol. Consistently, cholesterol treatment strongly upregulated the mRNA expression of both XBP1 and XBP1s (Figure 4F). Western blot confirmed the results at the protein level (Figure 4G). Thus, these results indicate that cholesterol disrupts lipid metabolism and increases ER stress in CD8+ T cells, leading to upregulated expression of the ER-stress sensor XBP1 in T cells.
Figure 4. Cholesterol disrupts lipid metabolism and increases ER stress in CD8+ T cells.

(A and B) Pmel-1 CD8+ T cells were isolated and stimulated in vitro with CD3/CD28 antibodies in the presence of IL-2. Cholesterol was added to the cultures at different concentrations as indicated at the top of the heat map in (A). Shown are microarray analysis (heat maps) of lipid metabolism-related gene expression (A) and IPA analysis (B) of lipid metabolism-related pathway changes in these CD8+ T cells. (C-E) CD8+ T cells were isolated and in vitro-stimulated with CD3/CD28 antibodies in the presence of IL-2 and cholesterol at the indicated concentrations. Shown are microarray analysis (heat map) of ER stress-related gene expression in these CD8+ T cells (C); IPA analysis of ER stress-signaling pathway in CD8+ treated without or with 0.75 μg/ml cholesterol (D); and IPA analysis of Xbp1-related interaction gene expression (E). In E, red circles indicate ER-stress signaling genes. Data are representative of at least 2 independent experiments. (F) Quantitative RT-PCR analysis of Xbp1 and Xbp1s expression in in vitro-differentiated CD8+ T cells with indicated cholesterol treatments. (G) Western blot analysis of XBP1s and XBP1u expression in in vitro-differentiated CD8+ T cells with indicated cholesterol treatments. (H) Flow cytometry analysis of PD-1, 2B4 and XBP1s expression in lung B16 tumor-infiltrating and spleen CD8+ T cells. Experiments were performed with at least three biological replicates, and data shown are representative of at least two independent experiments. Data are presented as mean ± SEM. *p < 0.05; **p < 0.01; ***p < 0.001.
Because cholesterol upregulated the expression of the immune checkpoints and XBP1 in CD8+ T cells, we then determined whether XBP1 expression directly correlates with immune checkpoint expression in the cells in vivo. In both tumor-infiltrating and splenic CD8+ T cells, the PD-1high2B4high CD8+ T cells had significantly higher XBP1 expression than PD-1med2B4med cells, and the PD-1med2B4med cells had significantly higher XBP1 expression than PD-1low2B4low cells (Figure 4H). XBP1 expression increased in parallel to upregulated expression of the immune checkpoints on the cells. However, cholesterol treatment did not significantly affect the expression of PD-1 or PD-L1 regulators (Figure S5A). These results suggest that the cholesterol-induced ER-stress sensor XBP1 may be involved in the expression of the immune checkpoints and exhaustion of CD8+ T cells.
Cholesterol-induced XBP1 regulates the expression of the T-cell inhibitory receptors
To determine whether cholesterol-induced ER-stress sensor XBP1 regulates the expression of the T-cell inhibitory receptors, we first used the ER-stress inhibitor STF-083010 (STF) to treat T cells. As shown in Figure 5A, cholesterol upregulated PD-1 expression on CD8+ T cells, and STF, in a dose-dependent manner, inhibited this cholesterol-induced PD-1 expression. STF also reversed the effect of cholesterol on 2B4 expression (Figure S5B). Second, we determined whether the ER-stress sensor XBP1 regulates the increased expression of the inhibitory receptors on T cells. Knocking down (KD) XBP1s significantly downregulated Pdcd1 mRNA expression in CD8+ T cells (Figure 5B), suggesting that XBP1 has a transactivation function on Pdcd1 expression. Cholesterol upregulated PD-1 mRNA (Figure 5B) and protein (Figure 5C) expression in control but not in XBP1s-KD CD8+ T cells, indicating that XBP1 is an important regulator in cholesterol-induced CD8+ T-cell exhaustion. Furthermore, we transferred control or XBP1s-KD Pmel-1 CD8+ T cells into lung B16 tumor-bearing mice, and examined, 1 week later, the expression of PD-1 and 2B4 on transferred CD8+ T cells. In both peripheral blood (Figure 5D) and tumor bed (Figure 5E), the transferred control CD8+ T cells expressed higher levels of PD-1 and 2B4 as compared with XBP1s-KD CD8+ T cells, which confirmed our in vitro data that suggest XBP1 is an important regulator in cholesterol-induced CD8+ T-cell expression of the inhibitory receptors and T-cell exhaustion.
Figure 5. Expression of the cholesterol-induced ER-stress sensor XBP1 is required for CD8+ T-cell immune checkpoint expression.

(A) Flow cytometry analysis of PD-1 expression on in vitro differentiated CD8+ T cells treated with cholesterol or the ER stress inhibitor, STF (STF-083010). (B and C) Quantitative RT-PCR (B) and flow cytometry (C) analysis of PD-1 expression on in vitro-differentiated CD8+ T cells treated with cholesterol or shRNA transfection to knock down XBP1s. Control shRNA was used as vector control. Experiments were performed with at least three biological replicates and are representative of at least three independent experiments. (D and E) In vitro-differentiated Pmel-1-derived CD8+ T cells were transfected with XBP1s shRNA and then injected i.v. into 10-day lung B16 tumor-bearing mice. One week later, blood (D) and lung tumor (E) were collected and examined for PD-1 and 2B4 expression on transferred Pmel-1 CD8+ T cells. Pmel-1 CD8+ T cells treated with control shRNA was used as control. (F) Predicted binding sites of XBP1 on the Pdcd1 and 2b4 promoters. (G) ChIP analysis of XBP1 binding to the Pdcd1 promoter under indicated cholesterol treatments. (H) Dual luciferase analysis of the impact of XBP1 and XBP1s overexpression on the Pdcd1 promoter in 293T cells. (I) Dual luciferase analysis of the impact of XBP1s overexpression on the CD244 promoter in 293T cells. (J-L) In vitro-differentiated Pmel-1-derived CD8+ T cells were transfected with XBP1s virus to overexpress XBP1s. Cells were cultured in the presence of soluble CD3/CD28 antibodies and IL-2. T-cell expression of PD-1, 2B4, TIM-3, and LAG-3, and production of Gzmb and IFN-γ were examined on day 8 by flow. (M) In vitro-differentiated Pmel-1-derived CD8+ T cells were transfected with XBP1s virus to overexpress XBP1s and then injected i.v. into lung B16 tumor-bearing mice. One week later, lung tumor was collected, and the expression of PD-1 and 2B4 expression on transferred CD8+ T cells was examined. Pmel-1 CD8+ T cells treated with control virus was used as control. Experiments were performed with at least three biological replicates, and data shown are representative of at least two independent experiments. Data are presented as mean ± SEM. *p < 0.05; **p < 0.01; ***p < 0.001.
We then investigated how XBP1 regulates expression of the inhibitory receptors in CD8+ T cells. As XBP1 is a transcription factor (Cubillos-Ruiz et al., 2015), we analyzed the Pdcd1 and CD244 (2B4 gene) promoters and identified potential binding sites for XBP1 (Figure 5F) on them. To determine whether XBP1 binds to the Pdcd1 promoter in response to cholesterol treatment, a ChIP assay was performed. Cholesterol-treated CD8+ T cells had increased binding of XBP1 on the Pdcd1 promoter compared with control CD8+ T cells (Figure 5G). Furthermore, a luciferase reporter assay showed that both XBP1u (unspliced form of XBP1) and XBP1s activated Pdcd1 gene transcription (Figure 5H). XBP1s also activated CD244 gene transcription (Figure 5I). To confirm the results at cellular level, we examined the effect of XBP1-overexpression in CD8+ T cells. XBP1-overexpressing CD8+ T cells had increased PD-1, 2B4, TIM-3, and LAG-3 expression (Figure 5J and 5K), decreased IFN-γ and Gzmb expression (Figure 5L), decreased proliferation (Figure S5C), and increased apoptosis (Figure S5D).
Moreover, control or XBP1-overexpressing CD8+ T cells were transferred into lung B16 tumor-bearing mice and, 1 week later, the expression of PD-1 and 2B4 on transferred CD8+ T cells was examined. As shown in Figure 5M, transferred CD8+ T cells overexpressing XBP1 had significantly higher levels of PD-1 and 2B4 as compared with control CD8+ T cells. Similarly, we found that XBP1-deficient CD4+ T cells exhibited a less exhausted phenotype as compared with control CD4+ T cells (Figure S5E; data from GSE118430). Thus, these results indicate that cholesterol induces XBP1 expression, which then regulates the expression of immune checkpoints such as PD-1 and 2B4 on CD8+ T cells and induces functional exhaustion.
Inhibiting XBP1 enhances CD8+ T-cell antitumor activity
As our results indicated that the ER-stress sensor XBP1 regulates the expression of T-cell inhibitory receptors and T-cell exhaustion, we wondered whether manipulating XBP1 in T cells would affect their antitumor function. First, we determined the in vivo effects of the ER-stress inhibitor STF on XBP1 expression on adoptively transferred Pmel-1 CD8+ T cells and their antitumor function. In lung B16 tumor-bearing mice, STF treatment significantly reduced XBP1 expression in tumor-infiltrating transferred Pmel-1 CD8+ T cells (Figure 6A). More importantly, tumor-infiltrating Pmel-1 CD8+ T cells from STF-treated mice expressed significantly less PD-1 and 2B4 (Figure 6B), and fewer cells underwent apoptosis (Figure 6B) as compared with those from control mice. We also examined the effect of STF on the antitumor function of adoptively transferred CD8+ T cells. Treatment of tumor-bearing mice with either Pmel-1 CD8+ T cells or STF effectively reduced tumor burden, and the combination of both displayed strong and synergistic antitumor effects in vivo (Figure 6C). These results indicate that in vivo, STF inhibition of XBP1 activity restores CD8+ T-cell function in the tumor microenvironment and improves their antitumor activity.
Figure 6. Inhibiting XBP1 or reducing cholesterol enhances the antitumor activity of CD8+ T cells in vivo.

(A-B) CD8+ T cells from Pmel-1 mice were transferred into 10-day lung B16 tumor-bearing mice. STF-083010 (60 mg/kg) was injected intraperitoneally 1 day after CD8+ T-cell transfer. DMSO was used as control (Ctrl). One week later, lung tumor was collected and the expression of XBP1s (A) and PD-1, 2B4 or annexin-V (B) in transferred CD8+ T cells was examined by flow cytometry. (C) CD8+ T cells from Pmel-1 mice were transferred into B16 tumor-bearing mice as indicated. STF-083010 (30 mg/kg) was injected intraperitoneally once a week for 2 weeks. After 16 days, tumor foci in the lung were counted. (D and E) CD8+ T cells from Pmel-1 mice, treated with XBP1 shRNA to knockdown XBP1 (D), or with XBP1 virus to overexpress XBP1 (E), were transferred into 2-day lung B16 tumor-bearing mice. Two weeks later, tumorfoci in the lung were counted. (F) B16 cells were transfected with ctrl or Hmgcr shRNA and then injected s.c. into B6 mice. In vitro-differentiated Pmel-1-derived CD8+ T cells were injected into ctrl or shHmgcr B16-bearing mice. One week later tumors were collected and PD-1 and 2B4 expression and cholesterol content of tumor-infiltrating Pmel-1 CD8+ T cells were examined. (G) One dose of simvastatin (1 mg; 50 mg/kg body weight) was directly injected into 10-day large established B16 tumor. Three days later, in vitro-differentiated Pmel-1-derived CD8+ T cellswere injected into ctrl or simvastatin-treated B16-bearing mice. One week later tumors were collected and PD-1 and 2B4 expression and cholesterol content of tumor-infiltrating Pmel-1 CD8+ T cells were examined. (H) In vitro-differentiated Pmel-1-derived CD8+ T cells were transfected with Hmgcr shRNA and then injected i.v. into 10-day B16-bearing mice. One week later tumors were collected and PD-1 and 2B4 expression and cholesterol content of tumor-infiltrating Pmel-1 CD8+ T cells were examined. (I) In vitro-differentiated Pmel-1-derived CD8+ T cells were cultured in standard T-cell culture medium or treated with 0.5 mg/ml cholesterol for 5 days. On day 5, the T cells were transferred into 2-day lung B16 tumor-bearing mice. After 2 weeks, tumor foci in the lung were counted. (J and K) In vitro-differentiated Pmel-1-derived CD8+ T cells were cultured in standard T-cell culture medium or treated with 0.5 mg/ml cholesterol for 5 days. On day 5, T cells were transferred into 10-day subcutaneous B16 tumor-bearing mice. Ten days later, transferred, tumor-infiltrating T cells were examined for the expression of PD-1 and 2B4, and the production of Gzmb and IFN-γ by flow. (L) Tumor growth of subcutaneous B16-bearing mice treated with control T cells or cholesterol-treated CD8+ T cells. Experiments were performed with at least three biological replicates and data shown are representative of at least two independent experiments. Data are presented as mean ± SEM. *p < 0.05; **p < 0.01; ***p < 0.001.
To confirm the results, we transferred control or XBP1-KD Pmel-1 CD8+ T cells into lung B16 tumor-bearing mice. As expected, XBP1-KD CD8+ T cells exerted significantly greater antitumor activity in vivo than control CD8+ T cells (Figure 6D). On the contrary, mice treated with control CD8+ T cells had significantly lower numbers of tumor foci in the lung than untreated mice, whereas mice treated with CD8+ T cells overexpressing XBP1 had many more tumor foci than those treated with control CD8+ T cells (Figure 6E), indicating that XBP1-overexpressing CD8+ T cells had lost almost all their antitumor activity in vivo.
Reducing cholesterol in T cells or tumor microenvironment enhances CD8+ T-cell antitumor activity
As tumor-infiltrating T cells and tumor microenvironment contain high cholesterol levels than normal cell or tissues, we determined whether reducing cholesterol level in tumor or its microenvironment affects the immune checkpoint expression on CD8+ T cells in vivo. To reduce cholesterol in tumor cells, we used shRNA to knockdown the cholesterol synthesis gene Hmgcr in B16 cells. Hmgcr-knockdown (ShHmgcr)-B16 cells had a lower cholesterol content than control (ctrl)-B16 cells (Figure S5F), and ShHmgcr-B16-established tumors also had a significantly lower cholesterol content than ctrl-B16-established tumors (Figure S5G). After adoptive transfer, tumor-infiltrating Pmel-1 CD8+ T cells in ShHmgcr-B16-bearing mice displayed significantly lower PD-1 and 2B4 expression and cholesterol content than those from ctrl-B16-bearing mice (Figure 6F). To confirm the results, we injected simvastatin directly into large establish B16 tumors to reduce cholesterol content in tumor and its microenvironment (Figure S5H). Again, tumor-infiltrating Pmel-1 CD8+ T cells from simvastatin-treated mice displayed significantly lower PD-1 and 2B4 expression and cholesterol content than those from control mice (Figure 6G).
To determine whether reducing CD8+ T cell cholesterol affects their immune checkpoint expression in vivo, we injected control or Hmgcr-knockdown (ShHmgcr)-CD8+ T cells (Figure S5I and S5J) into B16-bearing mice. Consistent with above results, tumor-infiltrating ShHmgcr-CD8+ T cells had significantly reduced PD-1 and 2B4 expression and lower cholesterol content compared with control CD8+ T cells in tumor-bearing mice (Figure 6H). Taken together, these results indicate that reducing cholesterol in T cells or tumor microenvironment restores the less-exhausted phenotype of tumor-infiltrating CD8+ T cells.
Finally, we examined whether manipulating cholesterol in CD8+ T cells also affects their antitumor activity in vivo. Control or cholesterol-treated CD8+ T cells were transferred into the lung B16 tumor-bearing mice. As shown in Figure 6I, control CD8+ T cells, which had relatively low cholesterol content, had significantly better antitumor function than cholesterol-treated CD8+ T cells, indicating that cholesterol accumulation in CD8+ T cells compromises their antitumor activity in vivo. To analyze the long term T cell phenotype after adoptive transfer, subcutaneous B16 tumor model was used. Transferred cholesterol-treated CD8+ T cells had increased PD-1 and 2B4 expression (Figure 6J), decreased IFN-γ and Gzmb production (Figure 6K), decreased proliferation (Figure S5K), and increased apoptosis (Figure S5L) as compared with control CD8+ T cells. Cholesterol-treated CD8+ T cells also had significantly impaired antitumor function as compared with control CD8+ T cells (Figure 6L). Taken together, our data clearly demonstrated that cholesterol induces CD8+ T cell functional exhaustion.
DISCUSSION
The role of cholesterol in T-cell activation remains controversial. Swamy et al (Swamy et al., 2016) and Wang et al(Wang et al., 2016) showed that cholesterol or cholesterol sulfate inhibits TCR signaling by either binding to the TCRβ transmembrane region or disrupting TCR multimers, respectively, and provide a molecular mechanism for how lipid-receptor interactions regulate TCR signaling transduction. On the contrary, Yang et al, reported that an increase in the plasma membrane cholesterol level in CD8+ T cells led to enhanced TCR clustering and signaling, efficient formation of the immunological synapse, and better antitumor responses of the cells (Yang et al., 2016). In this study, we found that cholesterol accumulation in tumor-infiltrating CD8+ T cells was associated with upregulated expression of immune checkpoints and functional exhaustion in these cells. Upon activation, immune checkpoints are highly induced on T cells to restrict the activation effect of the costimulatory molecules, thus holding the immune response in check (Wherry, 2011). The expression of these inhibitory receptors will decrease with the recession of the immune response (Wherry, 2011). Under conditions of chronic viral infection or cancer, sustained expression of immune checkpoints on T cells greatly dampens their function and induces cell exhaustion (Wherry, 2011). We showed that tumor microenvironment were enriched with cholesterol, and cholesterol induced CD8+ T cell immune checkpoint expression and functional exhaustion. Hence, these results reveal a novel mechanism by which tumor cells use cholesterol to induce T-cell exhaustion and escapes T-cell immune surveillance.
T-cell exhaustion is associated with progressive cellular dysfunction, and tumor-infiltrating lymphocytes (TILs) often exhibit an exhausted phenotype and limited anti-tumor activity (McKinney and Smith, 2018). Exhausted T cells are characterized by expression of many inhibitory receptors (Wherry, 2011). T-cell exhaustion induced by viral infection can be restored by blocking inhibitory receptors such as PD-1 (Lee et al., 2015). However, tumor-induced T-cell exhaustion may be more complicated due to the tumor microenvironment. Diminished mitochondrial function and reduced glucose uptake are found in TIL exhaustion (McKinney and Smith, 2018). However, metabolic dysfunction is still largely unexplored. The pattern and number of inhibitory receptors simultaneously expressed by the same CD8+ T cells can profoundly affect the severity of dysfunction and exhaustion (Wherry, 2011). Targeting immune checkpoints, such as PD-1 and CTLA-4, has achieved great success in the treatment of many types of cancer, including melanoma, non-small cell lung cancer, renal cancer, and bladder cancer (Callahan et al., 2016). However, relapses are common and many types of cancers have not responded to single immune checkpoint blockade. LAG-3, TIM-3, and TIGIT represent the next generation of immune therapeutic targets in cancer treatment (Dyck and Mills, 2017). Some of these immune checkpoints may have non-redundant functions, and combination therapies, e.g., the combination of anti-PD-1 with anti-CTLA-4 (Buchbinder and Desai, 2016; Duraiswamy et al., 2013; Dyck and Mills, 2017), anti-PD-1 with anti-TIM-3 (Sakuishi et al., 2010), or anti-PD-1 with anti-LAG-3 (Woo et al., 2012), have shown additive or synergistic effects. In addition, inactivation of the PD-1 gene in human CD19-CAR-T cells by CRISPR/Cas9 editing (Rupp et al., 2017) has been reported to enhance the anti-tumor effect of adoptively transferred T cells. Alternatively, our study suggests that reducing cholesterol in both CD8+ T cells and the tumor microenvironment and/or inhibiting XBP1 in CD8+ T cells may greatly enhance the antitumor activity of T cell-based immunotherapy.
Cholesterol-lowering drugs have broad clinical application. Statins are one of the main compounds that inhibit the rate-limiting enzyme in cholesterol synthesis and are commonly used cholesterol-lowering medications with a high safety profile (Law and Rudnicka, 2006). Atorvastatin has been reported to downregulate co-inhibitory receptors such as PD-1, CTLA-4, TIM-3, and LAG-3 expression in T cells (Okoye et al., 2017), which indirectly suggests a relationship between cholesterol and expression of the immune checkpoints. In addition, statins have been reported to reduce T-cell exhaustion in patients with HIV-1 infection (Elahi et al., 2016), reduce cancer-related mortality by 15% (Nielsen et al., 2012), and reduce risk of tumor recurrence in patients with breast cancer (Chae et al., 2011). Thus, these cholesterol-lowering drugs may be potentially and safely used in cancer patients in combination with immunotherapy.
Excess cellular cholesterol induces the unfolded protein response in the ER and results in ER stress (Devries-Seimon et al., 2005; Feng et al., 2003). The ER-stress response factor XBP1 is highly specific to the unfolded protein response (Feng et al., 2003). Targeting ER-stress response or the IRE1a/XBP1 in tumor-associated dendritic cells induced a protective immune response in ovarian cancer (Cubillos-Ruiz et al., 2015). Here, we showed that XBP1 mediated cholesterol-induced expression of immune checkpoints and exhaustion of CD8+ T cells.
XBP1 enhanced the expression of another exhaustion marker KLRG-1 on CD8+ T cells during acute infection (Kamimura and Bevan, 2008), and XBP1 activation was associated with a suppressed mitochondrial activity and reduced IFN-γ production (Song et al., 2018). All of these findings, which are in line with our results, further suggest that XBP1 may be involved in multiple actions that lead to T-cell functional exhaustion.
STF-083010, a small molecule inhibiting XBP1 splicing, has been shown to be cytotoxic against a panel of myeloma cell lines, and selectively killed CD138+ tumor cells from myeloma patients (Papandreou et al., 2011). Our results showed that targeting XBP1 may be an alternative effective approach to downregulate the expression of immune checkpoints on CD8+ T cells.
To summarize, this study has identified a novel mechanism underlying tumor microenvironment-induced T-cell exhaustion and suggests that modulating cholesterol may be an effective strategy to improve the antitumor efficacy of T cell-based immunotherapy. Our study also highlights the importance of manipulating lipid metabolism in T cells and/or the tumor microenvironment to improve the clinical effectiveness of cancer immunotherapies.
Limitations of Study
While our finding demonstrates that tumor-derived cholesterol induced tumor-infiltrating CD8+ T-cell exhaustion, this work does have some limitations. ER stress was induced by cholesterol, but how cholesterol disrupts lipid metabolism and induces ER stress in CD8+ T cells is unclear. XBP-1 upregulated immune checkpoint expression to induce CD8+ T-cell exhaustion, but the detailed transcriptional program of XBP-1-related to T cell exhaustion remains to be investigated.
STAR Methods
Contact for Reagent and Resource Sharing
Further information and requests for resources and reagents should be directed to and will be fulfilled by the Lead Contact, Qing Yi (QYi@houstonmethodist.org).
Reagents and plasmids
Antibodies for flow cytometry against mouse or human CD3, CD8, PD-1, 2B4, thy1.1, TIM-3, CD44, CD69, XBP1s, IFN-γ, Gzmb, TNF-α, and cleaved caspase 3 were purchased from eBioscience or BD. Antibodies for flow cytometry against mouse LAG-3, Ki67, CD62L, CD25, and human PD-1 were purchased from Biolegend. Antibodies for flow cytometry against annexin V were purchased from eBioscience. Antibodies for western blot against XBP1 were purchased from Novus Biologicals and against β-actin from Cell Signaling. Cytokines were purchased from R&D Systems. Cholesterol and β-cyclodextrin were purchased from Sigma-Aldrich. Overexpression plasmids were synthesized from Genscript. STF-083010 was purchased from EMD Millipore. All assays were conducted according to the manufacturer’s protocol unless otherwise indicated.
Mice
B6 mice were purchased from the National Cancer Institute. B6.Cg-Thy1a/Cy Tg (TcraTcrb)8Rest/J (Pmel-1) mice were purchased from the Jackson Laboratory. All experiments complied with protocols approved by the Institutional Animal Care and Use Committee at the Cleveland Clinic.
Cell purification and culture
T cells were isolated with the EasySep Mouse CD8+ T Cell Isolation Kit (STEMCELL Technologies, Inc.). Cells were stimulated and cultured with plate-bound anti-CD3 (2 μg/ml) and soluble anti-CD28 (1 μg/ml) antibodies under Tc1 (IL-2) cell-polarizing conditions with or without the indicated treatments. After 3 days of differentiation, cells were transferred to new wells and cultured in standard T-cell medium for another 2 days. In some experiments, splenocytes from Pmel-1 mice were directly stimulated with hgp10025–33 peptide (Genscript).
Human CD8+ T cells
Buffy coats of healthy donors were purchased from Gulf Coast Regional Blood Center. Informed consent was obtained for all subjects. Peripheral blood mononuclear cells (PBMCs) were isolated from blood by density gradient cell separation. Naive CD8+ T cells were isolated from PBMCs using a negative selection kit (STEMCELL) and stimulated with human T-activator CD3/CD28 Dynabeads (Invitrogen) with human IL-2 (10 ng/ml) for indicated experiments.
Gene microarray
Microarray analysis was performed using the Affymetrix WT Plus expression platform at the Gene Expression and Genotyping Facility at Case Western Reserve University, Cleveland, OH.
Real-time quantitative PCR
Total RNA from T cells was extracted with TRIzol RNA isolation reagents (Invitrogen) or an RNeasy Mini Kit (QIAGEN), followed by cDNA synthesis with the High-Capacity cDNA Reverse Transcription Kit (Applied Biosystems). Real-time quantitative PCR was conducted with SYBR Select Master Mix (Applied Biosystems). Expression was normalized to the expression of the mouse housekeeping gene Gapdh.
Primers used were:
Pdcd1: F1: ATGTGGGTCCGGCAGGTACC; R1: TCAAAGAGGCCAAGAACAATGTC Gapdh: F1: CATGGCCTCCAAGGAGTAAG; R1: CCTAGGCCCCTCCTGTTATT
Xbp1 F1: GACAGAGAGTCAAACTAACGTGG; R1: GTCCAGCAGGCAAGAAGGT Xbp1s F1: AAGAACACGCTTGGGAATGG; R1: CTGCACCTGCTGCGGAC
Cholesterol content measurement
Cellular cholesterol content was measured using the Cholesterol Cell-Based Detection Assay kit (Cayman) and Amplex Red Cholesterol Assay kit (Invitrogen). For the detection assay, cells were stained with Filipin III and then analyzed by flow cytometry. For cholesterol quantification, sterols were extracted with a sterol extraction kit (Sigma) and then analyzed using the Amplex Red assay.
Flow cytometry
Cells were stimulated with phorbol myristate acetate and ionomycin, and treated with brefeldin A (Biolegend) for 4 hours before staining for intracellular cytokines with the BD Fixation/Permeabilization Solution Kit. Results were then acquired using BD Calibur, BD Fortessa or Miltenyi MACSQuant systems. Data were analyzed with FlowJo_V10 software (TreeStar).
Tumor models
Mice (3–5/group) were injected s.c. in the right back flank with 5 × 10⁶ MC38-gp100 tumor cells, or 1 × 10⁶ B16 tumor cells, or 1 × 10⁶ LL2 tumor cells. After 8 to 10 days, tumors formed and were collected for flow cytometry analysis. In the B16 melanoma lung metastatic model, mice were injected intravenously (i.v.) with 2 × 10⁵ B16 cells. At day 15 or 16 after tumor injection, mice were sacrificed, and the mouse lungs were collected and analyzed by flow cytometry.
For adoptive transfer, mice (3–5/group) were injected s.c. in the right rear flank with 5 × 10⁶ MC38-gp100 tumor cells or 1 × 10⁶ B16 tumor cells. For the B16 melanoma lung metastatic model, mice were injected i.v. with 2 × 10⁵ B16 cells. After 12 days, tumor-bearing mice were injected i.v. with 3 × 10⁶ CD8+ T cells. Mice were sacrificed and analyzed 5 to 7 days after CD8+ T cell transfer.
In the B16 melanoma lung metastatic model, some mice were injected i.v. with 1 × 10⁵ B16 cells 2 days before adoptive transfer of 1 × 10⁶ CD8+ T cells. STF-083010 (30 mg/kg) was given once on day 3 and once on day 10. At day 15 or 16 after tumor injection, mice were sacrificed and metastatic lung foci were counted.
In B16 subcutaneous tumor model, mice were injected with 0.8 × 10⁶ B16 cells in the right back flank. At 8 days after tumor injection, mice (5/group) were treated with adoptive transfer of 2 × 10⁶ indicated CD8+ T cells, followed by i.v. injection of 5 × 10⁵ peptide-pulsed bone marrow-derived dendritic cells and 4 doses of rhIL-2 as previously described (Ma et al., 2018). Tumor size was calculated as: 0.5 × L (length) × W (width)2.
Seahorse Assay
Oxygen consumption rate and extracellular acidification rate were measured on an XF-24 Extracellular Flux Analyzer (Seahorse Biosciences) following established protocols (Angelin et al., 2017). XF24 plates were coated using CellTak (BD Biosciences). CD8+ T cells (0.5 × 10⁶) were plated in unbuffered RPMI-1640 medium during the assay.
T-cell cytotoxicity
B16 target cells for Pmel-1 CD8+ T cells were labeled with 5 μM CFSE, whereas MC38 nontarget cells were labeled with 0.5 μM CFSE as a control. B16-target or MC38 non-target control cells were incubated in duplicate with Pmel-1 CD8+ T cells at different effector-to-target ratios. After 24 hours, cells from each target and control well were combined and analyzed by flow cytometry. Percent specific lysis was calculated as (1 - target/control) × 100%.
Western blot and immunoprecipitation assays
Cell lysates and immunoblotting were performed as previously described (Bi et al., 2017; Ma et al., 2018).
Viral transduction
XBP1s shRNAs were synthesized (Genscript) and cloned into the pLKO.1-GFP lentiviral vector. XBP1 and XBP1s overexpressing plasmids in MIGR1 vector were synthesized from Genscript. Viruses were packaged into 293T cells transfected with Lipofectamine 2000 (Life Science). Viral supernatant was harvested from day 1 through day 3, filtered with a 0.45-μm filter, concentrated with PEG-it Virus Precipitation Solution, and stored at −80°C until use. Pmel-1 CD8+ T or B16 tumor cells were mixed with virus and 10 μg/ml protamine sulfate (Sigma) in a 24-well plate, followed by centrifugation at 1,800 rpm at 32°C for 2 hours. After 2 hours incubation, the culture medium was replaced with fresh medium. Three days later, the cells were harvested and used in the indicated experiments. ShRNA oligos:
ShXBP1 1F:
CCGGGGTTGAGAACCAGGAGTTAAGCTCGAGCTTAACTCCTGGTTCTCAACCTTTTTG
ShXBP1 1R:
AATTCAAAAAGGTTGAGAACCAGGAGTTAAGCTCGAGCTTAACTCCTGGTTCTCAACC
ShHmgcr 1F:
CCGGGAACTTTGCAATCTAAGTTTACTCGAGTAAACTTAGATTGCAAAGTTCTTTTTG
ShHmgcr 1R:
AATTCAAAAAGAACTTTGCAATCTAAGTTTACTCGAGTAAACTTAGATTGCAAAGTTC;
Luciferase reporter assay
Mouse Pdcd1 and CD244 promoter (from −1000 to +100 bp) was synthesized (GenScript) and subcloned into the pGL4.10 vector (Promega). Luciferase activity was measured with the Dual-Luciferase Reporter Assay System according to the manufacturer’s instructions (Promega).
ChIP assay
SimpleChIP Plus Enzymatic Chromatin IP Kits (Cell signaling) were used for chromatin immunoprecipitation assays according to the manufacturer’s protocol and measured by real-time quantitative PCR. Chip primers:
XBP1 neg F: ACGCATGGCAGACAAGGTAG
XBP1 neg R: AGACTGAAACTAGGGCCAGAC
XBP1 F1: AATCCCAGAGAGACAAGCAGGAG
XBP1 R1: TTCCCCTGAGAAAAACCTAACA
Human patient samples
Bone marrow aspirates from patients with multiple myeloma and tumor and normal adjacent tissues from colon cancer patients were obtained from patients at the Cleveland Clinic who provided informed consent. Collection and analysis of the clinical samples was approved by the Institutional Review Board of the Cleveland Clinic Foundation.
Statistical analyses
For statistical analysis, Student’s t-test was used. A P value less than 0.05 was considered statistically significant. Results are presented as mean ± SEM unless otherwise indicated.
Data and materials availability:
The microarray data accession number is GSE112901.
Supplementary Material
Highlights.
CD8+ T-cell exhaustion is correlated with a high cholesterol level
Tumor microenvironment is enriched with cholesterol
Cholesterol in the tumor microenvironment induces CD8+ T-cell exhaustion
Endoplasmic reticulum stress-XBP1 pathway is required for cholesterol induced CD8+ T-cell exhaustion
Context and Significance.
Although T-lymphocytes in the body can attack tumors, the latter often present a highly reactive microenvironment that shuts down the killing abilities of T cells. Addressing this challenge will be key to boosting T-cell based immunotherapy in the clinic. Researchers from the Houston Methodist Cancer Center in Texas report that cholesterol in the tumor microenvironment play an active role in inducing T-cell exhaustion by modulating cellular endoplasmic reticulum (ER) stress pathways. Inhibiting the specific ER stress branch or reducing cholesterol in CD8+ T cells effectively restored antitumor activity, highlighting a novel path to improve T-cell based immunotherapy.
ACKNOWLEDGMENTS
This work was supported by grants from the National Cancer Institute (R01 CA163881, R01 CA200539, R01 CA211073, R01 CA214811) and by CPRIT (Cancer Prevention & Research Institute of Texas) Recruitment of Established Investigator Award (RR180044). We thank Research Core services in the Lerner Research Institute of the Cleveland Clinic for their support.
Footnotes
Publisher's Disclaimer: This is a PDF file of an unedited manuscript that has been accepted for publication. As a service to our customers we are providing this early version of the manuscript. The manuscript will undergo copyediting, typesetting, and review of the resulting proof before it is published in its final citable form. Please note that during the production process errors may be discovered which could affect the content, and all legal disclaimers that apply to the journal pertain.
DECLARATION OF INTERESTS
The authors have declared that no conflicts of interest exist.
Reference
- Anderson AC, Lord GM, Dardalhon V, Lee DH, Sabatos-Peyton CA, Glimcher LH, and Kuchroo VK (2010). T-bet, a Th1 transcription factor regulates the expression of Tim-3. Eur J Immunol 40, 859–866. [DOI] [PMC free article] [PubMed] [Google Scholar]
- Angelin A, Gil-de-Gomez L, Dahiya S, Jiao J, Guo L, Levine MH, Wang Z, Quinn WJ 3rd, Kopinski PK, Wang L, et al. (2017). Foxp3 Reprograms T Cell Metabolism to Function in Low-Glucose, High-Lactate Environments. Cell Metab 25, 1282–1293 e1287. [DOI] [PMC free article] [PubMed] [Google Scholar]
- Austin JW, Lu P, Majumder P, Ahmed R, and Boss JM (2014). STAT3, STAT4, NFATc1, and CTCF regulate PD-1 through multiple novel regulatory regions in murine T cells. J Immunol 192, 4876–4886. [DOI] [PMC free article] [PubMed] [Google Scholar]
- Baek AE, Yu YA, He S, Wardell SE, Chang CY, Kwon S, Pillai RV, McDowell HB, Thompson JW, Dubois LG, et al. (2017). The cholesterol metabolite 27 hydroxycholesterol facilitates breast cancer metastasis through its actions on immune cells. Nat Commun 8, 864. [DOI] [PMC free article] [PubMed] [Google Scholar]
- Bally AP, Austin JW, and Boss JM (2016). Genetic and Epigenetic Regulation of PD-1 Expression. J Immunol 196, 2431–2437. [DOI] [PMC free article] [PubMed] [Google Scholar]
- Bi E, Ma X, Lu Y, Yang M, Wang Q, Xue G, Qian J, Wang S, and Yi Q (2017). Foxo1 and Foxp1 play opposing roles in regulating the differentiation and antitumor activity of TH9 cells programmed by IL-7. Sci Signal 10, eaak9741. [DOI] [PMC free article] [PubMed] [Google Scholar]
- Boussiotis VA (2016). Molecular and Biochemical Aspects of the PD-1 Checkpoint Pathway. N Engl J Med 375, 1767–1778. [DOI] [PMC free article] [PubMed] [Google Scholar]
- Buchbinder EI, and Desai A (2016). CTLA-4 and PD-1 Pathways Similarities, Differences, and Implications of Their Inhibition. American Journal of Clinical Oncology-Cancer Clinical Trials 39, 98–106. [DOI] [PMC free article] [PubMed] [Google Scholar]
- Callahan MK, Postow MA, and Wolchok JD (2016). Targeting T Cell Co-receptors for Cancer Therapy. Immunity 44, 1069–1078. [DOI] [PubMed] [Google Scholar]
- Chae YK, Valsecchi ME, Kim J, Bianchi AL, Khemasuwan D, Desai A, and Tester W (2011). Reduced Risk of Breast Cancer Recurrence in Patients Using ACE Inhibitors, ARBs, and/or Statins. Cancer Investigation 29, 585–593. [DOI] [PubMed] [Google Scholar]
- Cubillos-Ruiz JR, Silberman PC, Rutkowski MR, Chopra S, Perales-Puchalt A, Song M, Zhang S, Bettigole SE, Gupta D, Holcomb K, et al. (2015). ER Stress Sensor XBP1 Controls Anti-tumor Immunity by Disrupting Dendritic Cell Homeostasis. Cell 161, 1527–1538. [DOI] [PMC free article] [PubMed] [Google Scholar]
- Dessi S, Batetta B, Pulisci D, Spano O, Anchisi C, Tessitore L, Costelli P, Baccino FM, Aroasio E, and Pani P (1994). Cholesterol Content in Tumor-Tissues Is Inversely Associated with High-Density-Lipoprotein Cholesterol in Serum in Patients with Gastrointestinal Cancer. Cancer 73, 253–258. [DOI] [PubMed] [Google Scholar]
- Devries-Seimon T, Li Y, Yao PM, Stone E, Wang Y, Davis RJ, Flavell R, and Tabas I (2005). Cholesterol-induced macrophage apoptosis requires ER stress pathways and engagement of the type A scavenger receptor. J Cell Biol 171, 61–73. [DOI] [PMC free article] [PubMed] [Google Scholar]
- Duraiswamy J, Kaluza KM, Freeman GJ, and Coukos G (2013). Dual Blockade of PD-1 and CTLA-4 Combined with Tumor Vaccine Effectively Restores T-Cell Rejection Function in Tumors. Cancer Research 73, 3591–3603. [DOI] [PMC free article] [PubMed] [Google Scholar]
- Dyck L, and Mills KHG (2017). Immune checkpoints and their inhibition in cancer and infectious diseases. Eur J Immunol 47, 765–779. [DOI] [PubMed] [Google Scholar]
- Elahi S, Weiss RH, and Merani S (2016). Atorvastatin restricts HIV replication in CD4(+) T cells by upregulation of p21. Aids 30, 171–183. [DOI] [PubMed] [Google Scholar]
- Feng B, Yao PM, Li YK, Devlin CM, Zhang DJ, Harding HP, Sweeney M, Rong JX, Kuriakose G, Fisher EA, et al. (2003). The endoplasmic reticulum is the site of cholesterol-induced cytotoxicity in macrophages. Nature Cell Biology 5, 781–792. [DOI] [PubMed] [Google Scholar]
- Kamimura D, and Bevan MJ (2008). Endoplasmic reticulum stress regulator XBP-1 contributes to effector CD8+ T cell differentiation during acute infection. J Immunol 181, 5433–5441. [DOI] [PMC free article] [PubMed] [Google Scholar]
- Kao C, Oestreich KJ, Paley MA, Crawford A, Angelosanto JM, Ali MA, Intlekofer AM, Boss JM, Reiner SL, Weinmann AS, et al. (2011). Transcription factor T-bet represses expression of the inhibitory receptor PD-1 and sustains virus-specific CD8+ T cell responses during chronic infection. Nat Immunol 12, 663–671. [DOI] [PMC free article] [PubMed] [Google Scholar]
- Law M, and Rudnicka AR (2006). Statin safety: a systematic review. Am J Cardiol 97, 52C–60C. [DOI] [PubMed] [Google Scholar]
- Lee J, Ahn E, Kissick HT, and Ahmed R (2015). Reinvigorating Exhausted T Cells by Blockade of the PD-1 Pathway. For Immunopathol Dis Therap 6, 7–17. [DOI] [PMC free article] [PubMed] [Google Scholar]
- Liu Y, Liang X, Dong W, Fang Y, Lv J, Zhang T, Fiskesund R, Xie J, Liu J, Yin X, et al. (2018). Tumor-Repopulating Cells Induce PD-1 Expression in CD8(+) T Cells by Transferring Kynurenine and AhR Activation. Cancer Cell 33, 480–494 e487. [DOI] [PubMed] [Google Scholar]
- Lu P, Youngblood BA, Austin JW, Mohammed AU, Butler R, Ahmed R, and Boss JM (2014a). Blimp-1 represses CD8 T cell expression of PD-1 using a feed-forward transcriptional circuit during acute viral infection. J Exp Med 211, 515–527. [DOI] [PMC free article] [PubMed] [Google Scholar]
- Lu Y, Hong B, Li H, Zheng Y, Zhang M, Wang S, Qian J, and Yi Q (2014b). Tumor-specific IL-9-producing CD8+ Tc9 cells are superior effector than type-I cytotoxic Tc1 cells for adoptive immunotherapy of cancers. Proc Natl Acad Sci U S A 111, 2265–2270. [DOI] [PMC free article] [PubMed] [Google Scholar]
- Ma X, Bi E, Huang C, Lu Y, Xue G, Guo X, Wang A, Yang M, Qian J, Dong C, et al. (2018). Cholesterol negatively regulates IL-9-producing CD8(+) T cell differentiation and antitumor activity. J Exp Med 215, 1555–1569. [DOI] [PMC free article] [PubMed] [Google Scholar]
- McKinney EF, and Smith KGC (2018). Metabolic exhaustion in infection, cancer and autoimmunity. Nature Immunology 19, 213–221. [DOI] [PubMed] [Google Scholar]
- Nielsen SF, Nordestgaard BG, and Bojesen SE (2012). Statin Use and Reduced Cancer-Related Mortality. New England Journal of Medicine 367, 1792–1802. [DOI] [PubMed] [Google Scholar]
- Okoye I, Namdar A, Xu L, Crux N, and Elahi S (2017). Atorvastatin downregulates co-inhibitory receptor expression by targeting Ras-activated mTOR signalling. Oncotarget 8, 98215–98232. [DOI] [PMC free article] [PubMed] [Google Scholar]
- Papandreou I, Denko NC, Olson M, Van Melckebeke H, Lust S, Tam A, Solow-Cordero DE, Bouley DM, Offner F, Niwa M, et al. (2011). Identification of an Ire1alpha endonuclease specific inhibitor with cytotoxic activity against human multiple myeloma. Blood 117, 1311–1314. [DOI] [PMC free article] [PubMed] [Google Scholar]
- Park BV, Freeman ZT, Ghasemzadeh A, Chattergoon MA, Rutebemberwa A, Steigner J, Winter ME, Huynh TV, Sebald SM, Lee SJ, et al. (2016). TGFbeta1-Mediated SMAD3 Enhances PD-1 Expression on Antigen-Specific T Cells in Cancer. Cancer Discov 6, 1366–1381. [DOI] [PMC free article] [PubMed] [Google Scholar]
- Ribas A, and Wolchok JD (2018). Cancer immunotherapy using checkpoint blockade. Science 359, 1350–1355. [DOI] [PMC free article] [PubMed] [Google Scholar]
- Rupp LJ, Schumann K, Roybal KT, Gate RE, Ye CJ, Lim WA, and Marson A (2017). CRISPR/Cas9-mediated PD-1 disruption enhances anti-tumor efficacy of human chimeric antigen receptor T cells. Sci Rep 7, 737. [DOI] [PMC free article] [PubMed] [Google Scholar]
- Sakuishi K, Apetoh L, Sullivan JM, Blazar BR, Kuchroo VK, and Anderson AC (2010). Targeting Tim-3 and PD-1 pathways to reverse T cell exhaustion and restore anti-tumor immunity. Journal of Experimental Medicine 207, 2187–2194. [DOI] [PMC free article] [PubMed] [Google Scholar]
- Song M, Sandoval TA, Chae CS, Chopra S, Tan C, Rutkowski MR, Raundhal M, Chaurio RA, Payne KK, Konrad C, et al. (2018). IRE1alpha-XBP1 controls T cell function in ovarian cancer by regulating mitochondrial activity. Nature 562, 423–428. [DOI] [PMC free article] [PubMed] [Google Scholar]
- Stephen TL, Payne KK, Chaurio RA, Allegrezza MJ, Zhu H, Perez-Sanz J, Perales-Puchalt A, Nguyen JM, Vara-Ailor AE, Eruslanov EB, et al. (2017). SATB1 Expression Governs Epigenetic Repression of PD-1 in Tumor-Reactive T Cells. Immunity 46, 51–64. [DOI] [PMC free article] [PubMed] [Google Scholar]
- Swamy M, Beck-Garcia K, Beck-Garcia E, Hartl FA, Morath A, Yousefi OS, Dopfer EP, Molnar E, Schulze AK, Blanco R, et al. (2016). A Cholesterol-Based Allostery Model of T Cell Receptor Phosphorylation. Immunity 44, 1091–1101. [DOI] [PubMed] [Google Scholar]
- Tang CH, Ranatunga S, Kriss CL, Cubitt CL, Tao J, Pinilla-Ibarz JA, Del Valle JR, and Hu CC (2014). Inhibition of ER stress-associated IRE-1/XBP-1 pathway reduces leukemic cell survival. J Clin Invest 124, 2585–2598. [DOI] [PMC free article] [PubMed] [Google Scholar]
- Voron T, Colussi O, Marcheteau E, Pernot S, Nizard M, Pointet AL, Latreche S, Bergaya S, Benhamouda N, Tanchot C, et al. (2015). VEGF-A modulates expression of inhibitory checkpoints on CD8+ T cells in tumors. J Exp Med 212, 139–148. [DOI] [PMC free article] [PubMed] [Google Scholar]
- Wang F, Beck-Garcia K, Zorzin C, Schamel WW, and Davis MM (2016). Inhibition of T cell receptor signaling by cholesterol sulfate, a naturally occurring derivative of membrane cholesterol. Nat Immunol 17, 844–850. [DOI] [PMC free article] [PubMed] [Google Scholar]
- Wherry EJ (2011). T cell exhaustion. Nature Immunology 12, 492–499. [DOI] [PubMed] [Google Scholar]
- Woo SR, Turnis ME, Goldberg MV, Bankoti J, Selby M, Nirschl CJ, Bettini ML, Gravano DM, Vogel P, Liu CL, et al. (2012). Immune Inhibitory Molecules LAG-3 and PD-1 Synergistically Regulate T-cell Function to Promote Tumoral Immune Escape. Cancer Research 72, 917–927. [DOI] [PMC free article] [PubMed] [Google Scholar]
- Yang W, Bai Y, Xiong Y, Zhang J, Chen S, Zheng X, Meng X, Li L, Wang J, Xu C, et al. (2016). Potentiating the antitumour response of CD8(+) T cells by modulating cholesterol metabolism. Nature 531, 651–655. [DOI] [PMC free article] [PubMed] [Google Scholar]
- Yun SJ, Jun KJ, Komori K, Lee MJ, Kwon MH, Chwae YJ, Kim K, Shin HJ, and Park S (2016). The regulation of TIM-3 transcription in T cells involves c-Jun binding but not CpG methylation at the TIM-3 promoter. Mol Immunol 75, 60–68. [DOI] [PubMed] [Google Scholar]
Associated Data
This section collects any data citations, data availability statements, or supplementary materials included in this article.