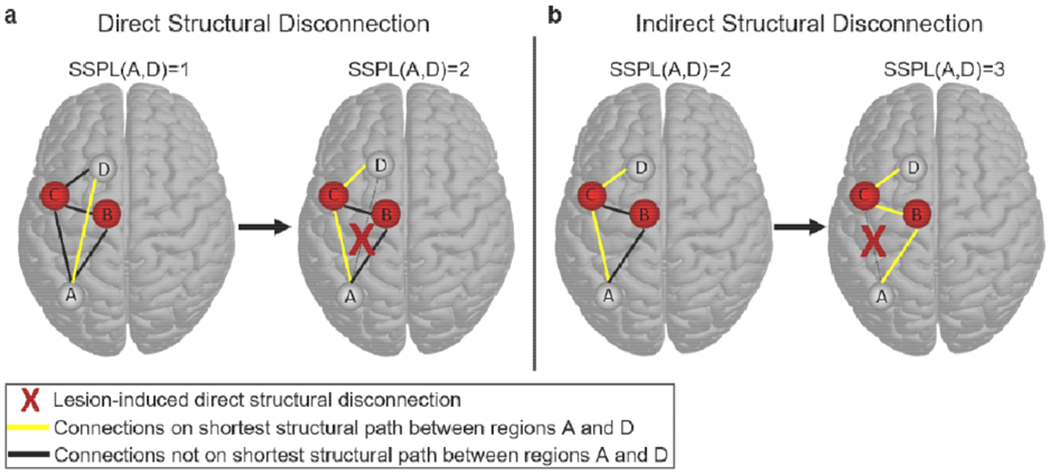
Fig. 1.

Defining direct and indirect structural disconnections. (a) The brain on the left shows a simple network where regions A and D are directly structurally connected to each other (yellow line), and therefore have an SSPL equal to 1. The brain on the right shows the SSPL (yellow line) between regions A and D after the direct structural connection has been disrupted by a lesion (red X): the SSPL between regions A and D is now 2 because the shortest path passes through region C. This is an example of how direct structural disconnections increase SSPLs between disconnected regions. (b) The brain on the left shows an alternative network configuration where regions A and D are indirectly structurally connected to each other via mutual connections to region C (yellow line), and therefore have an SSPL equal to 2. The brain on the right shows the SSPL (yellow line) between regions A and D after the structural connection between regions A and C has been disrupted by a lesion (red X): the SSPL between regions A and D is now 3 because the shortest path passes through both regions B and C. This is an example of how a direct structural disconnection can increase SSPLs between indirectly structurally connected regions, which we refer to here as an “indirect structural disconnection”.
