
Fig. 4.
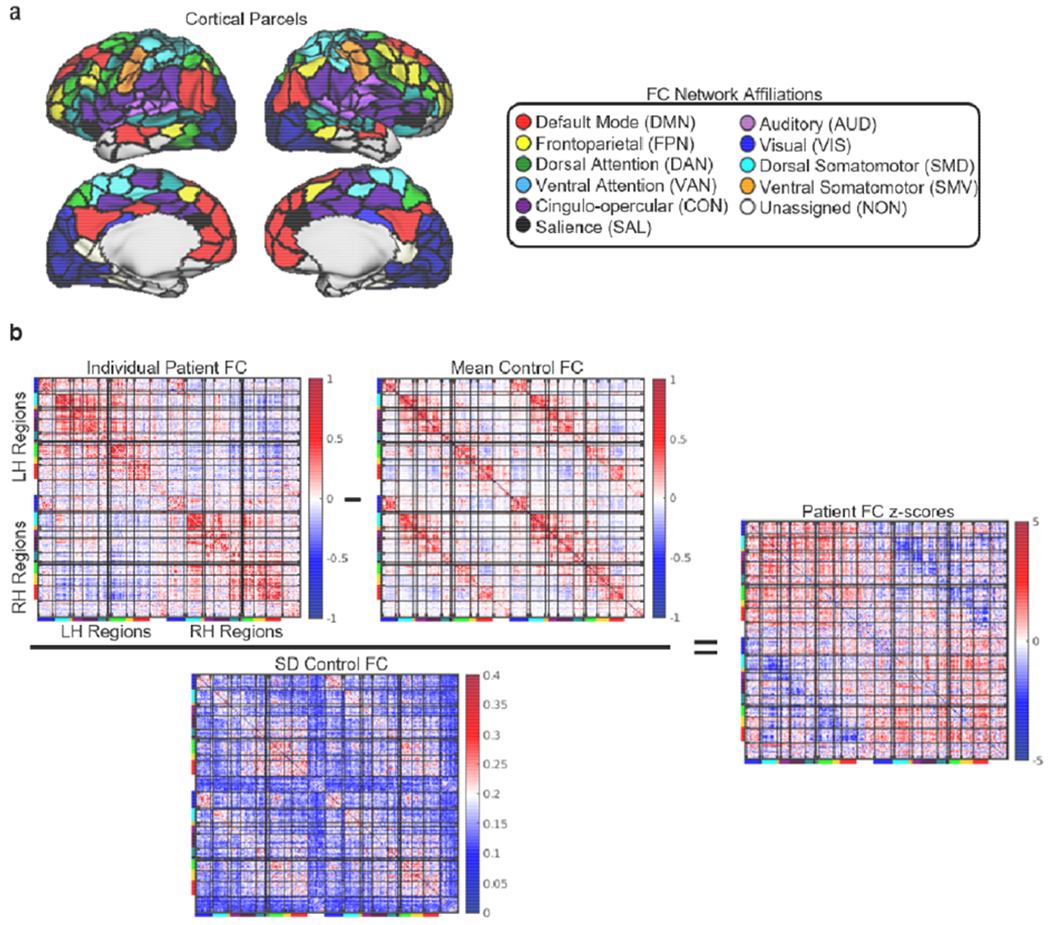
Functional connectivity disruptions. (a) Cortical regions are shown on the cortical surface and are color-coded by network assignment. (b) The transformation of a raw functional connectivity matrix to a functional connectivity z-score matrix is illustrated for the same patient shown in Fig. 3c–d. The bars on matrix axes correspond to the cortical functional connectivity network assignments shown in the legend at the top of the figure.