

Abstract
Numerous synaptic and intrinsic membrane mechanisms have been proposed for generating oscillatory activity in the hippocampus. Few studies, however, have directly measured synaptic conductances and membrane properties during oscillations. The time course and relative contribution of excitatory and inhibitory synaptic conductances, as well as the role of intrinsic membrane properties in amplifying synaptic inputs, remains unclear. To address this issue, we used an isolated whole hippocampal preparation that generates autonomous low-frequency oscillations near the theta range. Using 2-photon microscopy and expression of genetically-encoded fluorophores, we obtained on-cell and whole-cell patch recordings of pyramidal cells and fast-firing interneurons in the distal subiculum. Pyramidal cell and interneuron spiking shared similar phase-locking to LFP oscillations. In pyramidal cells, spiking resulted from a concomitant and balanced increase in excitatory and inhibitory synaptic currents. In contrast, interneuron spiking was driven almost exclusively by excitatory synaptic current. Thus, similar to tightly-balanced networks underlying hippocampal gamma oscillations and ripples, balanced synaptic inputs in the whole hippocampal preparation drive highly phase-locked spiking at the peak of slower network oscillations.
Keywords: E/I balance, electrophysiology, subiculum, network oscillations, whole hippocampal preparation
Introduction
Balanced excitation-inhibition (E/I) during activity is a common feature of neuronal networks (Anderson et al., 2000; Haider et al., 2006; Rudolph et al., 2007; Okun & Lampl, 2008). During evoked activity and local field potential (LFP) oscillations, balanced E/I currents underlie depolarizations in hippocampal and cortical excitatory principal cells in vivo (Wilent & Contreras, 2005; Atallah & Scanziani, 2009; Gan et al., 2017). A key characteristic of balanced E/I inputs is that they maintain membrane voltage near spike threshold and permit precise control over spike output rate (Shu et al., 2003; Wehr & Zador, 2003; Gabernet et al., 2005; Higley & Contreras, 2006). Additionally, recruitment of inhibition over a range of network activity levels likely prevents runaway excitation in networks with strong recurrent connections such as the subiculum (Harris et al., 2001; Drexel et al., 2017). In the hippocampus, fast frequency oscillations such as gamma (30–80 Hz) and ripples (~200 Hz) have been shown to have properties consistent with generation through correlated and balanced synaptic currents (Atallah & Scanziani, 2009; English et al., 2014; Gan et al., 2017). For lower frequencies such as theta (3–12 Hz), however, balanced network activity has not been recognized as a potentially contributing factor to this oscillation range. Instead, mechanisms involving intrinsic membrane properties such as resonance and rebound spiking have been favored (Cobb et al., 1995; Hu et al., 2002; Zemankovics et al., 2010; Stark et al., 2013).
We sought to better understand the biophysical factors generating low frequency or theta-like rhythms in the isolated hippocampal preparation (Goutagny et al., 2009). Utilizing the hippocampal preparation, which generates autonomous low frequency oscillations (3 – 7 Hz), we targeted pyramidal cells (PYR) and fast-firing parvalbumin (PV)-expressing interneurons to enable visually-guided patch-clamping using 2-photon microscopy. Our recordings focused on the distal subiculum, which appears to serve as the pacemaker of the theta-like rhythm in this preparation (Jackson et al., 2011; Jackson et al., 2014).
During network oscillations, both PYR and PV cells in the hippocampal preparation spiked at the peak of the LFP. Our voltage- and current-clamp recordings indicate that intracellular depolarizations that correlate to LFP oscillations in PYR cells are produced through a concomitant increase in excitatory and inhibitory synaptic currents. A near simultaneous and balanced rise in both currents depolarizes PYR cells near spike threshold and leads to spike phase-locking at the peak of the network rhythm. In contrast, in PV cells, inhibition is nearly absent and spike activity is driven largely by excitatory currents. Nevertheless, PV cells fire in phase with pyramidal cells. The near simultaneous rise in excitation and inhibition, along with similar PYR and PV cell spike-phase, indicates that a balanced and correlated increase in excitation and inhibition underlies spike phase-locking during network oscillations in subiculum. Autonomous oscillations in this region, therefore, share similarities to previous network mechanisms establishing hippocampal gamma oscillations and ripples (Atallah & Scanziani, 2009; English et al., 2014; Gan et al., 2017).
Materials and methods
Ethics statement
All experimental protocols were approved by the Boston University Institutional Animal Care and Use Committee.
Tissue Preparation
Transgenic mice (P12-P18) of either sex were anesthetized with isoflurane and decapitated into a solution of ice-cold artificial cerebrospinal fluid (aCSF), oxygenated and buffered to pH 7.3 with 95% O2/ 5% CO2. ACSF consisted of (in mM): NaCl (126), NaHCO3 (24), D-glucose (10), KCl (4.5), MgSO4 (2), NaH2PO4 (1.25), CaCl2 (1) and ascorbic acid (0.4) (Sigma-Aldrich). Both hippocampi were extracted and incubated in room temperature aCSF for 30–120 minutes. Subsequently, one hippocampus was transferred to a custom recording chamber that was equipped to recirculate oxygenated/buffered aCSF (add. 1 mM CaCl2) at a flowrate of 20–25 mL/min and a temperature of 30.0°C or 31.5°C ± 0.2°C.
Visualizing hippocampal pyramidal cells and parvalbumin-expressing interneurons
To visualize cells and glass pipettes in the distal subiculum (Fig. 3C, 3D), we used a 2-photon microscope (Bergamo II Series, ThorLabs) equipped with a Ti:Sapphire laser (920 nm; Chameleon Ultra, Coherent) to enable excitation of fluorescent markers through a 20x, NA 0.95 objective lens (Olympus). To detect fluorescence from intracellular tdTomato and Alexa 488 in the pipette, we used two photo-multiplier tubes (Hamamatsu) that receive either red or green optically filtered emission, respectively. Transgenic mice were generated by crossing CaMKIIa- or PV-Cre promoter mice (Jackson Labs, stock # 005359 or 008069) with the loxP-flanked tdTomato reporter mice (Jackson Labs, stock # 007914)(Madisen et al., 2010). The CamkIIa-promoter is specific for expression in principal cells (Tsien et al., 1996), while the PV-promoter targets interneurons expressing parvalbumin (Hippenmeyer et al., 2005).
Figure 3.

Intracellular current-clamp recordings of PYR and PV cells during intrinsic hippocampal oscillations. A. Example LFP recording (black) and corresponding membrane voltage from PYR cell (red) and B. PV cell (blue). Ai. Distribution of spike half-width and spike threshold for PYR cells (red, n = 14). and Bi. PV cells (blue, n = 8). C. 2-photon image, during whole-cell patch clamp, of a PYR cell (yellow) filled with Alexa 488 (green) in addition to endogenous tdTomato (red). D. Fill of a PV cell (yellow) during whole-cell patch clamp.
Electrophysiology
A pulled-glass electrode (0.5–1.5 MΩ) containing aCSF and Alexa Fluor 488 hydrazide (.0029% w/v; Thermofisher Scientific) was used to record LFP oscillations in the distal subiculum at the mid-septotemporal axis. The LFP electrode was advanced through the hippocampal tissue using a micromanipulator (Sutter Instrument) until oscillations reached peak amplitude, reportedly around the stratum radiatum (Goutagny et al., 2009). A second electrode (3.5–6.5 MΩ) with intracellular solution and Alexa 488 (.0014% w/v) was placed in close proximity to patch-clamp fluorescing neurons. The intracellular solution was comprised of (in mM): K-gluconate (136), HEPES (10), KCL (4), EGTA (0.2), MgCl2 (2), diTrisPhCr (7), Na2ATP (4), and TrisGTP (0.3); buffered to pH 7.3 with KOH (Sigma-Aldrich).
Signals were recorded with Clampex (v. 10.6; Molecular Devices) using a Multiclamp 700B amplifier and Digidata 1440A digitizer (Molecular Devices) at a sampling rate of 10 kHz, with the LFP filtered between 1–50 Hz. Signals were processed and analyzed using integrated MATLAB (R2017b; Mathworks) functions and custom scripts.
Pipette offset was compensated prior to achieving on-cell patch recordings. Once the patch electrode was sealed to the cell membrane (>1 GΩ seal), pipette capacitance was compensated. Using this configuration, action potentials were recorded as capacitive current in voltage-clamp mode (Fig. 2A, 2B). During intracellular recordings, access resistance (15–30 MΩ) was compensated and monitored every 5–10 min to not exceed 65 MΩ. For measurements of intracellular currents (voltage-clamp), QX-314 chloride (1 mM, Tocris Bioscience) was added to the intracellular solution to block non-linearities associated with sodium channels. For voltage-clamp recordings, series resistance was compensated up to 75%. To eliminate oscillations in the hippocampal preparation, bath application of DNQX disodium salt (20 µM, Tocris Bioscience) was utilized (Fig. 8).
Figure 2.

PYR and PV cells spike primarily during the peak of LFP oscillations in the subiculum. A. Example recording from the fastest frequency LFP (top, black) during concurrent on-cell recording of a PYR cell (red, bottom). PYR cell spikes are highly phase-locked to the peak of LFP oscillations. Ai. Distribution of spike-phase and vector strength from each PYR cell (yellow, vertices) and average spike-phase/vector strength from all PYR cells (red, n = 22). Aii. Preferred spike phase in PYR cells (red) is independent of LFP frequency and Aiii. PYR cell spiking occurs at a slow rate. B. Example of fastest frequency LFP (top) during concurrent on-cell recording of PV cell (blue, bottom). Bi. Distribution of spike-phase and vector strength from each PV cell (yellow, vertices) and average spike-phase/vector strength from all PV cells (blue, n = 16). Bii. Preferred spike phase in PV cells (blue) is independent of LFP frequency and Biii. PV spiking occurs at a similar rate to PYR cells.
Figure 8.

Application of glutamatergic antagonist DNQX abolishes oscillations in both the LFP and membrane voltage of PYR and PV cells. A. Example LFP (top, black) and membrane voltage of a PYR cell (bottom, red) after bath application of DNQX. Within minutes spiking and voltage fluctuations in the PYR cell cease. B. Small hyperpolarizing current steps (black) were repeated to obtain an average voltage trace for PYR and PV cells, examples in (red) and (blue) respectively. Ai & Bi. Comparison of intrinsic membrane properties at baseline (some cells from Fig. 4), and after DNQX application. DNQX application significantly changes the intrinsic properties of Ai. PYR cells (red, n = 7) but not Bi. PV cells (blue, n = 4).
Data Analysis
Data in text and figures are reported as median and interquartile range (25–75%) due to the non-normal distribution (p < 0.05, one-sample Kolmogorov-Smirnov test). Likewise, the statistical tests used are non-parametric. Reported values of membrane voltage are not adjusted for liquid junction potential; actual values are 11.5 mV more negative.
All data from neurons used in this study (n = 38) had accompanying on-cell spiking behavior documented and analyzed (Fig. 2) using the last 100 oscillation cycles of the on-cell recordings. Oscillation cycles were detected by peaks in the derivative of the LFP phase, which occurred when the phase wraps from −180 to 180 degrees (cycle beginning/end). The phase of the LFP was determined with a Hilbert transform function implemented in Matlab. Portions of the LFP trace that are relatively flat tend to create many of these peaks over a short duration, so data from inter-peak intervals less than 100 ms (cycles >10 Hz) was not considered. Recordings from the end of experimental sessions (>1hr) were discarded when the LFP became variable in amplitude and spiking was inconsistent (<1 spk/cycle). For the duration of the last 100 oscillation cycles of an on-cell recording, the LFP characteristics were also determined (Fig. 1). Frequency analysis of the LFP (Fig. 1A, 1Ai) utilized the multi-taper mtspecgramc function of the Chronux toolbox [http://chronux.org/], with an averaging window of 2.5 sec moving every 1.67 sec. This method was also applied to determine the frequency content of synaptic currents at −60 mV holding voltage (Fig. 6Aiii/i, 6Biii/i).
Figure 1.
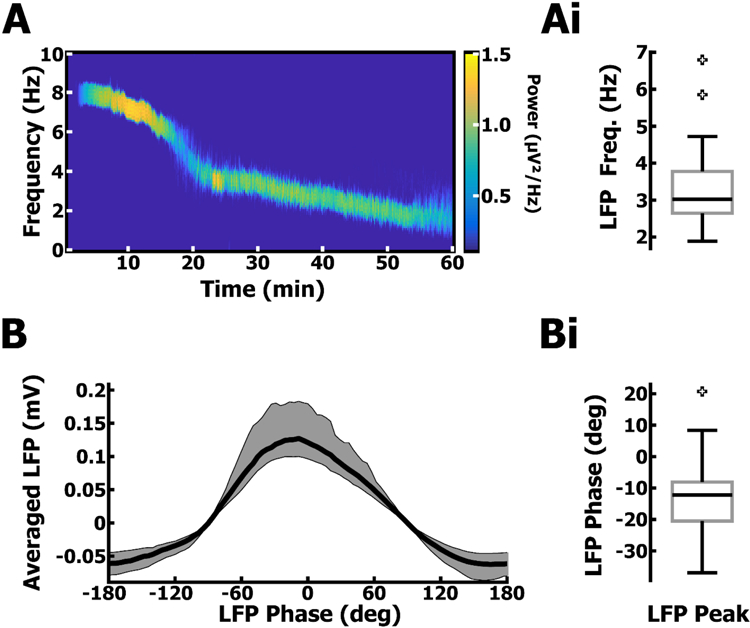
The whole hippocampal preparation generates stable and long-lasting autonomous oscillations. A. Example spectrogram of an LFP oscillation in the distal subiculum and its progression over the course of 1 hr. Ai. Distribution of mean LFP frequency across all hippocampal preparations (PYR & PV, n = 38), recorded from the subiculum during concurrent on-cell patch clamp experiments (Fig. 2). B. Phase-averaged LFP cycle from all recordings. Bi. distribution of LFP phase corresponding to the LFP peak amplitude across all recordings.
Figure 6.

Quantification of membrane conductance as a function of LFP phase using voltage clamp across multiple holding voltages. A. Example voltage clamp of a PYR cell at various holding voltages averaged over multiple oscillation cycles. Ai. The slope of the I-V curve represents the neuronal conductance at a particular phase of the LFP. The increase from baseline (orange) to peak (red) conductance results from synaptic input. The reversal potential of synaptic input is the holding voltage where the difference between baseline and peak current equals 0. A synaptic reversal potential that falls between the reversals of GABAa (−62.2mV) and AMPA (−1.5mV), provides the ratio of inhibitory (gI) to excitatory conductance (gE). As in Aii, a reversal potential that is perithreshold is considered the result of balanced currents. Aii. Distribution of reversal potentials from all voltage clamped PYR cells (n = 8) during their respective phase of peak conductance. Aiii. Example spectrogram of PYR cell current at a holding voltage similar to resting membrane potential (−60 mV), reveals synaptic inputs at theta-like frequencies. Aiiii. Distribution of membrane current frequency in all voltage-clamped PYR cells (n = 8) at −60 mV holding voltage. B. As in A but for PV cells. Inward current is present even at suprathreshold voltages, suggesting a lack of hyperpolarizing GABAa conductance. Bi. Inability to depolarize past the reversal of synaptic conductance in PV cells, the reversal potential between baseline (light blue) and peak conductance (dark blue) must be extrapolated. Bii. Distribution of reversal potentials from all voltage-clamped PV (n = 8) cells during their respective phase of peak conductance. Biii. Example spectrogram of PV cell showing theta-modulated synaptic currents at −60 mV. Biiii. Distribution of membrane current frequency in all voltage-clamped PV cells (n = 8) at −60 mV holding voltage.
From whole-cell current-clamp recordings (Fig. 3), threshold values of spikes were determined using the peak of the second derivative of membrane voltage. Spike half-width was calculated as the time between midpoints (voltage between threshold and spike peak) of the rising and falling phase. If a neuron spiked more than once in a cycle, only the first spike was analyzed to avoid spike history dependence in the measurement. The mean from 10 cycles was used for each cell. Input resistance was calculated by measuring the mean change in membrane voltage (~5 mV) in response to repeated steps of injected current (50x, 1 sec on/off) at the resting membrane potential (Fig. 4). Membrane time constant was determined using a non-linear regression fit of the membrane voltage between the start of the current step and 100 ms after the start of the current step. Additionally, steps of various current (~30 steps; 10 sec on/ 2 sec off) were injected into neurons to drive membrane voltage throughout the cell’s dynamic range (Fig. 5). The Matlab function xcorr was used to determine the normalized cross-correlation coefficient between the LFP and membrane voltage during current steps (Fig. 5Ai, 5Bi). To create averaged membrane voltage traces, for each current step the membrane voltage trace was binned in accordance to the LFP phase (Fig. 5A, 5B).
Figure 4.

Membrane properties of PYR and PV cells during autonomous oscillations. A. Example PYR cell membrane voltage in response to hyperpolarizing steps (black), and average from all steps (red) during non-spiking trough phase. B. as in A, but from PV cell (blue) Ai. Distributions of intrinsic membrane properties from PYR cells (red, n = 14) and Bi. PV cells (blue, n = 8).
Figure 5.

Membrane voltage of PYR and PV cells is highly correlated to the LFP. A. Example of a PYR cell’s membrane voltage (red) averaged over multiple cycles at various steps of applied current. B. As in A. but for a PV cell. Ai. Cross-correlation (0 ms lag) between the LFP and membrane voltage of PYR cells (red, n = 14) over multiple membrane voltages. With applied current, as in A (I=125pA), when the membrane voltage matches the reversal potential of synaptic input, the driving force to move membrane potential up or down drops to zero as does the LFP to membrane voltage cross-correlation (dotted line). A sign reversal in cross-correlation that occurs between the values of Eexc (−1.5mV) and Einh (−61.5mV) indicates synaptic input that is a combination of both excitation and inhibition. Bi. As in Ai but for PV cells (blue, n = 8). The cross-correlation for PV cells does not reverse sign indicating a lack of hyperpolarizing input.
Similarly, for voltage-clamp recordings, membrane current traces were binned by the LFP phase for each holding-voltage step (10 steps, −75 mV to −30 mV; Fig. 6A, 6B). Then for every bin, the membrane current and voltage values were used to generate a linear I-V curve, whose slope is a measure of the cell’s conductance at a particular phase of the LFP (Fig. 6Ai, 6Bi). Total synaptic conductance as a function of LFP phase was determined by the difference in I-V slope, or conductance, between the first (baseline) bin and subsequent phase-dependent bins of conductance. The voltage at which the two I-V curves intersect is indicative of the net synaptic reversal potential, and the ratio of excitatory (AMPA-mediated) to inhibitory (GABAa-mediated) conductance as part of the total phase-dependent synaptic conductance (Fig. 7). Reversal potentials for GABAa were calculated from the Nernst potential equation for [Cl−] of the aCSF and intracellular solution. Similarly, the reversal potential for AMPA was calculated from the mean reversal of [Na+] and [K+]. To extrapolate I-V curves a first-order linear fit was achieved with the polyfit function in Matlab.
Figure 7.

A correlated rise and fall of excitation (gE) and inhibition (gI) in PYR cells results in balanced synaptic currents at the peak of the oscillation cycle, whereas in PV cells synaptic inputs are largely dominated by excitation. A. Across PYR cells (n = 8), the time course of gE (iqr=red) is correlated to gI (iqr=blue) (median=black) and current-balanced at the peak of high conductance synaptic input. Ai. Distribution of LFP phase during which PYR cells achieved peak gE (left) and peak gI (middle). Neither gE or gI are significantly different from the phase of spiking (right), recorded from these cells during on-cell configuration. Spiking results from a peak in gE despite a concurrent peak in gI. Aii. Ratio of gE:gI in PYR cells results in excitatory (red) and inhibitory (blue) synaptic currents that in summation (black), balance at the peak of an average oscillation cycle. Aiii. Most PYR cells exhibit a current-balanced ratio of gE:gI on a cell-by-cell basis when gE and gI in each cell is normalized to the peak of the cell’s total conductance. B. As in A, but for PV cells. Unlike PYR cells, PV cells (n = 8) are dominated by an unbalanced amount of high gE to low gI. Bi. Similar to Ai, the phase of peak gE (left) and gI (middle) in PV cells is not statistically different from the phase of on-cell spiking (right) in these cells. Bii. Net synaptic current (black) in PV cells is largely excitatory (red) with little inhibition (blue). Biii. The normalized ratio of gE:gI in PV cells is similar to B such that most PV cells exhibit greater amount of gE compared to gI.
Results
Pyramidal cells and fast-firing interneurons share similar spike phase-locking profiles
To assess the role of hippocampal neurons in generating intrinsic oscillations, we recorded the local field potential (LFP) in the distal subiculum of the isolated hippocampal preparation. Due to the thickness of the hippocampal preparation, traditional visualization using light microscopy is difficult. Instead, using 2-photon imaging, we targeted excitatory pyramidal (PYR) cells and fast-firing interneurons (PV) for cell-attached and subsequent whole-cell patch recordings using selective expression of the red fluorophore tdTomato under control of CaMKIIa and PV promoters, respectively.
Although oscillations in the isolated hippocampus tend to slow down over time (Fig. 1A, and Goutagny et al., 2009), spiking in PYR and PV cells remained strongly phase-locked (Fig. 2Ai, 2Bi) to the peak of the LFP (PYR & PV Mdn = −12.3°, IQR = 12.4°; n = 38, Fig. 1Bi) regardless of oscillation frequency (PYR & PV Mdn = 3.02 Hz, IQR = 1.13 Hz, n = 38; Fig. 1Ai and Fig. 2Aii, 2Bii). PYR and PV cells have been shown to be highly coherent with theta oscillations in area CA1, both in vivo and in the hippocampal preparation (Csicsvari et al., 1999; Klausberger & Somogyi, 2008; Huh et al., 2016). To understand the synaptic and intrinsic mechanisms establishing spike-phase in PYR and PV cells, we first carried out on-cell recordings and used the capacitive current associated with spikes (Fig. 2A, 2B) to determine the spike-phase relative to the LFP without perturbing the intracellular environment. In both PYR (n = 22) and PV cells (n = 16), spikes were phase locked (−20.7°, Fig. 2Ai; −23.3°, Fig. 2Bi) near the peak of the LFP, with the spike-phase not differing significantly between the two cell types (p > .10, Kuiper’s test), and independent of the LFP frequency (PYR Spearman’s rho = 0.09, p = 0.69, Fig. 2Aii; PV Spearman’s rho = 0.07, p = 0.80, Fig. 2Bii).
The spike rate in PYR cells (Mdn = 1.73 spk/cycle, IQR = 1.19 spk/cycle; Fig. 2Aiii) and PV cells (Mdn = 3.65 spk/cycle, IQR = 4.48 spk/cycle; Fig. 2Biii) was not significantly different (p = 0.08, Wilcoxon rank-sum test). Unfortunately, the low spike rate did not allow us to establish a burst-firing phenotype in subicular PYR cells, which have been shown to be differentially modulated during oscillations compared to regular-spiking pyramidal cells (Bohm et al., 2015). Furthermore, burst-firing may be substantially modulated by synaptic conductances during oscillations. Therefore, a more targeted approach using synaptic blockers and responses to step currents is necessary to determine which pyramidal cells exhibit the burst-firing phenotype and whether those cells differ during intrinsic hippocampal oscillations. Although we encountered a few pyramidal cells that exhibited bursting in response to synaptic excitation, like the majority of other pyramidal cells, these cells also spiked at the peak of oscillations.
Next, we used whole-cell patch clamp to quantify membrane properties of neurons actively participating in the network oscillation. Consistent with previous work (Huh et al., 2016), spikes in PYR cells (n = 14, Fig. 3Ai) had significantly (p < .01, Wilcoxon rank-sum test) longer half-widths (Mdn = 0.80 ms, IQR = 0.10 ms) and a lower voltage threshold (Mdn = −48.8 mV, IQR = 2.2 mV) compared to PV cells (Mdn = 0.30 ms, IQR = 0.10 ms; Mdn = −42.3 mV, IQR = 5.4 mV; n = 8, Fig. 3Bi). To determine input resistance and membrane time constant, we applied repeated presentations of a small hyperpolarizing current step at the resting membrane voltage (PYR Mdn = −61.4 mV, IQR = 4.4 mV, Fig. 4A, 4Ai; PV Mdn = −54.7 mV, IQR = 6.4 mV, Fig. 4B, 4Bi). To mitigate the effects of spiking non-linearities on measures of resistance, we averaged the membrane voltage response using non-spiking regions during the LFP trough (~180°, Fig. 4A, 4B). When assessed near the resting membrane voltage, properties such as input resistance (PYR Mdn = 83.8 MΩ, IQR = 47.9 MΩ; PV Mdn = 73.2 MΩ, IQR = 18.0 MΩ) and membrane time constant (PYR Mdn = 9.65 ms, IQR = 2.91 ms; PV Mdn = 7.32 ms, IQR = 11.9 ms) were not significantly different between the two cell types (p > 0.1, Wilcoxon rank-sum test; Fig. 4Ai, 4Bi). Given the similarities between PYR and PV cells in terms of spike phase and membrane properties, the significant differences in spike characteristics provides confirmation of cell-specific targeting of tdTomato.
Membrane voltage is correlated to LFP oscillations
In the absence of any current injection, the membrane potential in both PYR and PV cell at 0 ms lag was positively correlated with the LFP (PYR Mdn = 0.69, IQR = 0.13, Fig. 5A; PV Mdn = 0.58, IQR = 0.13, Fig. 5B). This indicates that membrane voltage in both cell types depolarizes with the rise of the LFP, and that spiking, phase-locked to the peak of intrinsic oscillations, results from this strong depolarization.
In the above experiments it was unclear, however, whether cells were being excited or released from inhibition. To address the synaptic mechanisms establishing spike activity during oscillations, we injected cells with different amounts of positive or negative current and measured the cross-correlation coefficient between intracellular membrane voltage and the LFP across a range of different membrane voltage values. We hypothesized that the correlation coefficient would vary with membrane voltage (Fig. 5Ai, 5Bi) depending on the nature of synaptic inputs driving spike activity in PYR and PV cells. Furthermore, the amount of synaptic conductance will determine how strongly the membrane voltage is clamped at the net synaptic reversal potential.
From data shown in Figure 5, it is clear that in both PYR and PV cells a strong synaptic conductance drives depolarizations during the peak of the LFP. In contrast, during the trough of the LFP, the membrane voltage is easily changed with different levels of DC current. When the membrane voltage at the trough is made to match the synaptic reversal potential at the peak, the resulting membrane voltage trace does not correlate to the LFP because the driving force associated with net synaptic activity is zero. Using this method, we assessed the net synaptic reversal potential of LFP correlated inputs in PYR and PV cells.
Data from PYR cells showed that the normalized cross-correlation coefficients (Fig. 5Ai) crossed zero near a membrane voltage value (−52.3 mV), a value between the reversal for GABAa-mediated inhibition (−62.2 mV) and AMPA-mediated excitation (−1.5 mV). Thus, synaptic conductance onto PYR cells was a mixture of excitatory (gE) and inhibitory conductance (gI). On the other hand, PV cells were subjected to a synaptic conductance that clamped the membrane voltage to a value closer to the excitatory reversal potential. This is apparent in the example PV recording (Fig. 5B), where the trough voltage is unable to be depolarized with injected current beyond the reversal potential at the peak. Thus, the LFP remains positively correlated to the membrane voltage of PV cells even at highly depolarized voltages (Fig. 5Bi), suggesting a mostly excitatory synaptic conductance. Our direct measurements of relatively large synaptic currents (Fig. 6A, 6B) closely match the phase-dependent behavior of the membrane voltage (Fig. 5A, 5B) suggesting that synaptic inputs largely drive spiking output directly, rather than being dependent on intrinsic membrane properties to amplify certain input frequencies.
Pyramidal cells and interneurons experience a high conductance state during the peak of oscillations
To achieve a precise measurement of synaptic conductances, as well as the time course for excitatory and inhibitory inputs, we relied on a separate set of experiments in which we voltage-clamped PYR (n = 8) and PV (n = 8) cells to determine the time course and amount of excitatory (gE) and inhibitory conductance (gI) during an oscillation cycle. For these experiments, it was necessary to add QX-314 to the intracellular solution to block Na+ channels (Connors & Prince, 1982) and eliminate any spike-induced non-linearities in the I-V curves.
Utilizing average current values measured at the trough and peak from multiple holding voltages (Fig. 6A, 6B), we constructed I-V curves at the peak and trough of the oscillation cycle (Fig. 6Ai, 6Bi). For all clamping voltages, the average current values were greater at the peak of the LFP compared to the trough. The larger changes in current as a function of voltage indicated a greater slope and hence conductance values near the peak of oscillations. This was true for both PYR and PV cells, and consistent with our observations in current clamp mode (Fig. 5A, 5B). In addition, synaptic currents oscillate at theta-like frequencies (Fig. 6Aiii/i, 6Biii/i) directly influencing membrane voltage, in contrast to mechanisms that preferentially amplify theta frequencies in the membrane voltage due to voltage-gated ion channels (Cobb et al., 1995; Hu et al., 2002; Zemankovics et al., 2010).
The intersection of the two I-V curves corresponds to the net synaptic reversal potential at the peak of oscillations (Fig. 6Ai). Using the change in slope, intersection, and assuming synaptic activity arises largely from AMPA and GABAa-mediated activity, we calculated the relative contribution and time course of gE and gI during an oscillation cycle. This approach is identical to past studies that have used these measures to extract synaptic conductance changes during anesthesia-induced up-states (Haider et al., 2006).
During the peak change in conductance in PYR cells, the average synaptic reversal (Mdn = −51.9 mV, IQR = 23.9 mV, Fig. 6Aii) was peri-threshold. This was consistent with our measures in current clamp mode in which the cross-correlation between the membrane voltage and the LFP fell to values of zero near −50 mV. These measures are indicative of balanced inputs in which precise amounts of excitatory and inhibitory conductance sum to produce a membrane voltage depolarization that drives precise spiking behavior (Wehr & Zador 2003; Haider et al., 2006; Atallah & Scanziani, 2009; Gan et al., 2017). For PV cells, even at highly depolarized holding voltages, an inward current was always present at the peak of the LFP. This indicated a synaptic reversal much more depolarized than that observed in PYR cells. Consequently, depolarizing PV cells to voltages where the change in current was zero between trough and peak of the LFP (i.e. where the two I-V curves intersect) was not possible due to the extremely large amount of current required to hold the cell at depolarized potentials. Therefore, for PV cells, the synaptic reversal potential (Mdn = −13.2 mV, IQR = 21.1 mV, Fig. 6Bii) was extrapolated from linear portions of the I-V curves generated at the trough and peak (Fig. 6Bi). These measures suggest that PYR cells receive a mixture of excitatory and inhibitory synaptic conductance inputs, while an excitatory conductance is largely dominant in PV cells.
Pyramidal cells, but not interneurons, are driven by balanced inputs during hippocampal oscillations
Next, we quantified changes in conductance, relative to the trough, for every 4° phase bin of the LFP, as well as the corresponding reversal potentials, to determine the relative contribution of gE and gI to phase-specific conductance changes during LFP oscillations. PYR cells experienced a concomitant increase and subsequent decrease in gE and gI, with nearly a 100% increase in total conductance during the peak (Mdn increase = 8.14 nS, IQR = 8.36 nS), relative to the trough (Mdn = 8.11 nS, IQR = 4.06 nS). The high conductance state during spiking is largely due to gI. Nevertheless, inhibition does not prevent firing because of the much larger driving force associated with gE (H [2] = 2.11, p = .35, Kruskal-Wallis test; Fig. 7Ai).
We calculated the phase-dependent excitatory and inhibitory currents during an oscillation cycle (Fig. 7aii) using the mean excitatory and inhibitory conductances calculated from voltage-clamped PYR cells (n = 8) and the mean membrane voltage of current-clamped PYR cells (n = 14) with no injected current (Fig. 3). The net synaptic current tends to be inward or depolarizing at the beginning of an oscillation cycle, and becomes balanced at the peak of the cycle as membrane voltage reaches spike threshold and the net synaptic reversal.
We normalized the amount of gI and gE in each PYR cell to its total peak conductance to ascertain the phase-dependent gE to gI ratios (Fig. 7Aiii). The rise and fall of gE and gI is similar to results in Fig. 7A, indicating balanced synaptic currents during peak conductance, and leading to peri-threshold membrane voltage values at the peak of LFP oscillations (Mdn gE:gI= 1 : 7.04). Hence, despite variability in the absolute conductance levels, excitatory and inhibitory synaptic currents are correlated and balanced in individual PYR cells.
Although PV cells also experienced a high conductance state during the peak of intrinsic oscillations (Mdn = 9.87 nS, IQR = 6.78 nS), the conductance change was the result of excitatory conductance, with only a small contribution from inhibition (Fig. 7B). The resulting net inward current (Fig. 7Bii), easily drives spiking in PV cells (H [2] = 0.06, p = .97, Kruskal-Wallis test; Fig. 7Bi). The normalized ratio of gE to gI in PV cells, therefore, was skewed largely in favor of excitatory conductance inputs (Fig. 7Biii). Together, these data suggest that circuitry in the subicular region of hippocampus is comprised of recurrent excitation between PYR cells that simultaneously also excites PV cells, which fire spikes and feedback inhibition onto PYR cells, but not to other PV cells.
Oscillations generate a small steady-state conductance in pyramidal cells, but not interneurons
Given the intensity of synaptic activity and continuous spiking, we speculated that there may be an additional amount of conductance that is present during the trough of the LFP oscillation. To test this, we used the AMPA-R antagonist DNQX (20 µM) to eliminate oscillations in the whole hippocampal preparation, as well as intracellular activity that underlies spiking (Fig. 8A). Subsequently, using a small step hyperpolarization to measure input resistance and time constant values at the resting membrane potential, we assessed whether the presence of oscillations had a steady-state impact on membrane properties (Fig. 8B).
Compared to the membrane properties gathered during the trough of LFP oscillations (Fig. 4Ai, 4Bi), DNQX significantly altered the resting membrane potential, membrane time constant and input resistance of PYR cells (n = 7, p = .016, Wilcoxon signed-rank test; Fig. 8Ai), due to an additional 3 nS of leak conductance present during oscillations. In contrast, PV cells remained unchanged in their membrane properties after DNQX application (n=4, p = .65 or .13 for resting voltage, Wilcoxon signed-rank test; Fig. 8Bi). As a result, during oscillations, PYR cells received balanced synaptic inputs that drive peak depolarizations, as well as a steady-state background conductance, while PV cells lack the steady-state conductance and are driven almost exclusively by excitation.
Discussion
To address the synaptic mechanisms of intrinsic hippocampal oscillations, we gathered LFP and intracellular recordings from specific cell types in the whole hippocampal preparation. Our recordings reveal that pyramidal cells and fast-firing interneurons exhibit simultaneous, phase-locked firing similar to those observed during movement-evoked theta oscillations in the hippocampus (Fox et al., 1986; Skaggs et al., 1996; Csicsvari et al., 1999, Stark et al., 2013). The synaptic mechanisms of these slow autonomous oscillations, however, resembled those generating in vivo gamma oscillations and ripples (Atallah & Scanziani, 2009; English et al., 2014; Gan et al., 2017). Similar to these high frequency hippocampal oscillations, as well as lower frequency cortical oscillations (Shu et al., 2003; Haider et al., 2006; Tahvildari et al., 2012), we find that balanced and correlated inputs underlie the periodic depolarization in pyramidal cells, and drive spiking locked to the peak of network oscillations.
Balanced excitation and inhibition and the generation of network oscillations
From our recordings, we infer that recurrent excitation from pyramidal cells provides positive feedback that induces simultaneous firing throughout the entire network. This includes fast-firing interneurons that contribute strong negative feedback by shunting excitatory drive to pyramidal cells in the network. What results is a large depolarization that drives pyramidal cell membrane voltage to spike threshold during the peak of inhibition. Overall, our data and analyses are inconsistent with spike phase-locking in pyramidal cells resulting from rebound spiking or membrane resonance as suggested previously for theta oscillations. In particular, any rebound spiking would require that spike generation follows a bout of inhibition (Cobb et al., 1995, Stark et al., 2013), something that was never observed since peak spiking probability coincided with peak synaptic excitatory and inhibitory conductance. Therefore, our results are similar to extracellular recordings from movement-associated (type I) theta, where pyramidal cells and interneurons fire in-phase with each other (Fox et al., 1986; Skaggs et al., 1996; Csicsvari et al., 1999, Stark et al., 2013). This is in contrast to anesthesia-induced theta (type II) where PV cells prior to PYR cells (Klausberger and Somogyi, 2008) in support of the post-inhibitory rebound spiking mechanism.
Additionally, membrane resonance mechanisms would require a significant amplification of theta inputs by intrinsic membrane properties (Hu et al., 2002, Zemankovics et al., 2010). Our measures of synaptic currents in voltage clamp, however, indicated that a large net synaptic input drove periodic depolarization and spiking in pyramidal cells, suggesting membrane properties that amplify synaptic inputs would be secondary to network properties that maintain balanced currents. Further, any membrane resonance would likely be overwhelmed by the high conductance associated with synaptic-mediated inputs (Fernandez & White, 2008).
The theta-like activity we observed in hippocampus, however, likely differs from that observed in vivo (Fox et al., 1986; Skaggs et al., 1996; Csicsvari et al., 1999, Stark et al., 2013). Most notably, we observed lower frequencies in network oscillations than those typically associated with theta activity in awake, behaving animals. Along with inputs from medial septum (Freund & Antal, 1988; Lee et al., 1994), theta activity in vivo likely involves many additional factors. Nevertheless, the activity we observed indicates that the network architecture in hippocampus supports a tight balance that maintains remarkably similar levels of excitatory and inhibitory currents in pyramidal cells during network-wide oscillations.
In our study, the network activity underlying intrinsically generated oscillations shares many similarities to other in vivo oscillations. Hippocampal gamma oscillations and ripples, as well as cortical up-down state transitions, have been shown to be generated through a mechanism involving balanced excitation and inhibition in principal excitatory cells (Shu et al., 2003; Haider et al., 2006; Atallah & Scanziani, 2009; Tahvildari et al., 2012; Gan et al., 2017). A simultaneous rise in excitatory and inhibitory synaptic current produces depolarization in pyramidal cells that drives spiking phase-locked to the peak of the network oscillations.
In the case of hippocampal oscillations at gamma (Atallah & Scanziani, 2009) and ripple frequencies (English et al., 2014; Gan et al., 2017), interneurons provide negative feedback that is tightly coupled to the rise of excitatory current in individual pyramidal cells. During both the oscillations we recorded and these faster hippocampal oscillations, peak inhibitory and excitatory currents are approximately balanced and drive pyramidal cells to membrane voltage values near spike threshold. Similarly, reoccurring up-down states in the cortex (Haider et al., 2006), often oscillatory in the range of 0.5–2 Hz, have been shown to be generated through a near-simultaneous rise in excitatory and inhibitory currents. Although inhibitory conductance was greater than excitation, the reduced driving force for inhibition leads to excitatory and inhibitory currents that are balanced near spike threshold. Our results extend the ability for balanced activity in pyramidal cells, and tightly coupled negative feedback from fast-firing interneurons, to generate hippocampal oscillations at low theta frequencies.
Comparisons to intrinsic oscillations in other hippocampal regions
Previous studies of the isolated hippocampal preparation did not find significant excitatory drive in area CA1 pyramidal cells. Instead, inhibitory currents in CA1 pyramidal cells at the peak of intrinsic oscillations resulted in rebound spiking during the trough (Goutagny et al., 2009, Huh et al., 2016), in line with juxtacellular recordings during anesthesia-induced theta (Klausberger and Somogyi, 2008). This is in contrast to our recordings from pyramidal cells in the distal subiculum, which spiked at the peak of balanced E/I currents and the LFP oscillation, with no synaptic or spiking activity during the trough. Our data, however, matches previous extracellular recordings of pyramidal cells in distal CA1/proximal subiculum from mice as old as 5 weeks, which spike during the peak of intrinsic oscillations (Amilhon et al., 2015).
On the other hand, we found PV cells exhibited similar spiking behavior in our subicular recordings compared to those from CA1. In both areas, PV cells spiked at the peak of oscillations and excitatory synaptic drive. However, we recorded only excitatory conductance in subicular PV cells, whereas PV cells in CA1 exhibited some, albeit small, inhibitory conductance as well (Huh et al., 2016), likely from significant reciprocal PV connections (Bartos et al., 2002). The lack of inhibition in PV cells we observed is surprising in light of studies showing substantial reciprocal connections between fast-firing interneurons in the subiculum (Bohm et al., 2015) and presubiculum (Peng et al., 2017). It is uncertain, however, whether past results are specific to parvalbumin-expressing interneurons or include non-PV cells. Additionally, PV interneurons have been shown to undergo synaptic depression as a result of sustained activity (Stark et al., 2013), which may limit their recurrent inhibition during theta oscillations.
The region-specific differences in pyramidal cell behavior, and thus proposed mechanisms underlying intrinsic oscillations could potentially result from differences in network architecture. Both the subiculum and CA3 are independent oscillators in the isolated hippocampus (Jackson et al., 2011; Jackson et al., 2014), and both areas share extensive axon collateralization of pyramidal cells (Witter, 2007; Harris et al., 2001). In contrast, area CA1 lacks this degree of recurrent architecture (Deuchars & Thomson, 1996), which may preclude strong positive feedback mechanisms. Instead, pyramidal cells in CA1 project their axons throughout the subiculum (Amaral et al., 1991). However, a recent study in the whole hippocampal preparation revealed the existence of pyramidal cell-to-cell connections within the longitudinal CA1 axis, in contrast to their absence from transverse hippocampal slices (Yang et al., 2014).
Comparison of intrinsic subicular oscillations to tightly-balanced networks
The neuronal behavior we recorded in subiculum shares characteristics with tightly balanced networks in vivo (Wehr & Zador, 2003; Wilent & Contreras, 2005; Haider et al., 2006; Okun & Lampl, 2008). In particular, excitation and inhibition are strongly correlated on very short timescales, and exhibit strong phase-locked spiking at the peak of synaptic input. This is in contrast to loosely-balanced networks in which overall network firing rates of E and I cells are balanced, but synaptic currents in individual neurons may not be (Deneve & Machens, 2016). Tight balance imparts networks with an integration window in which spiking behavior can be influenced by the network state (Gabernet et al., 2005; Higley & Contreras, 2006). Changes in this balance correspond to changes in LFP oscillations and individual neuronal spike activity (Atallah & Scanziani, 2009).
In contrast to hippocampal brain slices that require pharmacological application to induce theta-like activity (Fellous & Sejnowski, 2000), oscillations in our preparation occurred spontaneously. The propensity for hippocampal oscillations without pharmacology is likely the result of increased recurrent network connectivity provided by the whole hippocampal tissue. For example, cortical slices have been shown to generate intrinsic oscillations as a result of recurrent excitation and balanced inputs (Shu et al., 2003, Tahvildari et al., 2012). Additionally, the subiculum can independently generate oscillations (Jackson et al., 2014) even when removed from the whole hippocampal preparation (Jackson et al., 2011). This suggests that recurrent architecture is an important component for in vitro rhythmogenesis, which may be absent from transverse hippocampal slices.
A potential source for the timescale of slower cortical slice oscillations are potassium conductances that increase during depolarization or spiking (Sanchez-Vives & McCormick, 2000; Tahvildari et al., 2012). In cortical slices undergoing oscillations, the increased conductance was measured once spiking had ceased, during the down state or trough. Consistent with this scenario, our current clamp recordings did indicate a significant difference in conductance between the trough state during oscillations and the neuron’s intrinsic conductance when oscillations were pharmacologically blocked. This increased conductance at the trough is likely the result of continuous spiking during the peak when balanced inputs drive membrane voltage to spike threshold. In cortical slices, repetitive spiking creates long refractory periods during the trough of the oscillation (Compte et al., 2003), whereas in the hippocampal preparation fewer spikes could generate a shorter refractory period resulting in faster oscillations. Although potassium conductances likely play a role in setting the refractory period during intrinsic hippocampal oscillations as well, further investigation will be needed to determine how much of the trough conductance we recorded is due to cycle to cycle spiking versus increased potassium conductance due to consistent spiking over long periods of time. The latter could explain the increase in refractory period/decrease in oscillation frequency that occurs over time in the hippocampal preparation.
Acknowledgments
Funding Sources
Funding was provided by the National Institutes of Health (grant: R01 MH085074 and R03 MH103728).
Footnotes
Conflict of Interest None
Contributor Information
Feliks Royzen, Interdepartmental Program in Neuroscience, University of Utah, Salt Lake City, Utah 84112, USA; Department of Biomedical Engineering, Boston University, Boston, Massachusetts 02215, USA.
Sylvain Williams, Department of Psychiatry, McGill University, Montreal, Quebec H4H 1R3, Canada.
Fernando R Fernandez, Department of Biomedical Engineering, Center for Systems Neuroscience, Boston University, Boston, Massachusetts 02215, USA.
John A White, Department of Biomedical Engineering, Center for Systems Neuroscience, Boston University, Boston, Massachusetts 02215, USA.
References
- Amaral DG, Dolorfo C, & Alvarez-Royo P (1991). Organization of CA1 projections to the subiculum: a PHA-L analysis in the rat. Hippocampus, 1(4), 415–435. 10.1002/hipo.450010410 [DOI] [PubMed] [Google Scholar]
- Amilhon B, Huh CYL, Manseau F, Ducharme G, Nichol H, Adamantidis A, & Williams S (2015). Parvalbumin Interneurons of Hippocampus Tune Population Activity at Theta Frequency. Neuron, 86(5), 1277–1289. 10.1016/j.neuron.2015.05.027 [DOI] [PubMed] [Google Scholar]
- Anderson JS, Carandini M, & Ferster D (2000). Orientation tuning of input conductance, excitation, and inhibition in cat primary visual cortex. Journal of Neurophysiology, 84(2), 909–926. 10.1152/jn.2000.84.2.909 [DOI] [PubMed] [Google Scholar]
- Atallah BV, & Scanziani M (2009). Instantaneous modulation of gamma oscillation frequency by balancing excitation with inhibition. Neuron, 62(4), 566–577. 10.1016/j.neuron.2009.04.027 [DOI] [PMC free article] [PubMed] [Google Scholar]
- Bartos M, Vida I, Frotscher M, Meyer A, Monyer H, Geiger JRP, & Jonas P (2002). Fast synaptic inhibition promotes synchronized gamma oscillations in hippocampal interneuron networks. Proceedings of the National Academy of Sciences of the United States of America, 99(20), 13222–13227. 10.1073/pnas.192233099 [DOI] [PMC free article] [PubMed] [Google Scholar]
- Böhm C, Peng Y, Maier N, Winterer J, Poulet JFA, Geiger JRP, & Schmitz D (2015). Functional Diversity of Subicular Principal Cells during Hippocampal Ripples. The Journal of Neuroscience: The Official Journal of the Society for Neuroscience, 35(40), 13608–13618. 10.1523/JNEUROSCI.5034-14.2015 [DOI] [PMC free article] [PubMed] [Google Scholar]
- Cobb SR, Buhl EH, Halasy K, Paulsen O, & Somogyi P (1995). Synchronization of neuronal activity in hippocampus by individual GABAergic interneurons. Nature, 378(6552), 75–78. 10.1038/378075a0 [DOI] [PubMed] [Google Scholar]
- Compte A, Sanchez-Vives MV, McCormick DA, & Wang X-J (2003). Cellular and network mechanisms of slow oscillatory activity (<1 Hz) and wave propagations in a cortical network model. Journal of Neurophysiology, 89(5), 2707–2725. 10.1152/jn.00845.2002 [DOI] [PubMed] [Google Scholar]
- Connors BW, & Prince DA (1982). Effects of local anesthetic QX-314 on the membrane properties of hippocampal pyramidal neurons. The Journal of Pharmacology and Experimental Therapeutics, 220(3), 476–481. [PubMed] [Google Scholar]
- Csicsvari J, Hirase H, Czurkó A, Mamiya A, & Buzsáki G (1999). Oscillatory coupling of hippocampal pyramidal cells and interneurons in the behaving Rat. The Journal of Neuroscience: The Official Journal of the Society for Neuroscience, 19(1), 274–287. 10.1523/JNEUROSCI.19-01-00274.1999 [DOI] [PMC free article] [PubMed] [Google Scholar]
- Denève S, & Machens CK (2016). Efficient codes and balanced networks. Nature Neuroscience, 19(3), 375–382. 10.1038/nn.4243 [DOI] [PubMed] [Google Scholar]
- Deuchars J, & Thomson AM (1996). CA1 pyramid-pyramid connections in rat hippocampus in vitro: dual intracellular recordings with biocytin filling. Neuroscience, 74(4), 1009–1018. 10.1016/0306-4522(96)00251-5 [DOI] [PubMed] [Google Scholar]
- Drexel M, Romanov RA, Wood J, Weger S, Heilbronn R, Wulff P, … Sperk G (2017). Selective Silencing of Hippocampal Parvalbumin Interneurons Induces Development of Recurrent Spontaneous Limbic Seizures in Mice. The Journal of Neuroscience: The Official Journal of the Society for Neuroscience, 37(34), 8166–8179. 10.1523/JNEUROSCI.3456-16.2017 [DOI] [PMC free article] [PubMed] [Google Scholar]
- English DF, Peyrache A, Stark E, Roux L, Vallentin D, Long MA, & Buzsáki G (2014). Excitation and Inhibition Compete to Control Spiking during Hippocampal Ripples: Intracellular Study in Behaving Mice. The Journal of Neuroscience, 34(49), 16509–16517. 10.1523/JNEUROSCI.2600-14.2014 [DOI] [PMC free article] [PubMed] [Google Scholar]
- Fellous JM, & Sejnowski TJ (2000). Cholinergic induction of oscillations in the hippocampal slice in the slow (0.5–2 Hz), theta (5–12 Hz), and gamma (35–70 Hz) bands. Hippocampus, 10(2), 187–197. [DOI] [PubMed] [Google Scholar]
- Fernandez FR, & White JA (2008). Artificial synaptic conductances reduce subthreshold oscillations and periodic firing in stellate cells of the entorhinal cortex. The Journal of Neuroscience: The Official Journal of the Society for Neuroscience, 28(14), 3790–3803. 10.1523/JNEUROSCI.5658-07.2008 [DOI] [PMC free article] [PubMed] [Google Scholar]
- Fox SE, Wolfson S, & Ranck JB (1986). Hippocampal theta rhythm and the firing of neurons in walking and urethane anesthetized rats. Experimental Brain Research, 62(3), 495–508. 10.1007/BF00236028 [DOI] [PubMed] [Google Scholar]
- Freund TF, & Antal M (1988). GABA-containing neurons in the septum control inhibitory interneurons in the hippocampus. Nature, 336(6195), 170–173. 10.1038/336170a0 [DOI] [PubMed] [Google Scholar]
- Gabernet L, Jadhav SP, Feldman DE, Carandini M, & Scanziani M (2005). Somatosensory integration controlled by dynamic thalamocortical feed-forward inhibition. Neuron, 48(2), 315–327. 10.1016/j.neuron.2005.09.022 [DOI] [PubMed] [Google Scholar]
- Gan J, Weng S, Pernía-Andrade AJ, Csicsvari J, & Jonas P (2017). Phase-Locked Inhibition, but Not Excitation, Underlies Hippocampal Ripple Oscillations in Awake Mice In Vivo. Neuron, 93(2), 308–314. 10.1016/j.neuron.2016.12.018 [DOI] [PMC free article] [PubMed] [Google Scholar]
- Goutagny R, Jackson J, & Williams S (2009). Self-generated theta oscillations in the hippocampus. Nature Neuroscience, 12(12), 1491–1493. 10.1038/nn.2440 [DOI] [PubMed] [Google Scholar]
- Haider B, Duque A, Hasenstaub AR, & McCormick DA (2006). Neocortical Network Activity In Vivo Is Generated through a Dynamic Balance of Excitation and Inhibition. Journal of Neuroscience, 26(17), 4535–4545. 10.1523/JNEUROSCI.5297-05.2006 [DOI] [PMC free article] [PubMed] [Google Scholar]
- Harris E, Witter MP, Weinstein G, & Stewart M (2001). Intrinsic connectivity of the rat subiculum: I. Dendritic morphology and patterns of axonal arborization by pyramidal neurons. The Journal of Comparative Neurology, 435(4), 490–505. 10.1002/cne.1046 [DOI] [PMC free article] [PubMed] [Google Scholar]
- Higley MJ, & Contreras D (2006). Balanced excitation and inhibition determine spike timing during frequency adaptation. The Journal of Neuroscience: The Official Journal of the Society for Neuroscience, 26(2), 448–457. 10.1523/JNEUROSCI.3506-05.2006 [DOI] [PMC free article] [PubMed] [Google Scholar]
- Hippenmeyer S, Vrieseling E, Sigrist M, Portmann T, Laengle C, Ladle DR, & Arber S (2005). A developmental switch in the response of DRG neurons to ETS transcription factor signaling. PLoS Biology, 3(5), e159 10.1371/journal.pbio.0030159 [DOI] [PMC free article] [PubMed] [Google Scholar]
- Hu H, Vervaeke K, & Storm JF (2002). Two forms of electrical resonance at theta frequencies, generated by M-current, h-current and persistent Na+ current in rat hippocampal pyramidal cells. The Journal of Physiology, 545(Pt 3), 783–805. 10.1113/jphysiol.2002.029249 [DOI] [PMC free article] [PubMed] [Google Scholar]
- Huh CYL, Amilhon B, Ferguson KA, Manseau F, Torres-Platas SG, Peach JP, … Williams S (2016). Excitatory Inputs Determine Phase-Locking Strength and Spike-Timing of CA1 Stratum Oriens/Alveus Parvalbumin and Somatostatin Interneurons during Intrinsically Generated Hippocampal Theta Rhythm. The Journal of Neuroscience: The Official Journal of the Society for Neuroscience, 36(25), 6605–6622. 10.1523/JNEUROSCI.3951-13.2016 [DOI] [PMC free article] [PubMed] [Google Scholar]
- Jackson J, Amilhon B, Goutagny R, Bott J-B, Manseau F, Kortleven C, … Williams S (2014). Reversal of theta rhythm flow through intact hippocampal circuits. Nature Neuroscience, 17(10), 1362–1370. 10.1038/nn.3803 [DOI] [PubMed] [Google Scholar]
- Jackson J, Goutagny R, & Williams S (2011). Fast and slow γ rhythms are intrinsically and independently generated in the subiculum. The Journal of Neuroscience: The Official Journal of the Society for Neuroscience, 31(34), 12104–12117. 10.1523/JNEUROSCI.1370-11.2011 [DOI] [PMC free article] [PubMed] [Google Scholar]
- Klausberger T, & Somogyi P (2008). Neuronal diversity and temporal dynamics: the unity of hippocampal circuit operations. Science (New York, N.Y.), 321(5885), 53–57. 10.1126/science.1149381 [DOI] [PMC free article] [PubMed] [Google Scholar]
- Lee MG, Chrobak JJ, Sik A, Wiley RG, & Buzsáki G (1994). Hippocampal theta activity following selective lesion of the septal cholinergic system. Neuroscience, 62(4), 1033–1047. 10.1016/0306-4522(94)90341-7 [DOI] [PubMed] [Google Scholar]
- Madisen L, Zwingman TA, Sunkin SM, Oh SW, Zariwala HA, Gu H, … Zeng H (2010). A robust and high-throughput Cre reporting and characterization system for the whole mouse brain. Nature Neuroscience, 13(1), 133–140. 10.1038/nn.2467 [DOI] [PMC free article] [PubMed] [Google Scholar]
- Okun M, & Lampl I (2008). Instantaneous correlation of excitation and inhibition during ongoing and sensory-evoked activities. Nature Neuroscience, 11(5), 535–537. 10.1038/nn.2105 [DOI] [PubMed] [Google Scholar]
- Peng Y, Barreda Tomás FJ, Klisch C, Vida I, & Geiger JRP (2017). Layer-Specific Organization of Local Excitatory and Inhibitory Synaptic Connectivity in the Rat Presubiculum. Cerebral Cortex (New York, N.Y.: 1991), 27(4), 2435–2452. 10.1093/cercor/bhx049 [DOI] [PMC free article] [PubMed] [Google Scholar]
- Rudolph M, Pospischil M, Timofeev I, & Destexhe A (2007). Inhibition Determines Membrane Potential Dynamics and Controls Action Potential Generation in Awake and Sleeping Cat Cortex. Journal of Neuroscience, 27(20), 5280–5290. 10.1523/JNEUROSCI.4652-06.2007 [DOI] [PMC free article] [PubMed] [Google Scholar]
- Sanchez-Vives MV, & McCormick DA (2000). Cellular and network mechanisms of rhythmic recurrent activity in neocortex. Nature Neuroscience, 3(10), 1027–1034. 10.1038/79848 [DOI] [PubMed] [Google Scholar]
- Shu Y, Hasenstaub A, & McCormick DA (2003). Turning on and off recurrent balanced cortical activity. Nature, 423(6937), 288–293. 10.1038/nature01616 [DOI] [PubMed] [Google Scholar]
- Skaggs WE, McNaughton BL, Wilson MA, & Barnes CA (1996). Theta phase precession in hippocampal neuronal populations and the compression of temporal sequences. Hippocampus, 6(2), 149–172. [DOI] [PubMed] [Google Scholar]
- Stark E, Eichler R, Roux L, Fujisawa S, Rotstein HG, & Buzsáki G (2013). Inhibition-induced theta resonance in cortical circuits. Neuron, 80(5), 1263–1276. 10.1016/j.neuron.2013.09.033 [DOI] [PMC free article] [PubMed] [Google Scholar]
- Tahvildari B, Wölfel M, Duque A, & McCormick DA (2012). Selective Functional Interactions between Excitatory and Inhibitory Cortical Neurons and Differential Contribution to Persistent Activity of the Slow Oscillation. The Journal of Neuroscience : The Official Journal of the Society for Neuroscience, 32(35), 12165–12179. 10.1523/JNEUROSCI.1181-12.2012 [DOI] [PMC free article] [PubMed] [Google Scholar]
- Tsien JZ, Chen DF, Gerber D, Tom C, Mercer EH, Anderson DJ, … Tonegawa S (1996). Subregion- and cell type-restricted gene knockout in mouse brain. Cell, 87(7), 1317–1326. 10.1016/S0092-8674(00)81826-7 [DOI] [PubMed] [Google Scholar]
- Wehr M, & Zador AM (2003). Balanced inhibition underlies tuning and sharpens spike timing in auditory cortex. Nature, 426(6965), 442–446. 10.1038/nature02116 [DOI] [PubMed] [Google Scholar]
- Wilent WB, & Contreras D (2005). Dynamics of excitation and inhibition underlying stimulus selectivity in rat somatosensory cortex. Nature Neuroscience, 8(10), 1364–1370. 10.1038/nn1545 [DOI] [PubMed] [Google Scholar]
- Witter MP (2007). Intrinsic and extrinsic wiring of CA3: indications for connectional heterogeneity. Learning & Memory (Cold Spring Harbor, N.Y.), 14(11), 705–713. 10.1101/lm.725207 [DOI] [PubMed] [Google Scholar]
- Yang S, Yang S, Moreira T, Hoffman G, Carlson GC, Bender KJ, … Tang C-M (2014). Interlamellar CA1 network in the hippocampus. Proceedings of the National Academy of Sciences, 111(35), 12919–12924. 10.1073/pnas.1405468111 [DOI] [PMC free article] [PubMed] [Google Scholar]
- Zemankovics R, Káli S, Paulsen O, Freund TF, & Hájos N (2010). Differences in subthreshold resonance of hippocampal pyramidal cells and interneurons: the role of h-current and passive membrane characteristics. The Journal of Physiology, 588(Pt 12), 2109–2132. 10.1113/jphysiol.2009.185975 [DOI] [PMC free article] [PubMed] [Google Scholar]