J. R. Soc. Interface 16, 20190292 (October 2019; Published online 2 October 2019) (doi:10.1098/rsif.2019.0292)
We provide a comment to our paper ‘Humans falling in holes: adaptations in lower-limb joint mechanics in response to a rapid change in substrate height during human hopping’, in which we incorrectly reported the values in figure 7. While this does not change the overall results of our paper, the authors have updated figure 7 and the values associated with it and would like to apologize for any inconvenience caused.
Positive and negative mechanical work values for the ankle, knee and hip were divided by cycle time to calculate average positive and negative joint mechanical powers. (The original text where these changes apply: Methods, page 3, §2.3, paragraph 2, line 7.)
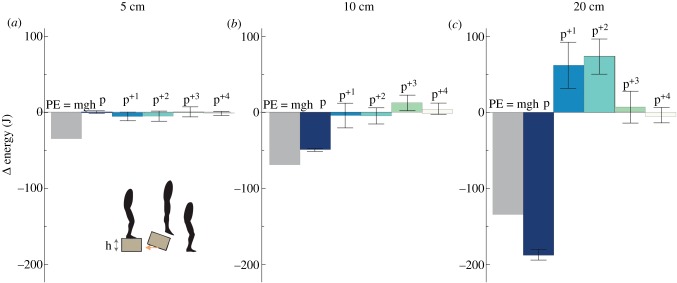
At 20 cm, on average, −187.1 ± 15.5 J of energy, which represents 1.4 times the change in potential energy due to the vertical perturbation (133 J), was dissipated upon the initial perturbation hop cycle, p (as negative joint work), and then subsequently recovered in the three following hop cycles (p+1; 61.6 ± 8.1 J, p+2; 73.1 ± 9.0 J, p+3; 6.4 ± 3.2 J) (figure 7c). (The original text where these changes apply: Results, page 5, §3.4, paragraph 1, line 7.)
Figure 7.
Assessing the rate of energy dissipation over hop cycles. Average (±s.e.) net limb work (energy) during continuous hop cycles (p, p+1, p+2, p+3, p+4) for the 5 cm (a), 10 cm (b) and 20 cm (c) drop heights compared with the change in the potential energy (PE) due to the drop height (h). Net limb energy (J) was calculated as the sum of the ankle, knee and hip net powers multiplied by the cycle duration for each hop cycle. The average change in PE (grey bar) was calculated for each subject as the product of subject mass (m), gravity (g) and drop height (h). (Online version in colour.)


